The main category of Forex News.
You can use the search box below to find what you need.
[wd_asp id=1]
The main category of Forex News.
You can use the search box below to find what you need.
[wd_asp id=1]
Silver prices (XAG/USD) extends its losses for the second consecutive day, trading around $33.60 during the Asian hours on Thursday. However, the downside of the Silver price could be restrained amid increased demand for safe-haven assets amid uncertainties surrounding the US elections and geopolitical risks.
Former President Donald Trump has made gains among Hispanic men as the November 5 US presidential election approaches, where he will face Democratic candidate Kamala Harris. According to an analysis of Reuters/Ipsos polling, Trump is now trailing Harris by only 2%, with support at 44% compared to her 46%.
Meanwhile, Harris has seen increased support among white women. In late 2020, white women favored Trump over Biden by 12%, but now they lean Republican by a margin of 3%. The race between the two candidates is extremely close, with Harris holding a slight lead of 46% to 43% in the latest poll conducted from October 16 to 21.
Silver prices are likely to rise due to safe-haven demand as traders keep a close eye on escalating geopolitical tensions in the Middle East. This comes in the wake of Israel’s military chief warning of a “very hard” strike on Iran if missile attacks continue. Lebanese Prime Minister Najib Mikati mentioned on Wednesday that US envoy Amos Hochstein indicated a possible ceasefire in the Israel-Hezbollah conflict could be achieved before the U.S. elections on November 5.
Additionally, investors are looking forward to China’s parliamentary meeting scheduled for November 4-8, where announcements regarding potential stimulus measures from Beijing are anticipated. Reports indicate that China is considering a stimulus package exceeding 10 trillion Yuan to boost its economy.
Silver is a precious metal highly traded among investors. It has been historically used as a store of value and a medium of exchange. Although less popular than Gold, traders may turn to Silver to diversify their investment portfolio, for its intrinsic value or as a potential hedge during high-inflation periods. Investors can buy physical Silver, in coins or in bars, or trade it through vehicles such as Exchange Traded Funds, which track its price on international markets.
Silver prices can move due to a wide range of factors. Geopolitical instability or fears of a deep recession can make Silver price escalate due to its safe-haven status, although to a lesser extent than Gold’s. As a yieldless asset, Silver tends to rise with lower interest rates. Its moves also depend on how the US Dollar (USD) behaves as the asset is priced in dollars (XAG/USD). A strong Dollar tends to keep the price of Silver at bay, whereas a weaker Dollar is likely to propel prices up. Other factors such as investment demand, mining supply – Silver is much more abundant than Gold – and recycling rates can also affect prices.
Silver is widely used in industry, particularly in sectors such as electronics or solar energy, as it has one of the highest electric conductivity of all metals – more than Copper and Gold. A surge in demand can increase prices, while a decline tends to lower them. Dynamics in the US, Chinese and Indian economies can also contribute to price swings: for the US and particularly China, their big industrial sectors use Silver in various processes; in India, consumers’ demand for the precious metal for jewellery also plays a key role in setting prices.
Silver prices tend to follow Gold’s moves. When Gold prices rise, Silver typically follows suit, as their status as safe-haven assets is similar. The Gold/Silver ratio, which shows the number of ounces of Silver needed to equal the value of one ounce of Gold, may help to determine the relative valuation between both metals. Some investors may consider a high ratio as an indicator that Silver is undervalued, or Gold is overvalued. On the contrary, a low ratio might suggest that Gold is undervalued relative to Silver.
EUR/USD fluctuates in a tight channel at around 1.0850 after closing the third consecutive day in positive territory on Wednesday. The near-term technical outlook suggests that the bullish bias remains intact but buyers could hesitate to bet on an extended uptrend unless the pair manages to clear the key technical hurdle at 1.0870.
The table below shows the percentage change of Euro (EUR) against listed major currencies this week. Euro was the strongest against the Australian Dollar.
| USD | EUR | GBP | JPY | CAD | AUD | NZD | CHF | |
|---|---|---|---|---|---|---|---|---|
| USD | -0.58% | -0.15% | -0.43% | 0.18% | 0.45% | 0.10% | -0.23% | |
| EUR | 0.58% | 0.53% | 0.07% | 0.76% | 1.12% | 0.68% | 0.37% | |
| GBP | 0.15% | -0.53% | 0.36% | 0.34% | 0.64% | 0.22% | 0.08% | |
| JPY | 0.43% | -0.07% | -0.36% | 0.67% | 0.25% | -0.21% | -0.28% | |
| CAD | -0.18% | -0.76% | -0.34% | -0.67% | 0.24% | -0.15% | -0.38% | |
| AUD | -0.45% | -1.12% | -0.64% | -0.25% | -0.24% | -0.46% | -0.74% | |
| NZD | -0.10% | -0.68% | -0.22% | 0.21% | 0.15% | 0.46% | -0.33% | |
| CHF | 0.23% | -0.37% | -0.08% | 0.28% | 0.38% | 0.74% | 0.33% |
The heat map shows percentage changes of major currencies against each other. The base currency is picked from the left column, while the quote currency is picked from the top row. For example, if you pick the Euro from the left column and move along the horizontal line to the US Dollar, the percentage change displayed in the box will represent EUR (base)/USD (quote).
The Euro gathered strength against its rivals on Wednesday after the data from Germany showed that the Gross Domestic Product (GDP) expanded by 0.2% on a quarterly basis in the third quarter, coming in better than the market expectation for a 0.1% contraction. Additionally, annual inflation in Germany, as measured by the Consumer price Index (CPI) rose to 2% in October’s flash estimate from 1.6% in September, further boosting the Euro.
On the other hand, mixed macroeconomic data releases from the US made it difficult for the US Dollar (USD) to stay resilient against its rivals. The ADP Employment Change arrived at 233,000 for October to beat analysts’ estimate by a wide margin, while the first estimate of the annualized GDP growth for the third quarter came in at 2.8% and fell short of the market consensus of 3%.
Later in the day, the Harmonized Index of Consumer Prices (HICP) data from the Eurozone and the Personal Consumption Expenditures (PCE) Price Index figures from the US will be featured in the economic calendar. Investors are likely to ignore these readings. The US GDP report showed on Wednesday that the PCE Price Index rose 1.5% in Q3, down from 2.5% in Q2. Hence, the monthly PCE inflation reading for September is unlikely to trigger a reaction.
Toward the end of the European session, month-end flows could ramp up market volatility and cause major pairs to move irregularly.
The Relative Strength Index (RSI) indicator on the 4-hour chart holds above 60, suggesting that the bullish bias remains intact. On the upside, the 200-day Simple Moving Average (SMA) aligns as a key resistance level at 1.0870. Once the pair flips that level into support, 1.0900 (round level) could act as interim resistance before 1.0940 (100-day SMA).
On the downside, first support could be seen at 1.0800 (round level) before 1.0750 (static level) and 1.0700 (round level, static level).
The Euro is the currency for the 19 European Union countries that belong to the Eurozone. It is the second most heavily traded currency in the world behind the US Dollar. In 2022, it accounted for 31% of all foreign exchange transactions, with an average daily turnover of over $2.2 trillion a day. EUR/USD is the most heavily traded currency pair in the world, accounting for an estimated 30% off all transactions, followed by EUR/JPY (4%), EUR/GBP (3%) and EUR/AUD (2%).
The European Central Bank (ECB) in Frankfurt, Germany, is the reserve bank for the Eurozone. The ECB sets interest rates and manages monetary policy. The ECB’s primary mandate is to maintain price stability, which means either controlling inflation or stimulating growth. Its primary tool is the raising or lowering of interest rates. Relatively high interest rates – or the expectation of higher rates – will usually benefit the Euro and vice versa. The ECB Governing Council makes monetary policy decisions at meetings held eight times a year. Decisions are made by heads of the Eurozone national banks and six permanent members, including the President of the ECB, Christine Lagarde.
Eurozone inflation data, measured by the Harmonized Index of Consumer Prices (HICP), is an important econometric for the Euro. If inflation rises more than expected, especially if above the ECB’s 2% target, it obliges the ECB to raise interest rates to bring it back under control. Relatively high interest rates compared to its counterparts will usually benefit the Euro, as it makes the region more attractive as a place for global investors to park their money.
Data releases gauge the health of the economy and can impact on the Euro. Indicators such as GDP, Manufacturing and Services PMIs, employment, and consumer sentiment surveys can all influence the direction of the single currency. A strong economy is good for the Euro. Not only does it attract more foreign investment but it may encourage the ECB to put up interest rates, which will directly strengthen the Euro. Otherwise, if economic data is weak, the Euro is likely to fall. Economic data for the four largest economies in the euro area (Germany, France, Italy and Spain) are especially significant, as they account for 75% of the Eurozone’s economy.
Another significant data release for the Euro is the Trade Balance. This indicator measures the difference between what a country earns from its exports and what it spends on imports over a given period. If a country produces highly sought after exports then its currency will gain in value purely from the extra demand created from foreign buyers seeking to purchase these goods. Therefore, a positive net Trade Balance strengthens a currency and vice versa for a negative balance.
The Pound Sterling erased some of its earlier losses, climbing above its opening price against the US Dollar, after the UK Chancellor Rachel Reeves revealed its autumn budget. The GBP/USD trades above 1.3000, virtually unchanged.
According to the Financial Times, the Autumn budget was well received by the markets. Gilt yields are falling, and Cable aimed higher after the new labor Government announced its first budget in 14 years.
The GBP/USD bounced at the bottom of an ascending channel trendline, extending its gains after Chancellor Reeves, ended her speech. Initially, the pair cleared 1.2970, and pushed higher, clearing the 1.3000 figure hitting a high of 1.3039.
From a technical standpoint, the GPB/USD is not out of the woods, as sellers continued to cap the pair’s advance. Buyers must clear October 18 peak at 1.3070, so they could remain hopeful of testing 1.3100. Once those key resistance levels are taken out, the 50-day Simple Moving Average (SMA) would be up next at 1.3138.
Otherwise, if sellers push the exchange rate below the October 29 daily close of 1.3014, it would expose the 1.3000 psychological level as the next support. A breach of the latter will expose the 100-day SMA at 1.2974, before the GBP/USD tumbles towards October 300 low of 1.2936.
The table below shows the percentage change of British Pound (GBP) against listed major currencies today. British Pound was the strongest against the Canadian Dollar.
| USD | EUR | GBP | JPY | CAD | AUD | NZD | CHF | |
|---|---|---|---|---|---|---|---|---|
| USD | -0.34% | 0.10% | -0.11% | 0.05% | -0.30% | -0.09% | -0.14% | |
| EUR | 0.34% | 0.44% | 0.23% | 0.39% | 0.03% | 0.24% | 0.20% | |
| GBP | -0.10% | -0.44% | -0.20% | -0.05% | -0.41% | -0.20% | -0.22% | |
| JPY | 0.11% | -0.23% | 0.20% | 0.14% | -0.21% | -0.01% | -0.04% | |
| CAD | -0.05% | -0.39% | 0.05% | -0.14% | -0.36% | -0.15% | -0.17% | |
| AUD | 0.30% | -0.03% | 0.41% | 0.21% | 0.36% | 0.21% | 0.18% | |
| NZD | 0.09% | -0.24% | 0.20% | 0.01% | 0.15% | -0.21% | -0.03% | |
| CHF | 0.14% | -0.20% | 0.22% | 0.04% | 0.17% | -0.18% | 0.03% |
The heat map shows percentage changes of major currencies against each other. The base currency is picked from the left column, while the quote currency is picked from the top row. For example, if you pick the British Pound from the left column and move along the horizontal line to the US Dollar, the percentage change displayed in the box will represent GBP (base)/USD (quote).
Gold traded as high as $2,789.72 a troy ounce on Wednesday, a fresh record high. XAU/USD retreated after Wall Street’s opening but met buyers at around $2,770 and approaches the aforementioned high en route to unexplored territory.
The US Dollar (USD) reacted positively to the first batch of United States (US) data, surging after an upbeat ADP report on private job creation showed the sector added 233K new positions in October, much better than the 115K expected. The Greenback retained its strength following the release of the Q3 Gross Domestic Product (GDP) preliminary estimate, showing that the economy grew at an annualized pace of 2.8%, below the 3% expected and the previous, yet still far from concerning.
Finally, the US reported an uptick in inflation in the three months to June, as the core Personal Consumption Expenditures (PCE) Price Index rose by 2.2%, easing from the previous 2.8% but above the 2.1% expected.
Employment, growth, and inflation all fell within a tolerable range, resulting in little relevance to the upcoming Federal Reserve’s (Fed) monetary policy decision next week. In the end, market players welcomed the figures. As a result, the USD came under selling pressure while Wall Street trimmed pre-opening losses, and the three major indexes turned positive.
Meanwhile, uncertainty surrounding the outcome of the US presidential election keeps boosting demand for Gold and buyers take their chances on intraday deeps. Demand for Gold will likely continue outpacing that of the USD in risk-averse scenarios, while also gaining when the latter weakens.
The US will release the September PCE Price Index on Thursday, although it may have a limited impact given the quarterly figures just released within the GDP report. On Friday, the country will publish the October Nonfarm Payrolls (NFP) report.
Technically, the daily chart for the XAU/USD pair is bullish despite being overbought. The pair keeps trading above all its moving averages, with the 20 Simple Moving Average (SMA) currently at around $2,691.70. The 100 and 200 SMAs accelerated higher far below the shorter one, reflecting persistent buying interest. Finally, technical indicators entered overbought readings, partially losing their upward strength but far from showing upward exhaustion. Higher highs are still on the docket before a relevant downward correction occurs.
The 4-hour chart indicates a persistently strong upward momentum. Technical indicators resumed their advances in the overbought territory after a modest corrective decline, confirming buyers continue to take their chances on dips. At the same time, the 20 SMA accelerated north far below the current level while above the 100 and 200 SMAs. A bullish continuation beyond $2,800 is on the docket before the US election.
Support levels: 2,770.90 2,757.30 2,742.50
Resistance levels: 2,790.00 2,810.00 2,825.00
On the European side, Germany’s economy, which is the heart of Europe, is showing troubling signs of slowdown. Once renowned for its resilience, Germany’s economy is now the slowest growing among the G7 and Eurozone countries. The recent IMF forecasts project a contraction of 0.2% in 2024 and only a 0.8% growth rate in 2025 — a far cry from the robust expansion once associated with Europe’s industrial leader.

The budget gap exceeding 40 billion euros, combined with an expected tax revenue shortfall of 60 billion euros over the next five years, paints a picture of an economy in stagnation. With both small and large German companies tightening their belts, some are questioning if Germany is on the brink of a “lost decade.”
For decades, Germany’s success relied on its ability to export high-quality goods worldwide, especially to markets like China. Exports account for nearly half of Germany’s GDP, significantly higher than other major economies, making it vulnerable when demand falls. Today, German exports to China are struggling, particularly in the automotive and machinery sectors. Companies like Diegoma, a producer of industrial machinery, face order delays due to economic uncertainty and fluctuating demand. This export slowdown has highlighted the risks of an economy heavily dependent on external markets. With China increasingly shifting to local suppliers and global trade slowing, Germany’s heavy reliance on exports could pose long-term growth challenges. The German government has already lowered its tax revenue projections, signalling the widespread impact of these economic pressures.
Germany’s economic challenges are compounded by political gridlock, as Chancellor Olaf Scholz’s coalition government struggles to agree on key policies. This coalition, an unusual alliance of Social Democrats, Greens, and Liberals, often clashes on issues such as climate regulations, industrial policy, and economic reform, leaving business leaders frustrated by delays and indecision. This discord has had a tangible impact on the economy.
A recent survey found that nearly 37% of German companies are now considering cutting production or moving operations abroad, up from 31% a year earlier. The Greens’ strong stance on climate policy has created tensions within the coalition, drawing criticism from businesses and local leaders alike. This political impasse, along with aging infrastructure, is increasingly seen as an obstacle to the structural reforms Germany needs to stay competitive.
As one of the country’s biggest contributors to GDP, Germany’s auto sector is struggling with rising costs, falling demand for electric vehicles, and fierce competition from Chinese manufacturers offering more affordable electric cars. Volkswagen recently announced the closure of its first German plant, a historic move that reflects the broader slowdown in the auto industry. Companies such as BMW and Mercedes-Benz have cut their profit forecasts, citing weak demand, particularly in China — a market that once accounted for a large share of their sales.
The ripple effects are being felt across the industry, affecting many of the suppliers and small businesses that support Germany’s automakers. Overall, the shift has left some automakers scrambling to adapt. Volkswagen, for example, has committed to cost-cutting measures, including layoffs and potential production cuts, to stay competitive. But with job losses mounting and supply chains weakening, the industrial slowdown is starting to show in Germany’s employment statistics.
The outlook for Germany has become a focal point for mixed views, with recent reports offering both optimism and caution. A recent Bloomberg report suggests that Germany’s economic slowdown “may be over,” with business confidence improving slightly. The Ifo Expectations Index, which rose in October, points to a possible stabilization with sectors such as tourism and information technology showing growth.
For the services sector, which has seen gains amid manufacturing struggles, the latest data offers a glimmer of hope. However, most economists remain unconvinced, arguing that such optimism may be premature. Germany’s industrial base remains in a precarious position. Despite some positive readings, broader economic data is revealing issues
Palladium has been the best-performing asset class among all precious metals last week. The price rise was driven by the US call for G7 countries to impose sanctions on Russian palladium supplies. Russia supplies about 40% of the world’s palladium. Earlier this month, the price of palladium broke above its 50-day moving average and then its 200-day moving average within days of each other. In October, approaching these levels provided support for buyers, and given palladium’s lower liquidity compared to gold and even silver, strong price movements cannot be ruled out. From current levels near $1,170, the next and easy target for the upside is $1,200, which was the peak at the end of last year. The 200-day moving average is at $1,700 per ounce and breaking that could push prices to higher levels. This could also mean a repeat of the explosive rise from late 2018 to March 2020.
At the time of writing, palladium futures on the New York Mercantile Exchange were around $1,200 per ounce, up 9% since the beginning of last week. Deep-rooted deficits continue to hamper growth. With a projected five-year tax revenue shortfall of €60 billion and a budget gap of over €40 billion, Germany’s fiscal outlook points to economic stagnation rather than recovery.
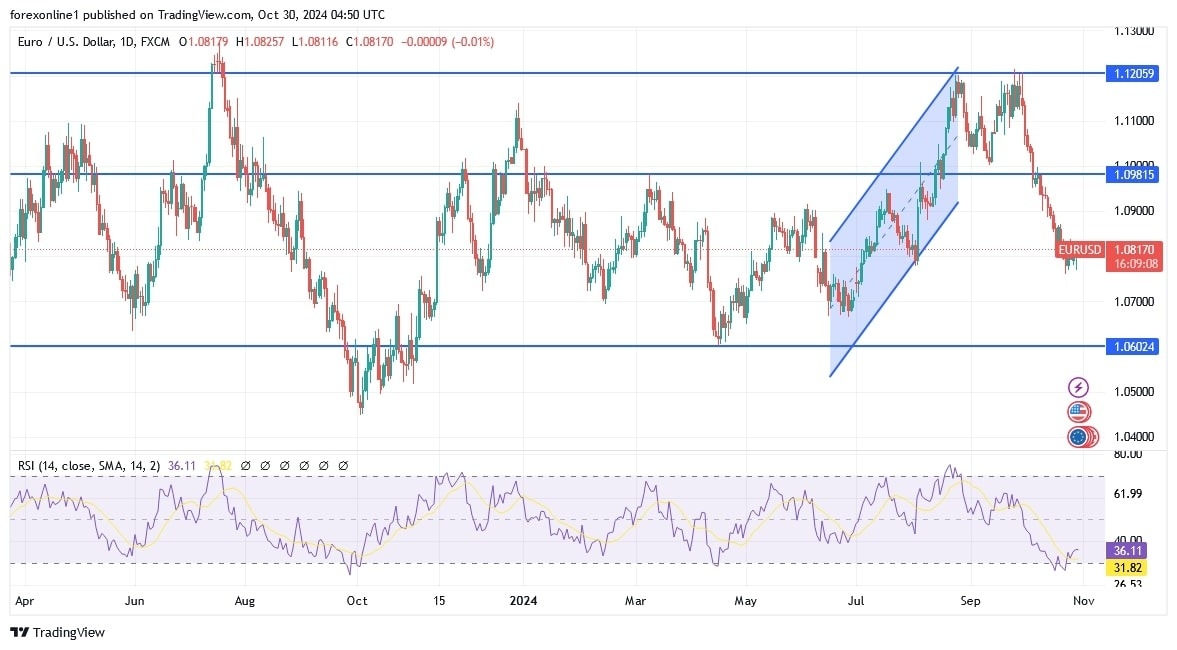
The general trend for the EUR/USD currency pair price remains bearish and stability around and below the 1.0800 support level will continue to encourage bears to control the trend and the continuation of the US dollar’s gains from stronger US jobs numbers this week, along with the demand for buying it as a safe haven, which encourages bears to move the currency pair towards stronger bearish levels.
the closest of which are currently 1.0755 and 1.0600, which are sufficient to push all technical indicators towards strong oversold levels. On the other hand, according to the performance on the daily chart, breaching the downtrend requires moving above the psychological resistance of 1.1000 at least.
Ready to trade our daily EUR/USD Forex analysis? We’ve made a list of the best forex trading platforms for beginners worth trading with.
A decisive advance above the top line that is followed by a continuation higher indicates an initial breakout of the triangle consolidation pattern. However, subsequent price behavior is key to guard against a false breakout. Since the most recent swing high was at 3.02, it should also be considered since it is relatively nearby.
A rally above that high would further confirm strength as a prior swing will have been reclaimed. However, a daily close above it is needed to complete that breakout. That swing is part of the price structure of lower swing highs that occurred since the 3.64 peak in 2003. The top boundary line defining resistance of the symmetrical triangle formation touches those highs.
Since resistance has been seen so far, a bearish retracement may be next on the agenda. Weakness is indicated on drop below today’s low of 2.77. Also, a decline below yesterday’s low of 2.79 can be seen as a gauge. The 38.2% Fibonacci retracement is at 2.65 and it may be the first price zone to see signs of support. Lower down is possibly a more significant support zone from 2.58 to 2.56 as it marks the confluence of several levels. A prior high resistance and now possibly support was at 2.58 and it is joined by the 50% retracement at 2.57 and the 20-Day MA at 2.56.
Price behavior around the 20-Day line will likely provide the most value as it helps identify support of the near-term trend. It has been trending down since a little before the last swing low. However, the 50-Day MA has been trending up since mid-September and is now at 2.44. If natural gas breaks below the 20-Day MA and continues lower the 50-Day line becomes a potential target. Moreover, the 61.8% Fibonacci retracement can be watched as well at 2.48.
For a look at all of today’s economic events, check out our economic calendar.
Furthermore, as for the US dollar (USD) it was subdued ahead of the high-impact data. The US dollar (USD) remained steady against most of its major counterparts as the data-free US calendar saw the “dollar” struggle to find a clear path. However, USD investors are also likely to be reluctant to place any overly aggressive bets on the greenback ahead of several key data releases due this week.
With a slew of economic data expected later in the week, the USD has remained mostly subdued. Looking ahead, the primary catalyst for GBP/USD movement is likely to be the release of the latest US JOLT job openings. Although the data is expected to show a slight decline in job creation last month, the index is expected to remain close to the strong levels seen in August, which could support the USD further. The latest CB Consumer Confidence Index could also provide some additional support to the USD if the index comes in as expected and confirms another uptick in US sentiment.
Turning to the GBP, there will be no UK data on Tuesday, which could leave the pound lower ahead of Wednesday’s Autumn Budget.
According to stock trading platforms, UK stocks rise on strong earnings. The FTSE 100 index of UK shares rose above the flat line at 8,295, extending gains from the previous session as markets assessed the results of London-traded giants. HSBC rose 2.5% to lead the day’s leaders after beating third-quarter earnings estimates amid a group restructuring, as well as announcing a $3 billion share buyback. Also, the results from the UK’s largest bank highlighted the benefit of increased monetary stimulus in China, sending Standard Chartered and Prudential up more than 1% due to their large exposure to Asia. In addition, Pearson shares jumped about 2% on stronger sales in the period. BP shares fell after reporting mixed results for the quarter, in line with other major energy companies around the world as falling energy demand has squeezed refining margins.
According to Forex trading, the dollar hovers near three-month highs. The US Dollar Index (DXY) was little changed around 104.3 on Tuesday, hovering near a three-month high, as traders continue to bet that the Federal Reserve will cut US interest rates but not as aggressively as initially expected, while key economic data is digested. The shock report showed that the number of job openings was the smallest since January 2021 and layoffs rose, while consumer confidence in the Fed rose by the most since March 2021. Advance GDP growth estimates, personal consumption expenditures and employment reports are also due this week.
Overall, the odds of a 25 basis point Fed funds rate cut next week are currently around 95%. Meanwhile, bets on a Donald Trump victory were also weighing on the dollar as his policies on tariffs, taxes and immigration are seen as inflationary. Overall, the US dollar was mostly higher against the Australian dollar and the euro.
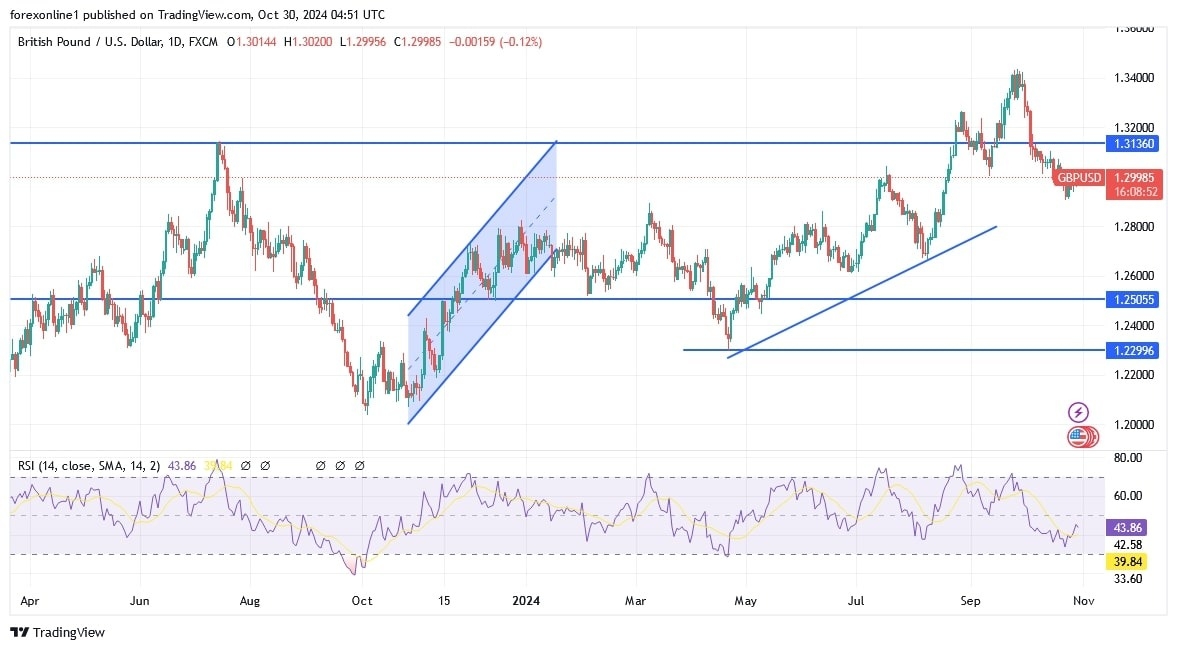
According to the performance on the daily chart, the stability of the GBP/USD pair price around and below the psychological level of 1.30 is still a catalyst for bears to control. Technically, the downtrend will strengthen by moving towards the support levels of 1.2920, 1.2880 and 1.2790.
At these levels, all technical indicators will move towards strong oversold levels. On the other hand, and in the same time frame, moving above the resistance of 1.3150 will represent a breach of the current downtrend. Strongly, the pound will be affected today by the announcement of the details of the British budget and the US dollar awaits the announcement of the US jobs numbers and the US inflation reading.
Ready to trade our daily GBP/USD Forex forecast? Here’s a list of some of the top forex brokers UK to check out.
The USD/JPY pair will interact with several important economic data releases from the United States, which will provide more information about the upcoming actions by the Federal Reserve. The first data will be released on Tuesday when the Conference Bureau publishes its latest consumer confidence report. Analysts expect the data to show confidence rising to 99 in October as inflation declines and the Labor market improves. US consumer confidence is one of the most important economic figures because of its implications for the economy. Highly confident consumers spend more money, which boosts the economy, which is notable because consumer spending is the largest part of the US GDP.
Other important data will be released on Wednesday when ADP releases its October payrolls data. Analysts expect the figure to come in at 101,000, a significant drop from the 143,000 jobs it posted last year. After that, the US will release its first estimate of third-quarter gross domestic product. Economists expect the figure to show the economy expanded by 3% last quarter, meaning it is doing relatively well.
The most important data will be the US nonfarm payrolls data for October, due on Friday. Economists polled by Reuters expect the data to show the US economy added 111,000 jobs this month, a significant drop from the 254,000 jobs it added in September. The country’s unemployment rate is expected to come in at 4.1%, while average hourly earnings are expected to rise by 4.0%. The figures will be important because of their impact on the Federal Reserve, which is considering what to do at its Nov. 7 meeting. Analysts expect the bank to leave interest rates unchanged or cut them by 25 basis points.
The USD/JPY pair also rose as crude oil prices dropped by over 4.5% on Monday. Brent, the global benchmark, fell by 4.35%, while West Texas Intermediate (WTI) declined by 4.36%. The decline followed Israel’s response, which focused on Iran’s missile manufacturing facilities and avoided major attacks on its oil infrastructure and nuclear sites. Iran, in turn, signalled that it would not respond aggressively due to its already struggling economy. Analysts believe that with these tensions easing, oil supplies are unlikely to face significant disruptions.
Another major event for USD/JPY is the upcoming U.S. election next week. Recent polling data shows Donald Trump holding an advantage over Kamala Harris. For instance, his lead on Polymarket has expanded in recent months. A Trump victory is expected to be favourable for the U.S. dollar due to his focus on tariffs. Higher tariffs could lead to heightened geopolitical tensions and rising inflation in the U.S.
According to the economic calendar, the other big news for USD/JPY currency pair will be the Bank of Japan’s interest rate decision on Thursday. Furthermore, analysts expect the bank to leave rates unchanged at 0.25%. The bank’s governor, Kazuo Ueda, also hinted at this during a meeting in Washington last week. The BoJ will then deliver its economic outlook report and a press conference where it will offer hints on what to expect later this year. The latest data showed that core inflation in Tokyo moved below the BoJ’s 2.0% target. As such, there are signs that the unwinding of the yen trade will not continue.
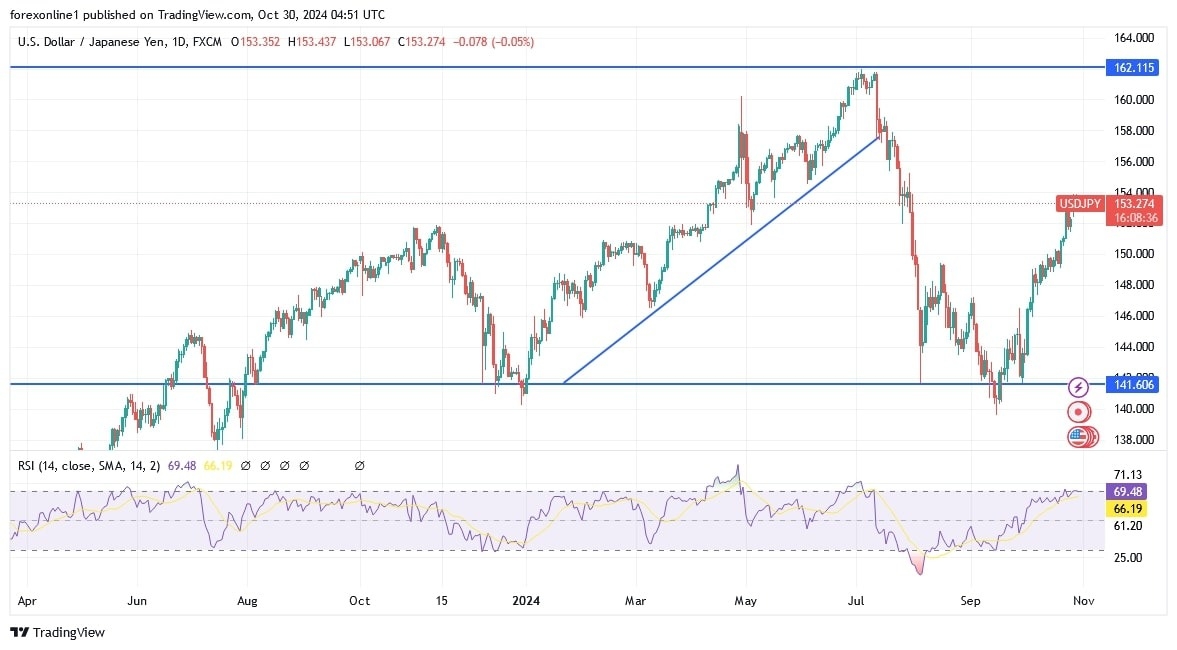
The daily chart shows that the USD/JPY exchange rate has been doing well in the past few months. It has risen from a low of 140 in September to around 154, its highest level since July 30. The pair has moved above the 50-day and 100-day exponential moving averages (EMA), which are about to witness a bullish crossover.
Oscillators such as the Relative Strength Index (RSI) and the Moving Average Convergence Divergence (MACD) are all pointing up. Therefore, the path of least resistance will be at 154.52, the low recorded on June 4. A move above this level will indicate further gains.
Ready to trade our daily forex forecast? Here are Japan’s Best Forex Brokers to choose from.
The EUR/USD forecast shows a return of bullish momentum after a long decline. The greenback eased after employment figures in the previous session revealed unexpected weakness. At the same time, the uncertainty surrounding the US election has sent traders to the safe-haven gold.
–Are you interested in learning more about British Trade Platform Review? Check our detailed guide-
The US released mixed economic reports on Tuesday on consumer sentiment and employment. However, market participants focused on the employment figures since the Fed closely monitors the labor sector.
The JOLTs job openings report revealed that vacancies fell to 7.44 million, missing estimates of 7.98 million. The decline showed that there were fewer open positions for the unemployed, indicating weaker demand for labor. The soft figures solidified bets for a November Fed rate cut.
Meanwhile, consumer confidence jumped to 108.7, well above forecasts of 99.5. However, this was not enough to significantly shift the outlook for rate cuts.
Traders are on edge ahead of GDP and monthly employment figures that will show the state of the US economy. The nonfarm payrolls report will likely reveal an addition of 111,000 jobs in October, well below September’s job growth. A miss would raise fears of a weak labor sector, boosting Fed rate cut expectations. On the other hand, continued resilience might lower the chances of two rate cuts before the year ends.
At the same time, the upcoming US presidential election is causing uncertainty, sending traders to the sidelines. The race between Trump and Kamala is tight, meaning there is no certainty over the possible outcome. Consequently, market volatility will likely increase before, during, and after the voting.
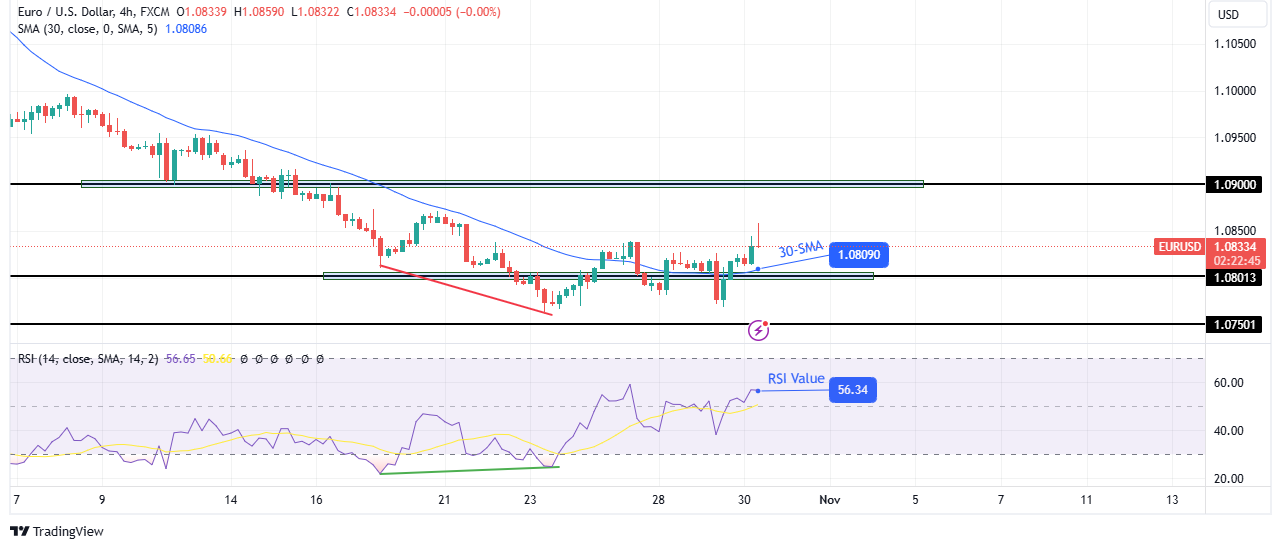
On the technical side, the EUR/USD price has made a new high above the 30-SMA, supporting a bullish bias. At the same time, the price trades above the SMA, and the RSI is in bullish territory above 50.
–Are you interested to learn more about forex signals? Check our detailed guide-
The downtrend recently paused after the RSI made a bullish divergence. The weakness in the downtrend allowed bulls to take charge by breaking above the SMA. However, to solidify the new bias, the price must stay above the SMA and reach higher resistance levels like 1.0900.
Looking to trade forex now? Invest at eToro!
68% of retail investor accounts lose money when trading CFDs with this provider. You should consider whether you can afford to take the high risk of losing your money
Silver (XAG/USD) meets with a fresh supply on Wednesday and drops back closer to the $34.00 mark during the first half of the European session, reversing a part of the previous day’s move up.
From a technical perspective, the XAG/USD is holding comfortably above important daily moving averages – 50-day, 100-day and 200-day SMAs. Moreover, oscillators on the daily chart maintain their positive bias and are still away from being in the overbought territory, suggesting that the path of least resistance for the white metal remains to the upside.
Hence, any subsequent slide is more likely to find decent support near the $33.70 horizontal zone. This is followed by last week’s swing low, around the $33.10 area, which if broken decisively might shift the bias in favor of bearish traders. The XAG/USD might then accelerate the slide towards the $32.20-$32.15 intermediate support en route to the $32.00 round figure.
Some follow-through selling below the $31.70-$31.65 region could drag the XAG/USD towards the $31.00 mark. The downward trajectory could extend further towards the $30.50 area and the monthly swing low, close to the $30.00 psychological mark tested on October 8.
On the flip side, bulls might now wait for a sustained strength beyond the $34.50-$34.55 area before making a fresh attempt to conquer the $35.00 psychological mark. The subsequent move up has the potential to lift the XAG/USD further towards the October 2012 swing high, around the $35.35-$35.40 region.
Silver is a precious metal highly traded among investors. It has been historically used as a store of value and a medium of exchange. Although less popular than Gold, traders may turn to Silver to diversify their investment portfolio, for its intrinsic value or as a potential hedge during high-inflation periods. Investors can buy physical Silver, in coins or in bars, or trade it through vehicles such as Exchange Traded Funds, which track its price on international markets.
Silver prices can move due to a wide range of factors. Geopolitical instability or fears of a deep recession can make Silver price escalate due to its safe-haven status, although to a lesser extent than Gold’s. As a yieldless asset, Silver tends to rise with lower interest rates. Its moves also depend on how the US Dollar (USD) behaves as the asset is priced in dollars (XAG/USD). A strong Dollar tends to keep the price of Silver at bay, whereas a weaker Dollar is likely to propel prices up. Other factors such as investment demand, mining supply – Silver is much more abundant than Gold – and recycling rates can also affect prices.
Silver is widely used in industry, particularly in sectors such as electronics or solar energy, as it has one of the highest electric conductivity of all metals – more than Copper and Gold. A surge in demand can increase prices, while a decline tends to lower them. Dynamics in the US, Chinese and Indian economies can also contribute to price swings: for the US and particularly China, their big industrial sectors use Silver in various processes; in India, consumers’ demand for the precious metal for jewellery also plays a key role in setting prices.
Silver prices tend to follow Gold’s moves. When Gold prices rise, Silver typically follows suit, as their status as safe-haven assets is similar. The Gold/Silver ratio, which shows the number of ounces of Silver needed to equal the value of one ounce of Gold, may help to determine the relative valuation between both metals. Some investors may consider a high ratio as an indicator that Silver is undervalued, or Gold is overvalued. On the contrary, a low ratio might suggest that Gold is undervalued relative to Silver.