The main category of Forex News.
You can use the search box below to find what you need.
[wd_asp id=1]
The main category of Forex News.
You can use the search box below to find what you need.
[wd_asp id=1]
Keep in mind that the Bank of Japan has an interest rate decision on Thursday, and this of course will have a major influence on what happens next, but the Bank of Japan has already admitted that it can’t do much as far as tightening monetary policy. So, I think you will continue to see the carry trade come back to life.

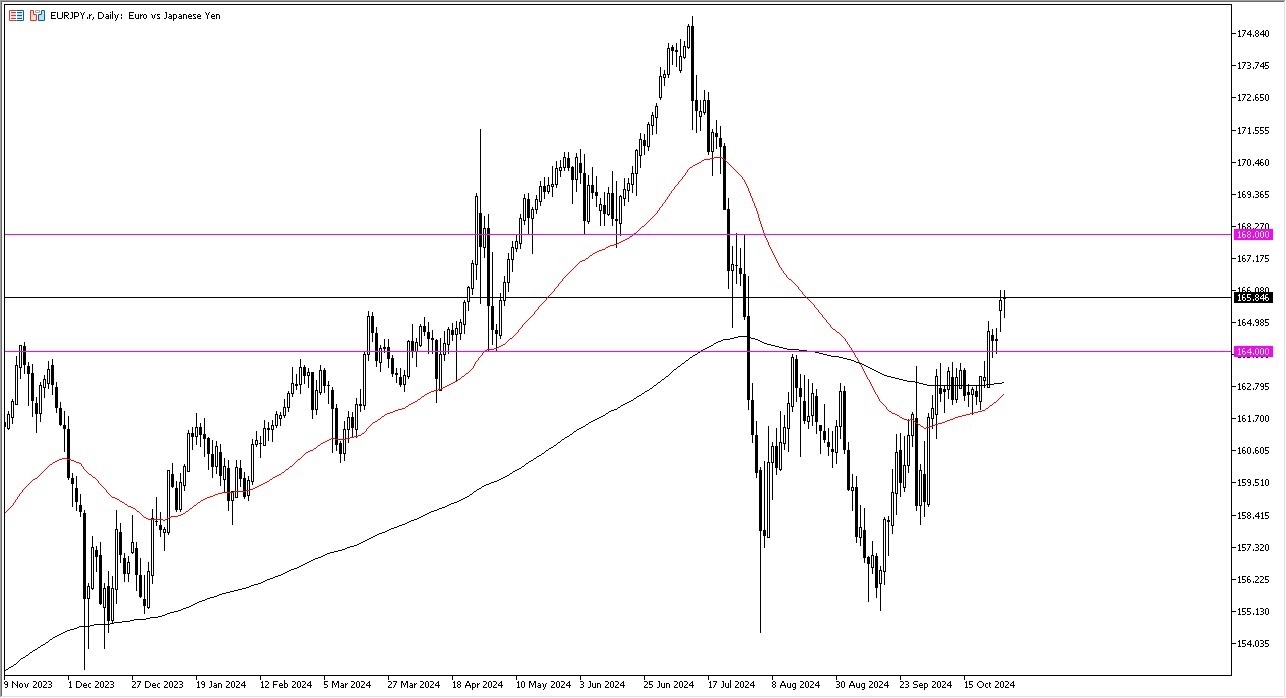
While the euro is not necessarily my favorite currency, it’s not as bad as the Japanese yen. And it’s worth noting that you are speaking of relative strength, not strength. Those are two different things. The market could rally to the 168 yen level above where I see a massive amount of market memory just waiting to cause issues. Right now that’s my target. With all of the noise between here and there on the charts and of course the Bank of Japan interest rate decision, I do think it’s going to be a very messy move to that level, but I do think it happens given enough time.
For what it is worth, the 50-day EMA is starting to curl higher, and it looks like it wants to cross above the 200-day EMA, kicking off the so-called Golden Cross. While I’m not a huge advocate of this signal, it is something worth noting for longer-term traders. I’m not a big fan of it, but that being said I know that a lot of the longer-term “buy-and-hold traders” will pay attention to it.
Ready to trade our daily forex forecast? Here are the best forex brokers in Japan to choose from.
At the beginning of this week’s trading, according to gold trading companies, gold prices came under pressure as the Israeli attack on Iran over the weekend had a limited impact as it did not target any oil or nuclear sites. However, safe-haven demand for the yellow metal remains intact ahead of next week’s US elections. Uncertainty over the outcome, which will determine US policy for the next four years, has kept traders on their toes.
The uncertainty surrounding next week’s elections could shape gold prices. Most opinion polls show former US President Donald Trump ahead of Vice President Kamala Harris. However, analysts believe the race will be close. Overall, the continued safe-haven demand stemming from tensions in the Middle East and US election tensions continues to act as a tailwind for the precious metal. Should Trump win, concerns over a trade war with China would increase safe-haven demand for gold. Moreover, Trump could also ease sanctions on Russia, while doubling them in Iran.
Traders are also focusing on the release of third-quarter GDP data from the US on Thursday. Additionally, the Personal Consumption Expenditures (PCE) index, the preferred measure of the US Federal Reserve, will be released on Friday, along with non-farm payrolls data. All of these data are due ahead of the US Federal Reserve’s policy meeting next week. If the data shows further economic slowdown, it could herald further interest rate cuts in the US.
Meanwhile, lower interest rates increase demand for non-yielding metals such as gold and silver.
According to the CME FedWatch tool, traders are pricing in a 95% chance of the US Federal Reserve cutting interest rates by 25 basis points at its November meeting. At its September meeting, the Fed cut rates by 50 basis points, surprising the market.
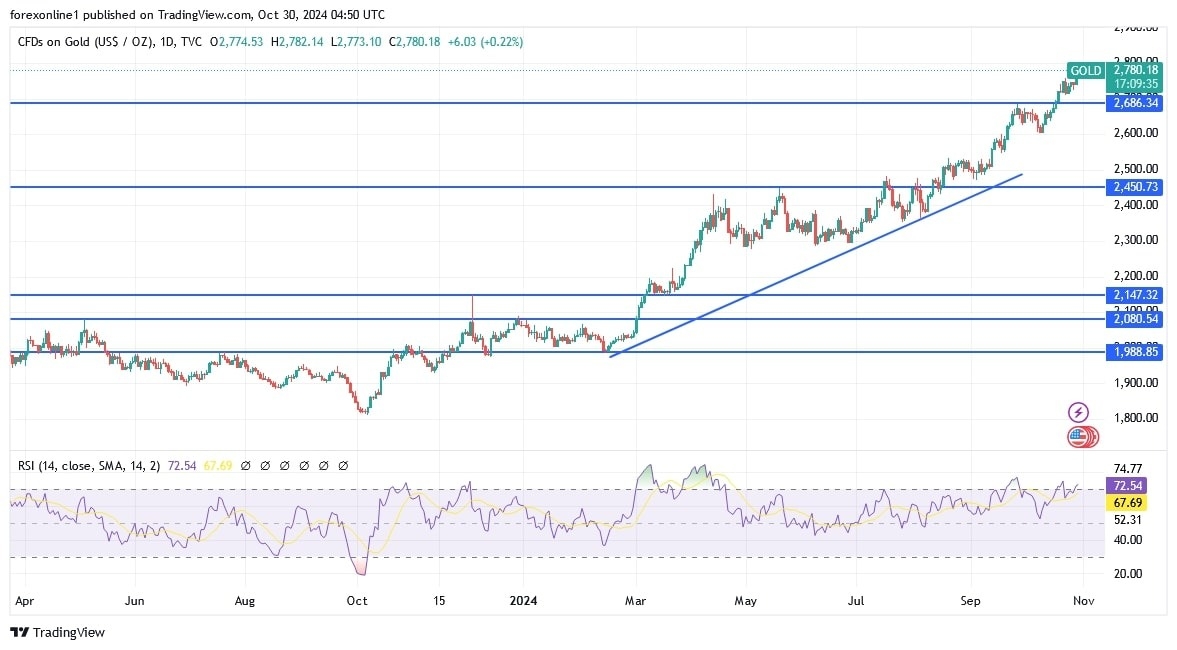
According to gold price forecast experts, gold prices are facing resistance at $2,770-2,775 per ounce. If prices break above $2,775 per ounce, the yellow metal could rally to $2,800 per ounce after that. Overall, COMEX gold prices have gained more than 30% since the beginning of this year. However, the Relative Strength Index (RSI) on the daily chart is about to break into the overbought zone and warrants some caution from bulls. Therefore, it would be wise to wait for some near-term neutrality or a modest pullback before placing any further discretionary move in the near term.
Ready to trade today’s Gold forecast? Here are the best Gold brokers to choose from.
Following Monday’s choppy action, GBP/USD gained traction and closed in positive territory on Tuesday. The pair stays in a consolidation phase above 1.3000 in the European session on Wednesday as market focus shifts to key macroeconomic data releases from the US and the UK budget announcement.
The table below shows the percentage change of British Pound (GBP) against listed major currencies today. British Pound was the strongest against the US Dollar.
| USD | EUR | GBP | JPY | CAD | AUD | NZD | CHF | |
|---|---|---|---|---|---|---|---|---|
| USD | -0.26% | -0.02% | -0.21% | -0.04% | -0.30% | -0.40% | -0.09% | |
| EUR | 0.26% | 0.25% | 0.08% | 0.23% | -0.04% | -0.13% | 0.18% | |
| GBP | 0.02% | -0.25% | -0.16% | -0.02% | -0.29% | -0.38% | -0.05% | |
| JPY | 0.21% | -0.08% | 0.16% | 0.16% | -0.10% | -0.20% | 0.12% | |
| CAD | 0.04% | -0.23% | 0.02% | -0.16% | -0.27% | -0.36% | -0.03% | |
| AUD | 0.30% | 0.04% | 0.29% | 0.10% | 0.27% | -0.09% | 0.22% | |
| NZD | 0.40% | 0.13% | 0.38% | 0.20% | 0.36% | 0.09% | 0.32% | |
| CHF | 0.09% | -0.18% | 0.05% | -0.12% | 0.03% | -0.22% | -0.32% |
The heat map shows percentage changes of major currencies against each other. The base currency is picked from the left column, while the quote currency is picked from the top row. For example, if you pick the British Pound from the left column and move along the horizontal line to the US Dollar, the percentage change displayed in the box will represent GBP (base)/USD (quote).
UK Chancellor Rachel Reeves will unveil the Autumn Budget later in the day, which is expected to include tax rises and spending cuts.
Previewing the potential market reaction to the UK budget announcement, “Chancellor Reeves is expected to loosen fiscal policy somewhat and if she manages to pull that off and maintain credibility with investors, the GBP might benefit,” Scotiabank’s Chief FX Strategist Shaun Osborne said in a recently published report.
Meanwhile, the US economic calendar will offer the ADP Employment Change for October and the US Bureau of Economic Analysis’ first estimate of the third-quarter Gross Domestic Product (GDP) growth.
Investors see the employment in private sector rising by 115,000 following the 143,000 increase recorded in September. Additionally, the US’ GDP is forecast to expand at an annual rate of 3% in the third-quarter.
The USD could stay resilient against its rivals if these data arrive near or above market expectations and make it difficult for GBP/USD to push higher. On the other hand, mixed or disappointing data releases from the US could help the pair hold its ground. Nevertheless, it could be risky to bet on a direction in between the US data releases and the UK budget announcement.
GBP/USD rose above the descending trend line and the pair closed above the 100-day Simple Moving Average (SMA) on Tuesday. Additionally, the Relative Strength Index (RSI) indicator on the 4-hour chart rose slightly above 60, highlighting a buildup of bullish momentum.
On the upside, 1.3030 (20-day SMA) aligns as immediate resistance before 1.3100 (round level) and 1.3140 (50-day SMA). In case the pair falls below 1.3000 (round level, static level) and starts using this level as resistance, 1.2970 (100-day SMA) could be seen as next support ahead of 1.2900 (static level).
The Pound Sterling (GBP) is the oldest currency in the world (886 AD) and the official currency of the United Kingdom. It is the fourth most traded unit for foreign exchange (FX) in the world, accounting for 12% of all transactions, averaging $630 billion a day, according to 2022 data. Its key trading pairs are GBP/USD, also known as ‘Cable’, which accounts for 11% of FX, GBP/JPY, or the ‘Dragon’ as it is known by traders (3%), and EUR/GBP (2%). The Pound Sterling is issued by the Bank of England (BoE).
The single most important factor influencing the value of the Pound Sterling is monetary policy decided by the Bank of England. The BoE bases its decisions on whether it has achieved its primary goal of “price stability” – a steady inflation rate of around 2%. Its primary tool for achieving this is the adjustment of interest rates. When inflation is too high, the BoE will try to rein it in by raising interest rates, making it more expensive for people and businesses to access credit. This is generally positive for GBP, as higher interest rates make the UK a more attractive place for global investors to park their money. When inflation falls too low it is a sign economic growth is slowing. In this scenario, the BoE will consider lowering interest rates to cheapen credit so businesses will borrow more to invest in growth-generating projects.
Data releases gauge the health of the economy and can impact the value of the Pound Sterling. Indicators such as GDP, Manufacturing and Services PMIs, and employment can all influence the direction of the GBP. A strong economy is good for Sterling. Not only does it attract more foreign investment but it may encourage the BoE to put up interest rates, which will directly strengthen GBP. Otherwise, if economic data is weak, the Pound Sterling is likely to fall.
Another significant data release for the Pound Sterling is the Trade Balance. This indicator measures the difference between what a country earns from its exports and what it spends on imports over a given period. If a country produces highly sought-after exports, its currency will benefit purely from the extra demand created from foreign buyers seeking to purchase these goods. Therefore, a positive net Trade Balance strengthens a currency and vice versa for a negative balance.
Silver prices (XAG/USD) dips slightly to around $34.30 during the Asian trading hours on Wednesday. However, Silver gained over 2% on Tuesday amid ongoing uncertainty surrounding the US presidential election.
A three-day poll conducted by Reuters/Ipsos, which concluded on Sunday and was released on Tuesday, indicated that the race is essentially tied as the November 5 election approaches. Vice President Kamala Harris, the Democratic candidate, has seen her lead over Republican nominee Donald Trump narrow to just one percentage point, with 44% support compared to Trump’s 43%.
Silver prices might have encountered difficulties due to safe-haven flows, following an Axios reporter post on X that Israeli Prime Minister Benjamin Netanyahu is set to meet with various ministers and military and intelligence leaders to discuss a diplomatic resolution to the war in Lebanon, according to Reuters.
The dollar-denominated commodity, like Silver, typically benefits from a weaker US dollar and lower Treasury yields as traders exercise caution ahead of significant US economic data releases this week. A declining US dollar makes Silver more affordable for foreign buyers, which can boost demand for the precious metal.
The preliminary US Q3 Gross Domestic Product (GDP) figures and October’s ADP Employment Change are set to be released on Wednesday. Additionally, US PCE inflation and Nonfarm Payrolls will be closely monitored on Thursday and Friday, respectively.
Investors are also anticipating the upcoming meeting of China’s parliament, scheduled for November 4-8, as reported by state media on Friday. There is considerable interest in the gathering of the standing committee of the National People’s Congress, which is expected to provide updates on potential fiscal stimulus measures.
Silver is a precious metal highly traded among investors. It has been historically used as a store of value and a medium of exchange. Although less popular than Gold, traders may turn to Silver to diversify their investment portfolio, for its intrinsic value or as a potential hedge during high-inflation periods. Investors can buy physical Silver, in coins or in bars, or trade it through vehicles such as Exchange Traded Funds, which track its price on international markets.
Silver prices can move due to a wide range of factors. Geopolitical instability or fears of a deep recession can make Silver price escalate due to its safe-haven status, although to a lesser extent than Gold’s. As a yieldless asset, Silver tends to rise with lower interest rates. Its moves also depend on how the US Dollar (USD) behaves as the asset is priced in dollars (XAG/USD). A strong Dollar tends to keep the price of Silver at bay, whereas a weaker Dollar is likely to propel prices up. Other factors such as investment demand, mining supply – Silver is much more abundant than Gold – and recycling rates can also affect prices.
Silver is widely used in industry, particularly in sectors such as electronics or solar energy, as it has one of the highest electric conductivity of all metals – more than Copper and Gold. A surge in demand can increase prices, while a decline tends to lower them. Dynamics in the US, Chinese and Indian economies can also contribute to price swings: for the US and particularly China, their big industrial sectors use Silver in various processes; in India, consumers’ demand for the precious metal for jewellery also plays a key role in setting prices.
Silver prices tend to follow Gold’s moves. When Gold prices rise, Silver typically follows suit, as their status as safe-haven assets is similar. The Gold/Silver ratio, which shows the number of ounces of Silver needed to equal the value of one ounce of Gold, may help to determine the relative valuation between both metals. Some investors may consider a high ratio as an indicator that Silver is undervalued, or Gold is overvalued. On the contrary, a low ratio might suggest that Gold is undervalued relative to Silver.
EUR/USD gains traction and rises toward 1.0850 in the European trading hours on Wednesday. Although the technical outlook highlights a buildup of bullish momentum, the Euro still faces a two-way risk on high-impact macroeconomic data releases.
The table below shows the percentage change of Euro (EUR) against listed major currencies today. Euro was the strongest against the US Dollar.
| USD | EUR | GBP | JPY | CAD | AUD | NZD | CHF | |
|---|---|---|---|---|---|---|---|---|
| USD | -0.22% | -0.05% | -0.21% | -0.08% | -0.29% | -0.38% | -0.11% | |
| EUR | 0.22% | 0.17% | 0.00% | 0.14% | -0.07% | -0.16% | 0.11% | |
| GBP | 0.05% | -0.17% | -0.18% | -0.03% | -0.24% | -0.33% | -0.04% | |
| JPY | 0.21% | 0.00% | 0.18% | 0.15% | -0.06% | -0.17% | 0.12% | |
| CAD | 0.08% | -0.14% | 0.03% | -0.15% | -0.22% | -0.30% | -0.01% | |
| AUD | 0.29% | 0.07% | 0.24% | 0.06% | 0.22% | -0.10% | 0.20% | |
| NZD | 0.38% | 0.16% | 0.33% | 0.17% | 0.30% | 0.10% | 0.29% | |
| CHF | 0.11% | -0.11% | 0.04% | -0.12% | 0.01% | -0.20% | -0.29% |
The heat map shows percentage changes of major currencies against each other. The base currency is picked from the left column, while the quote currency is picked from the top row. For example, if you pick the Euro from the left column and move along the horizontal line to the US Dollar, the percentage change displayed in the box will represent EUR (base)/USD (quote).
Regional Consumer Price Index (CPI) figures and third-quarter Gross Domestic Product (GDP) data from Germany will be watched closely by market participants. Investors expect Germany’s GDP to contract at an annualized rate of 0.3% in the third quarter. A worse-than-expected GDP print, combined with soft regional inflation figures from Germany, could weigh on the Euro with the immediate reaction.
Later in the day, the ADP Employment Change for October will be featured in the US economic docket. Analysts see the employment in private sector rising by 115,000 following the 143,000 increase recorded in September.
Additionally, the US Bureau of Economic Analysis will publish its first estimate of the third-quarter GDP data, which is forecast to show an expansion at an annual rate of 3%.
In case the ADP and the GDP data both disappoint, the US Dollar (USD) is likely to come under renewed selling pressure and open the door for a leg higher in EUR/USD. On the flip side, the USD could regather its strength if these data arrive near or above market consensus. If the figures come in mixed, investors could refrain from taking large positions. In this scenario, the risk perception following the Wall Street’s opening bell could be the driving factor for the USD’s performance.
EUR/USD broke out of the descending regression channel and the Relative Strength Index (RSI) indicator on the 4-hour chart rose to 60, reflecting a bullish shift in the short-term technical bias.
On the upside, the 200-day Simple Moving Average aligns as strong resistance at 1.0870 ahead of 1.0900 (round level) and 1.0940 (100-day SMA). Looking south, first support could be spotted at 1.0810-1.0800 (20-period SMA, 50-period SMA, round level) before 1.0750 (static level) and 1.0700 (round level, static level).
The Euro is the currency for the 19 European Union countries that belong to the Eurozone. It is the second most heavily traded currency in the world behind the US Dollar. In 2022, it accounted for 31% of all foreign exchange transactions, with an average daily turnover of over $2.2 trillion a day. EUR/USD is the most heavily traded currency pair in the world, accounting for an estimated 30% off all transactions, followed by EUR/JPY (4%), EUR/GBP (3%) and EUR/AUD (2%).
The European Central Bank (ECB) in Frankfurt, Germany, is the reserve bank for the Eurozone. The ECB sets interest rates and manages monetary policy. The ECB’s primary mandate is to maintain price stability, which means either controlling inflation or stimulating growth. Its primary tool is the raising or lowering of interest rates. Relatively high interest rates – or the expectation of higher rates – will usually benefit the Euro and vice versa. The ECB Governing Council makes monetary policy decisions at meetings held eight times a year. Decisions are made by heads of the Eurozone national banks and six permanent members, including the President of the ECB, Christine Lagarde.
Eurozone inflation data, measured by the Harmonized Index of Consumer Prices (HICP), is an important econometric for the Euro. If inflation rises more than expected, especially if above the ECB’s 2% target, it obliges the ECB to raise interest rates to bring it back under control. Relatively high interest rates compared to its counterparts will usually benefit the Euro, as it makes the region more attractive as a place for global investors to park their money.
Data releases gauge the health of the economy and can impact on the Euro. Indicators such as GDP, Manufacturing and Services PMIs, employment, and consumer sentiment surveys can all influence the direction of the single currency. A strong economy is good for the Euro. Not only does it attract more foreign investment but it may encourage the ECB to put up interest rates, which will directly strengthen the Euro. Otherwise, if economic data is weak, the Euro is likely to fall. Economic data for the four largest economies in the euro area (Germany, France, Italy and Spain) are especially significant, as they account for 75% of the Eurozone’s economy.
Another significant data release for the Euro is the Trade Balance. This indicator measures the difference between what a country earns from its exports and what it spends on imports over a given period. If a country produces highly sought after exports then its currency will gain in value purely from the extra demand created from foreign buyers seeking to purchase these goods. Therefore, a positive net Trade Balance strengthens a currency and vice versa for a negative balance.
Experts predict that on October 30, 10, coffee prices in the domestic market will rebound due to weather and international market influences.
Coffee price world increased due to concerns that the storm’s circulation could cause heavy rain in Vietnam’s key coffee growing region of the Central Highlands, slowing the progress of the new crop harvest. Storm Tra Mi (storm No. 6) made landfall, causing heavy rain from Ha Tinh to Binh Dinh and the northern Central Highlands in Vietnam, causing the supply of the harvested crop to slow to the market, as the storm dissipated quickly but brought rains with the tropical depression afterwards. Meanwhile, another storm is forming from the East of the Philippines, named Kong-rey. The storm is moving southward as it gets closer to the end of the year.
| Coffee price forecast for October 30, 10: Tendency to increase strongly again due to weather concerns |
Coffee prices also rose on news after Brazil’s Somar Meteorologia reported that Brazil’s largest arabica coffee growing region, Minas Gerais, received just 25,1 mm of rain last week, or 74% of the historical average.
Assessing the coffee market in the coming time, experts said that there were too many difficulties right from the beginning of the new crop year, perhaps these difficulties will last until early 2025, when international traders sell all the goods they had hastily purchased before.
At that time, coffee prices will be more stable, but the opportunity to increase prices to reach the previous peak is considered gone. In the current coffee market conditions, we need to do business based on quality, not quantity.
Recorded in the trading session on October 29, 10, domestic coffee prices today decreased slightly by 2024-800 VND/kg, ranging from 900-108.500 VND/kg. Currently, the average purchase price in the Central Highlands provinces is 109.100 VND/kg, the highest purchase price in the province Dak Nong 109.100 VND/kg.
Specifically, the coffee purchase price in the province Gia Lai (Chu Prong) is 109.000 VND, down 800 VND/kg compared to yesterday, in Pleiku and La Grai the same price is 108.900 VND/kg; In the province Kon Tum at the price of 109.000 VND/kg, down 800 VND/kg compared to yesterday; In Dak Nong province, coffee was purchased at the highest price of 109.100 VND/kg, down 900 VND/kg compared to yesterday.
Price of green coffee beans (coffee beans, fresh coffee beans) in the province Lam Dong In districts such as Bao Loc, Di Linh, Lam Ha, coffee was purchased at 108.500 VND/kg, down 900 VND/kg compared to yesterday.
Coffee prices today (April 29) in the province Dak LakIn Cu M’gar district, coffee is purchased at about 109.000 VND/kg, down 800 VND/kg, while in Ea H’leo district and Buon Ho town, it is purchased at the same price of 108.900 VND/kg.
Updated world coffee prices at 20:00 p.m. on September 29, 10, Vietnam time on the London exchange, the price of Robusta coffee futures contract for September 2024 delivery on the London exchange was at 11 USD/ton, down 2024 USD compared to the beginning of the trading session.
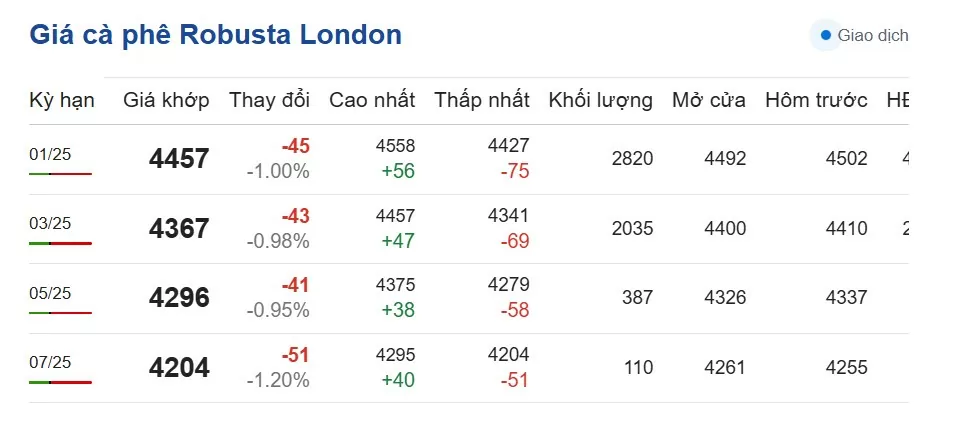 |
| Coffee prices today, July 29, 10: Robusta coffee prices on the London floor. (Photo: Screenshot from giacaphe.com |
Delivery term in November 1 is 2025 USD/ton, down 4.367 USD; Delivery term in January 43 is 3 USD/ton, down 2025 USD and delivery term in March 4.296 is 41 USD/ton, down 5 USD.
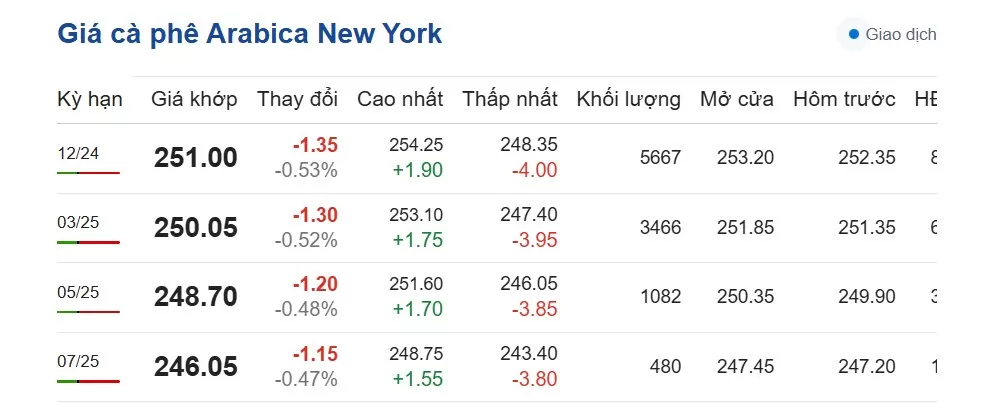 |
| Arabica coffee prices on the New York floor on October 29, 10. (Photo: Screenshot of giacaphe.com) |
In particular, the price of Arabica coffee on the New York floor today at 20:00 on October 29, 10 decreased in all terms, fluctuating at 2024 – 246.05 cents/lb.
Specifically, the delivery term in December 12 is 2024 cents/lb; down 251.00 cents/lb compared to the beginning of the session. March 1.35 delivery is 3 cents/lb, down 2025 cents/lb; Delivery period in May 250.05 is 1.30 cents/lb, down 5 cents/lb and delivery period in July 2025 is 248.70 cents/lb, down 1.20 cents/lb.
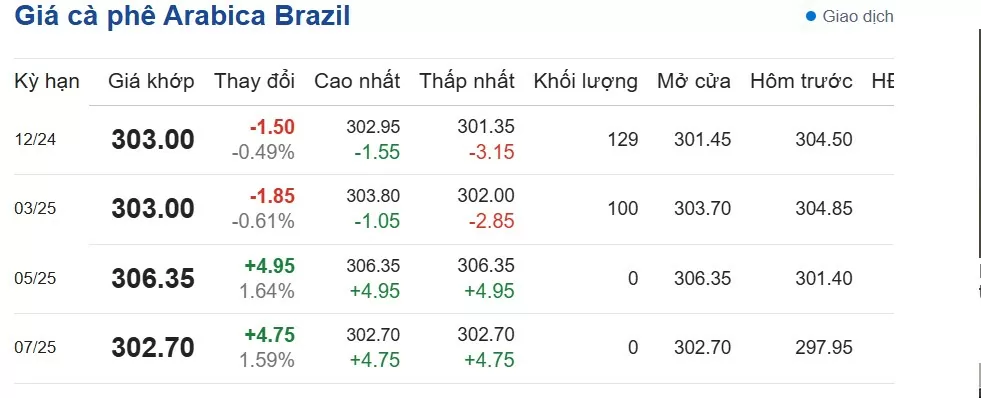 |
| Brazilian Arabica coffee price on October 29, 10. (Photo: Screenshot of giacaphe.com) |
The price of Brazilian Arabica coffee today at 21:00 p.m. on October 29, 10 increased and decreased in opposite directions. Specifically, the delivery period for December 2024 is 12 USD/ton, down 2024%; the delivery period for March 303.00 is 0.49 USD/ton, down 3%; the delivery period for May 2025 is 303.00 USD/ton, up 0.61% and the delivery period for July 5 is 2025 USD/ton, up 306.35%.
Robusta coffee traded on ICE Futures Europe (London floor) opens at 16:00 and closes at 00:30 (the next day), Vietnam time.
Arabica coffee on the ICE Futures US floor (New York floor) opens at 16:15 p.m. and closes at 01:30 a.m. (the next day), Vietnam time.
According to data from the General Department of Customs, Vietnam’s coffee exports in the first half of October 10 reached 2024 thousand tons, worth 21,5 million USD, up 125,8% in volume and 0,4% in value compared to the first half of September; and compared to the first half of October 7,5, it increased by 9% in volume and 10% in value. Accumulated from the beginning of the year to October 2023, 20,5, Vietnam exported approximately 98,0 million tons of coffee, worth 15 billion USD, down 10% in volume, but up 2024% in value compared to the same period in 1,13.
Currently, businesses in the Vietnamese coffee supply chain are facing many challenges. Rising prices stimulate farmers to pursue short-term benefits. Increasing supply shortages due to depleting domestic inventories.
Information for reference only. Prices may vary depending on locality.
Sources: https://congthuong.vn/du-bao-gia-ca-phe-ngay-30102024-co-chieu-huong-tang-manh-tro-lai-do-lo-ngai-thoi-tiet-355575.html
Both the 20-Day and 50-Day MAs were reclaimed and now represent potential support. The 20-Day line is at 2.57 and the 50-Day line at 2.43. Support could be seen around either moving average if a bearish pullback occurs. Further, a minor swing high is near the 20-Day level at 2.58. Finding support around the 20-Day MA would be a stronger indication than if natural gas falls to test support around the 50-Day MA.
Although a bearish pullback may occur prior to an upside breakout, the breakout could happen sooner. Strength is next indicated by a rally above today’s high of 2.89, which would provide the first indication of a potential upside breakout of the triangle. However, since the recent high of 3.02 is near, it needs to be exceeded for a higher confidence level that a breakout may be sustained. Today is essentially the fifth attempt to challenge resistance around the top trendline. Therefore, it has a chance of being successful if it triggers. Until then natural gas remains inside a consolidation range.
The recent higher swing low shows strength and is a clue that supports an eventual bullish resolution of the consolidation phase. Moreover, the 200-Day MA was recently successfully tested as support and each time price rallied. Natural gas has been flirting with the 200-Day line since a bull breakout in September 2023.
At some point natural gas will move into a trending environment and the recent test of support at the 200-Day line may turn out to be the beginning of that process. Note that the recent test of support at the 200-Day line followed a rally higher. Each of the previous three approaches to the 200-Day line led to a breakdown below the line. A change of character may now be beginning.
For a look at all of today’s economic events, check out our economic calendar.
October 29, 2024 – Written by John Cameron
STORY LINK Pound to Euro Rate Today: GBP/EUR Subdued following German Data
The Pound Euro (GBP/EUR) exchange rate treaded water on Tuesday following the publication of Germany’s latest GfK consumer confidence data.
At the time of writing, the GBP/EUR was trading at around €1.2008, virtually unchanged from Tuesday’s opening levels.
The Euro (EUR) faced challenges attracting buyers on Tuesday and remained largely unchanged against most of its counterparts despite encouraging data emerging from the Eurozone’s powerhouse economy.
Germany’s recent GfK consumer confidence report exceeded expectations, affirming a second straight month of improving sentiment. The index for the coming month climbed from the current -21.0 up to -18.3, outpacing the more conservative forecast of -20.5.
Nonetheless, the positive economic indicator failed to boost the single currency, which remained mostly flat following the data release.
The Pound (GBP) experienced little movement against most currencies on Tuesday amid a lack of significant economic data releases from the UK.
Market participants appeared hesitant to make substantial plays on GBP as they looked ahead to Wednesday’s crucial Autumn Budget announcement.

With the UK Chancellor set to unveil her fiscal strategy, the key concern is whether anticipated tax cuts could weigh on GBP exchange rates.
However, should the Chancellor’s initiatives to stimulate investment and ‘rebuild Britain’ be met with optimism, this could lift the Pound during mid-week trade.
Looking forward, the main driver of movement for the Pound Euro exchange rate heading into Wednesday is anticipated to be the UK’s upcoming Autumn Budget release.
This event could spark significant volatility for GBP exchange rates, especially if the UK Chancellor struggles to persuade markets of the benefits of her economic strategies.
Equally, if Rachel Reeves’ initiatives to ‘boost UK growth’ resonate positively, it could strengthen sentiment towards the Pound.
Shifting focus to the Euro, Wednesday brings a series of economic data releases from the Eurozone and Germany.
With both the Eurozone and Germany set to publish their latest GDP figures, alongside Germany’s newest labor data and the Eurozone’s economic sentiment index, the single currency is likely to see fluctuations post-release.
International Money Transfer? Ask our resident FX expert a money transfer question or try John’s new, free, no-obligation personal service! ,where he helps every step of the way,
ensuring you get the best exchange rates on your currency requirements.
TAGS: Pound Euro Forecasts
Meanwhile, the currency’s weakness prompted Finance Minister Katsunobu Kato to reiterate that authorities remain vigilant on foreign exchange movements. Moreover, financial markets fear that a further drop to the 160 level could increase the likelihood of another currency intervention. Externally, the Japanese yen continued to face pressure from a strong dollar amid expectations of a more cautious Fed rate cut and bets on a Trump victory in November.
According to stock trading platforms, Japanese stocks rise for a second session. According to trading, the Nikkei 225 index of Japanese shares rose 0.1% to around 38,660. Meanwhile, the broad TOPIX index rose 0.3% to 2,665 on Tuesday, rising for a second straight session as investors continued to assess the effects of the recent elections.
The ruling Liberal Democratic Party lost its parliamentary majority in the weekend elections, raising uncertainty about policy and further complicating the Bank of Japan’s interest rate hike plans. Meanwhile, economic data showed that Japan’s unemployment rate fell to 2.4% in September from 2.5% in August, the lowest in eight months.
Now, investors are looking ahead to the Bank of Japan’s policy decision next Thursday, when it is widely expected to keep interest rates on hold. Financial stocks led the attack, with strong gains from Mitsubishi UFJ (2.1%), Sumitomo Mitsui (1.6%) and Mizuho Financial (2%). Other heavyweights in the index also advanced, including Mitsubishi Heavy Industries (1.6%), SoftBank Group (1.9%) and IHI Corp (2%).
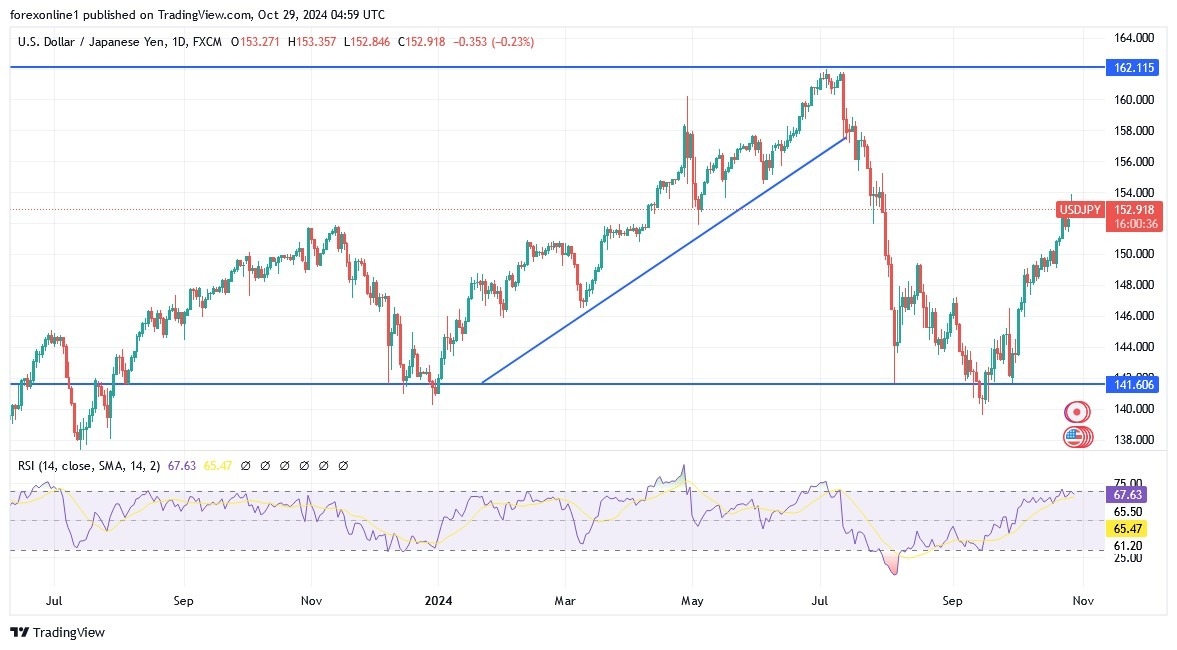
We still expect the upward trend of the USD/JPY to continue until the reaction to the release of US jobs numbers and the Federal Reserve’s preferred US inflation reading, and until the US presidential election is over. Therefore, any decline in the USD/JPY could be an opportunity to buy back in. Currently, the closest support levels for the USD/JPY pair are 151.90 and 150.00, respectively. Conversely, according to the daily chart performance, the initial upward trend will not be broken without moving below the support level of 148.00.
Ready to trade our USD/JPY Forex forecast? Here are the best forex brokers in Japan to choose from.
Spot Gold surpassed the $2,770 mark on Wednesday as market participants keep seeking safety ahead of multiple first-tier data and looming US elections. The bright metal gained upward traction ahead of Wall Street’s opening, accelerating its advance following the release of United States (US) data.
The Conference Board Consumer Confidence Index increased in October to 108.7, up from 99.2 in September. The Present Situation Index rose to 138.0, while the Expectations Index soared to 89.1, well above the threshold of 80 that usually signals a recession ahead.
The encouraging figures were partially overshadowed by an employment-related report. The number of job openings on the last business day of September stood at 7.44 million, the US Bureau of Labor Statistics (BLS) reported in the Job Openings and Labor Turnover Survey (JOLTS). The cooling labor market is more good news than bad news, as the Federal Reserve (Fed) welcomes easing wage pressures.
Caution reigns as investors focus on the preliminary estimate of the Q3 Gross Domestic Product (GDP) and the Nonfarm Payrolls (NFP) report on Friday. In the middle, the US will also release the Personal Consumption Expenditure (PCE) Price Index, the Federal Reserve’s (Fed) favorite inflation gauge. The combo could set the tone for the upcoming Fed monetary policy decision, scheduled to meet next week and announce its decision on Thursday, November 7. The decision will come 24 hours after the country heads into the polls to choose the next president.
XAU/USD retreated from its fresh high but retains most of its intraday gains and trades at around $2,766. Technical readings in the daily chart favor another leg north. The 20 Simple Moving Average (SMA) accelerated higher, well below the current level, currently at around $2,685.00. The longer moving averages, in the meantime, also gained bullish traction, standing over $300 below the current level.
In the 4-hour chart, technical readings support a bullish continuation. Indicators head firmly north within positive territory, nearing overbought readings but still with room to run. Also, the 20 SMA turned higher below the current level, providing dynamic support at around $2,740.60. The 100 and 200 SMAs, in the meantime, maintain their firmly bullish slopes far below the shorter one.
Support levels: 2,751.90 2,739.70 2,721.20
Resistance levels: 2,775.00 2,790.00 2,810.00