The main category of Forex News.
You can use the search box below to find what you need.
[wd_asp id=1]
The main category of Forex News.
You can use the search box below to find what you need.
[wd_asp id=1]
The USD/CAD outlook shows an economic divergence between Canada and the US, which has propelled the pair higher. At the same time, the Bank of Canada has become more aggressive in lowering borrowing costs. On the other hand, markets are expecting the Fed to assume a more gradual pace for rate cuts.
–Are you interested in learning more about British Trade Platform Review? Check our detailed guide-
The Canadian dollar fell on Friday after domestic data showed weaker-than-expected retail sales. Sales rose by 0.4% compared to forecasts of a 0.5% increase. Meanwhile, core retail sales plunged by 0.7% compared to estimates for a 0.3% drop. Canada’s economy has continued to deteriorate, pushing the Bank of Canada to cut rates by a massive 50-bps.
On the other hand, the US economy is doing much better than most economists forecast. Sales rose more than expected in September, and the labor market has remained tight. As a result, markets are pricing a gradual pace for rate cuts by the Federal Reserve.
The shift to more aggressive rate cuts in Canada last week has created a slight policy divergence between the BoC and the Fed. As a result, the outlook for USD/CAD remains bright. An aggressive rate-cutting cycle will weaken the loonie, while a gradual one will eventually boost the dollar.
Meanwhile, traders are awaiting the crucial US presidential election next week. The outcome could affect both fiscal and monetary policy in the US. Consequently, the greenback might rally or collapse. Additionally, market participants will watch US GDP and monthly employment figures for more clues on the upcoming FOMC meeting.
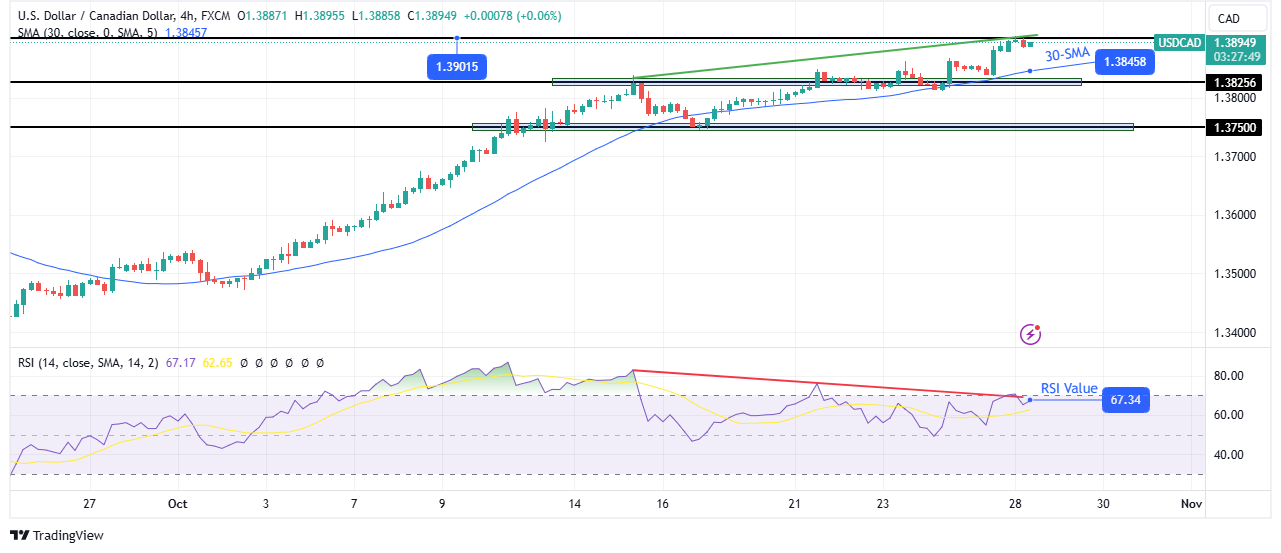
On the technical side, the USD/CAD price has continued its uptrend despite weaker bullish momentum. The price recently broke above the 1.3825 resistance and rallied to the 1.3901 key level. However, the indicators and price action show weakness in the uptrend.
–Are you interested to learn more about forex signals? Check our detailed guide-
The price is sticking close to the 30-SMA, a sign that bulls have lost enthusiasm to make large swings. Meanwhile, the RSI has made a bearish divergence, indicating fading bullish momentum. Finally, bears are stronger and have prompted several pullbacks to the 30-SMA. Therefore, the trend might soon reverse with a break below the SMA.
Looking to trade forex now? Invest at eToro!
68% of retail investor accounts lose money when trading CFDs with this provider. You should consider whether you can afford to take the high risk of losing your money
Silver price (XAG/USD) is under pressure as the US Dollar (USD) and Treasury yields continue to rally, driven by recent robust US economic data released on Friday. Silver price hovers around $33.50 per troy ounce during Monday’s European trading hours.
The dollar-denominated Silver faces challenges due to solid US Dollar (USD) amid higher Treasury yields. A higher US Dollar makes Silver expensive for buyers with foreign currency. The US Dollar Index (DXY), which measures the USD against six major currencies, trading near 104.30. Meanwhile, yields on 2-year and 10-year US Treasury bonds are at 4.12% and 4.28%, respectively.
Friday’s data release showed the US Michigan Consumer Sentiment Index rose to 70.5 in October from 68.9, beating forecasts of 69.0. Additionally, Durable Goods Orders declined by 0.8% month-over-month in September, a smaller drop than the expected 1.0%.
Political uncertainty around the US presidential election may lend some support to Silver. In the past three weeks, allies of former President Donald Trump faced at least 10 legal setbacks in key battleground states, which could influence the November 5 race between Trump and his Democratic opponent, Vice President Kamala Harris.
The safe-haven appeal of Silver may be limited, however, by easing geopolitical tensions. Following Israel’s airstrikes on Iranian missile and air defense sites early Saturday, which were less aggressive than expected, Iran has downplayed the impact. Supreme Leader Ayatollah Ali Khamenei remarked that the incident “should neither be downplayed nor exaggerated.”
Silver is a precious metal highly traded among investors. It has been historically used as a store of value and a medium of exchange. Although less popular than Gold, traders may turn to Silver to diversify their investment portfolio, for its intrinsic value or as a potential hedge during high-inflation periods. Investors can buy physical Silver, in coins or in bars, or trade it through vehicles such as Exchange Traded Funds, which track its price on international markets.
Silver prices can move due to a wide range of factors. Geopolitical instability or fears of a deep recession can make Silver price escalate due to its safe-haven status, although to a lesser extent than Gold’s. As a yieldless asset, Silver tends to rise with lower interest rates. Its moves also depend on how the US Dollar (USD) behaves as the asset is priced in dollars (XAG/USD). A strong Dollar tends to keep the price of Silver at bay, whereas a weaker Dollar is likely to propel prices up. Other factors such as investment demand, mining supply – Silver is much more abundant than Gold – and recycling rates can also affect prices.
Silver is widely used in industry, particularly in sectors such as electronics or solar energy, as it has one of the highest electric conductivity of all metals – more than Copper and Gold. A surge in demand can increase prices, while a decline tends to lower them. Dynamics in the US, Chinese and Indian economies can also contribute to price swings: for the US and particularly China, their big industrial sectors use Silver in various processes; in India, consumers’ demand for the precious metal for jewellery also plays a key role in setting prices.
Silver prices tend to follow Gold’s moves. When Gold prices rise, Silver typically follows suit, as their status as safe-haven assets is similar. The Gold/Silver ratio, which shows the number of ounces of Silver needed to equal the value of one ounce of Gold, may help to determine the relative valuation between both metals. Some investors may consider a high ratio as an indicator that Silver is undervalued, or Gold is overvalued. On the contrary, a low ratio might suggest that Gold is undervalued relative to Silver.
The USD/JPY forecast shows lower expectations for BoJ rate hikes after Japan’s election, which has left the yen fragile. At the same time, the dollar remained strong and was heading for a monthly gain due to better-than-expected economic data and the Trump trade.
–Are you interested in learning more about British Trade Platform Review? Check our detailed guide-
After Japan’s election, the yen collapsed to a three-month low as market participants slashed BoJ rate hike expectations. The Liberal Democratic Party won only 215 seats, below the majority of 233. Consequently, it creates a challenging outlook for fiscal and monetary policies. At the same time, the Bank of Japan might assume a cautious tone due to political uncertainty.
Economists expect the next rate hike in March next year. Meanwhile, inflation figures have shown weak consumption that could lead to further hike delays. As the yen declines, top officials in Japan have warned against sharp moves. Notably, the yen has had the biggest loss against the dollar this month, at 6.4%.
Meanwhile, the US dollar has gained amid signs that the US economy remains resilient despite high interest rates. Data throughout the month has revealed a better-than-expected performance, which has reduced Fed rate cut bets. Traders went from pricing in a 50-bps rate cut in November to a 25-bps rate cut.
At the same time, the likelihood of a Trump win in the November election has boosted the greenback. Trump’s policies might increase inflation, pausing the Fed’s rate-cutting cycle.
Market participants will keep digesting Japan’s election outcome as there will be no key events today.
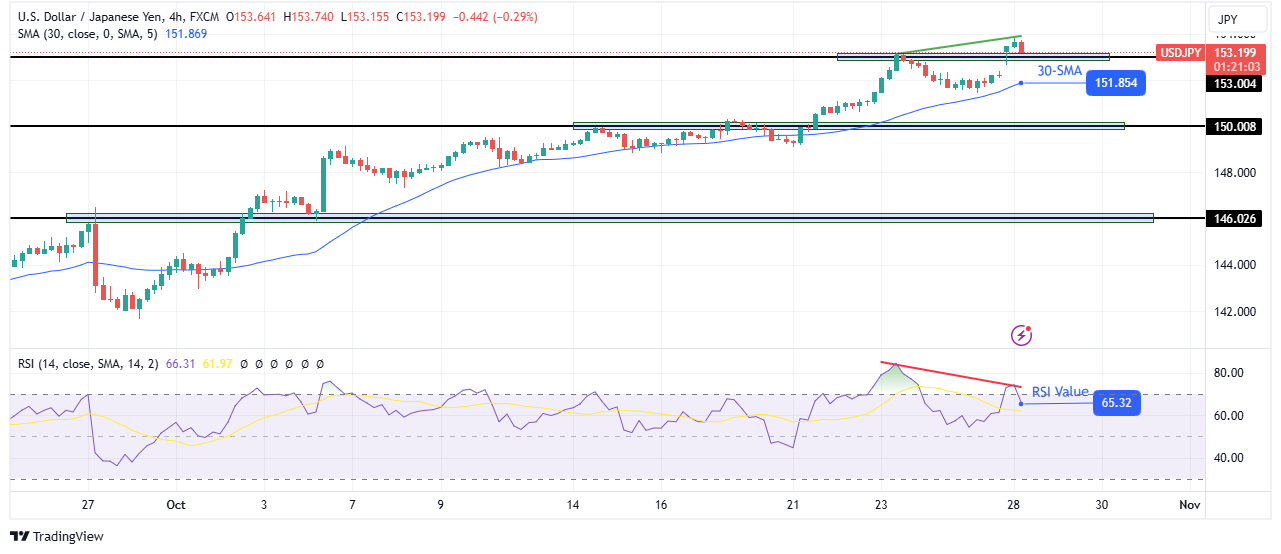
On the technical side, the USD/JPY price has reached a new high above the 153.00 resistance level. Moreover, the price trades well above the 30-SMA with the RSI above 50, suggesting a bullish trend.
–Are you interested to learn more about forex signals? Check our detailed guide-
However, the RSI has also made a bearish divergence, indicating weaker bullish momentum. Therefore, bulls might be exhausted, allowing bears to take charge by pushing below the 30-SMA. A break below the SMA would allow the price to reach the 150.00 support level. However, if bulls regain momentum, the price might only revisit the SMA before making new highs above 153.00.
Looking to trade forex now? Invest at eToro!
68% of retail investor accounts lose money when trading CFDs with this provider. You should consider whether you can afford to take the high risk of losing your money
EUR/USD holds its ground and trades in a narrow channel at around 1.0800 after closing the fourth consecutive week in negative territory. The positive shift seen in risk mood could help the pair edge higher in the second half of the day.
The table below shows the percentage change of Euro (EUR) against listed major currencies last 7 days. Euro was the weakest against the US Dollar.
| USD | EUR | GBP | JPY | CAD | AUD | NZD | CHF | |
|---|---|---|---|---|---|---|---|---|
| USD | 0.64% | 0.66% | 2.55% | 0.54% | 1.59% | 1.59% | 0.45% | |
| EUR | -0.64% | -0.05% | 1.82% | -0.01% | 0.91% | 0.84% | -0.27% | |
| GBP | -0.66% | 0.05% | 1.87% | -0.11% | 0.94% | 0.93% | -0.26% | |
| JPY | -2.55% | -1.82% | -1.87% | -1.96% | -0.92% | -0.88% | -2.10% | |
| CAD | -0.54% | 0.01% | 0.11% | 1.96% | 0.95% | 1.10% | -0.22% | |
| AUD | -1.59% | -0.91% | -0.94% | 0.92% | -0.95% | 0.08% | -1.20% | |
| NZD | -1.59% | -0.84% | -0.93% | 0.88% | -1.10% | -0.08% | -1.18% | |
| CHF | -0.45% | 0.27% | 0.26% | 2.10% | 0.22% | 1.20% | 1.18% |
The heat map shows percentage changes of major currencies against each other. The base currency is picked from the left column, while the quote currency is picked from the top row. For example, if you pick the Euro from the left column and move along the horizontal line to the US Dollar, the percentage change displayed in the box will represent EUR (base)/USD (quote).
The US Dollar (USD) preserved its strength heading into the weekend and forced EUR/USD to stay on the back foot. Rising US Treasury bond yields helped the currency find demand on Friday.
Early Monday, US stock index futures rise between 0.5% and 0.7%. A bullish opening in Wall Street, followed by a risk rally, could weigh on the USD and open the door for an extended EUR/USD rebound in the American session on Monday.
The only data featured in the US economic calendar will be the Federal Reserve Bank of Dallas’ Texas Manufacturing Business Index, which is unlikely to trigger a noticeable market reaction. Later in the week, third-quarter Gross Domestic Product (GDP) data from Germany, the Eurozone and the US will be watched closely by market participants. On Friday, the US Bureau of Labor Statistics will release the October employment report, which will include Unemployment Rate, Nonfarm Payrolls and wage inflation figures.
EUR/USD was last seen trading near the upper limit of the descending regression channel coming from late September, currently located at 1.0800. Once the pair rises above this level and confirms it as support, technical buyers could show interest. In this scenario, the 50-period Simple Moving Average (SMA) on the 4-hour chart could act as interim resistance at 1.0830 before 1.0870 (200-day SMA).
On the downside, 1.0760 (mid-point of the descending channel) aligns as first support ahead of 1.0710-1.0700 (lower limit of the descending channel, static level).
In the meantime, the Relative Strength Index (RSI) indicator on the 4-hour chart rises toward 50, reflecting sellers’ hesitancy.
The Euro is the currency for the 19 European Union countries that belong to the Eurozone. It is the second most heavily traded currency in the world behind the US Dollar. In 2022, it accounted for 31% of all foreign exchange transactions, with an average daily turnover of over $2.2 trillion a day. EUR/USD is the most heavily traded currency pair in the world, accounting for an estimated 30% off all transactions, followed by EUR/JPY (4%), EUR/GBP (3%) and EUR/AUD (2%).
The European Central Bank (ECB) in Frankfurt, Germany, is the reserve bank for the Eurozone. The ECB sets interest rates and manages monetary policy. The ECB’s primary mandate is to maintain price stability, which means either controlling inflation or stimulating growth. Its primary tool is the raising or lowering of interest rates. Relatively high interest rates – or the expectation of higher rates – will usually benefit the Euro and vice versa. The ECB Governing Council makes monetary policy decisions at meetings held eight times a year. Decisions are made by heads of the Eurozone national banks and six permanent members, including the President of the ECB, Christine Lagarde.
Eurozone inflation data, measured by the Harmonized Index of Consumer Prices (HICP), is an important econometric for the Euro. If inflation rises more than expected, especially if above the ECB’s 2% target, it obliges the ECB to raise interest rates to bring it back under control. Relatively high interest rates compared to its counterparts will usually benefit the Euro, as it makes the region more attractive as a place for global investors to park their money.
Data releases gauge the health of the economy and can impact on the Euro. Indicators such as GDP, Manufacturing and Services PMIs, employment, and consumer sentiment surveys can all influence the direction of the single currency. A strong economy is good for the Euro. Not only does it attract more foreign investment but it may encourage the ECB to put up interest rates, which will directly strengthen the Euro. Otherwise, if economic data is weak, the Euro is likely to fall. Economic data for the four largest economies in the euro area (Germany, France, Italy and Spain) are especially significant, as they account for 75% of the Eurozone’s economy.
Another significant data release for the Euro is the Trade Balance. This indicator measures the difference between what a country earns from its exports and what it spends on imports over a given period. If a country produces highly sought after exports then its currency will gain in value purely from the extra demand created from foreign buyers seeking to purchase these goods. Therefore, a positive net Trade Balance strengthens a currency and vice versa for a negative balance.
Silver (XAG/USD) attracts fresh sellers during the Asian session on Monday and currently trades around the $33.30 area, down nearly 1.25% for the day. The white metal, however, manages to hold above a one-week low, around the $33.10-$33.00 area, set on Friday, warranting some caution for bearish traders.
Moreover, technical indicators on the daily chart – though have been losing positive traction – are holding in positive territory. This further makes it prudent to wait for a convincing break below the $33.00 mark before positioning for an extension of last week’s pullback from the highest level since October 2012. Some follow-through selling below the $32.75-$32.65 resistance-turned-support will reaffirm the negative bias and make the XAG/USD vulnerable.
The subsequent downfall might expose the $32.20-$32.15 intermediate support before the white metal drops to the $32.00 round figure and the $31.70-$31.65 region. The downward trajectory could extend further and drag the XAG/USD towards the $31.00 mark en route to the $30.50 area and the monthly swing low, close to the $30.00 psychological mark tested on October 8.
On the flip side, the $33.65 horizontal zone now seems to have emerged as an immediate hurdle, above which the XAG/USD is likely to reclaim the $34.00 mark and climb further towards the $34.30-$34.35 supply zone. The momentum could extend further and allow bulls to make a fresh attempt to conquer the $35.00 psychological mark before aiming to challenge the October 2012 swing high, around the $35.35-$35.40 region.
Silver is a precious metal highly traded among investors. It has been historically used as a store of value and a medium of exchange. Although less popular than Gold, traders may turn to Silver to diversify their investment portfolio, for its intrinsic value or as a potential hedge during high-inflation periods. Investors can buy physical Silver, in coins or in bars, or trade it through vehicles such as Exchange Traded Funds, which track its price on international markets.
Silver prices can move due to a wide range of factors. Geopolitical instability or fears of a deep recession can make Silver price escalate due to its safe-haven status, although to a lesser extent than Gold’s. As a yieldless asset, Silver tends to rise with lower interest rates. Its moves also depend on how the US Dollar (USD) behaves as the asset is priced in dollars (XAG/USD). A strong Dollar tends to keep the price of Silver at bay, whereas a weaker Dollar is likely to propel prices up. Other factors such as investment demand, mining supply – Silver is much more abundant than Gold – and recycling rates can also affect prices.
Silver is widely used in industry, particularly in sectors such as electronics or solar energy, as it has one of the highest electric conductivity of all metals – more than Copper and Gold. A surge in demand can increase prices, while a decline tends to lower them. Dynamics in the US, Chinese and Indian economies can also contribute to price swings: for the US and particularly China, their big industrial sectors use Silver in various processes; in India, consumers’ demand for the precious metal for jewellery also plays a key role in setting prices.
Silver prices tend to follow Gold’s moves. When Gold prices rise, Silver typically follows suit, as their status as safe-haven assets is similar. The Gold/Silver ratio, which shows the number of ounces of Silver needed to equal the value of one ounce of Gold, may help to determine the relative valuation between both metals. Some investors may consider a high ratio as an indicator that Silver is undervalued, or Gold is overvalued. On the contrary, a low ratio might suggest that Gold is undervalued relative to Silver.
Gold price has lost its two-day recovery momentum, trading below $2,750 amid a quiet start to a big week on Monday. Gold buyers did find acceptance above the $2,740 static resistance on Friday but the further upside appears elusive on resurgent US Dollar (USD) demand.
The USD resumes the recent uptrend, drawing safe-haven demand amid further escalation in the Middle East tensions and uncertainty around the November 5 US presidential election.
Israel attacked Iran with a series of airstrikes early Saturday, saying it was targeting military sites in retaliation for the barrage of ballistic missiles the latter fired upon Israel on October 1, 2024.
Iran’s official newspaper reported, citing the Iranian Supreme leader Ayatollah Ali Hosseini Khamenei as saying that “the evil committed by the Zionist regime (Israel) two nights ago should neither be downplayed nor exaggerated.”
Additionally, markets are wagering a less aggressive easing cycle by the US Federal Reserve (Fed) on US economic resilience, which keeps the sentiment around the Greenback underpinned at the expense of the Gold price.
However, the downside of the Gold price remains capped due to renewed expectations of more stimulus measures from China. China’s Vice Minister of Finance Liao Min said earlier that the country will step up countercyclical adjustments of its macro policies to bolster economic recovery in the fourth quarter.
China is the world’s biggest Gold consumer and hence, hopes of an increase in physical demand for Gold on stimulus optimism favors buyers. Further, the festive season in India – the world’s no.2 yellow metal market – could also lend support to the bright metal.
Looking ahead, the US economic calendar is devoid of any high-impact data release, and hence, Gold price will remain at the mercy of risk trends. Additionally, a sense of caution could prevail amid Mideast concerns and heading into an action-packed US data docket, with all eyes on inflation and employment details.
Gold price has tested $2,723, the 23.6% Fibonacci Retracement (Fibo) level of the latest record rally from the October 10 low of $2,604 to all-time high of $2,759, on its renewed downside.
Acceptance below that level on a sustained basis could extend the decline toward the 38.2% Fibo level of the same ascent at $2,700.
Further south, the 50% Fibo support at $2,681 will be challenged, where the 21-day Simple Moving Average (SMA) aligns.
Alternatively, Gold buyers could re-attempt the $2,750 psychological barrier if the 23.6% Fibo support at $2,723 holds.
The next relevant bullish target will be seen at the record high of $2,759.
The 14-day Relative Strength Index (RSI) is pointing lower but holds comfortable above the 50 level, currently trading near 64, suggesting that Gold price remains a good dip-buying trade at lower levels.
Gold has played a key role in human’s history as it has been widely used as a store of value and medium of exchange. Currently, apart from its shine and usage for jewelry, the precious metal is widely seen as a safe-haven asset, meaning that it is considered a good investment during turbulent times. Gold is also widely seen as a hedge against inflation and against depreciating currencies as it doesn’t rely on any specific issuer or government.
Central banks are the biggest Gold holders. In their aim to support their currencies in turbulent times, central banks tend to diversify their reserves and buy Gold to improve the perceived strength of the economy and the currency. High Gold reserves can be a source of trust for a country’s solvency. Central banks added 1,136 tonnes of Gold worth around $70 billion to their reserves in 2022, according to data from the World Gold Council. This is the highest yearly purchase since records began. Central banks from emerging economies such as China, India and Turkey are quickly increasing their Gold reserves.
Gold has an inverse correlation with the US Dollar and US Treasuries, which are both major reserve and safe-haven assets. When the Dollar depreciates, Gold tends to rise, enabling investors and central banks to diversify their assets in turbulent times. Gold is also inversely correlated with risk assets. A rally in the stock market tends to weaken Gold price, while sell-offs in riskier markets tend to favor the precious metal.
The price can move due to a wide range of factors. Geopolitical instability or fears of a deep recession can quickly make Gold price escalate due to its safe-haven status. As a yield-less asset, Gold tends to rise with lower interest rates, while higher cost of money usually weighs down on the yellow metal. Still, most moves depend on how the US Dollar (USD) behaves as the asset is priced in dollars (XAU/USD). A strong Dollar tends to keep the price of Gold controlled, whereas a weaker Dollar is likely to push Gold prices up.
Gold price (XAU/USD) edges lower to near $2,735, snapping the two-day losing streak during the early Asian session on Monday. However, the downside of the precious metal might be limited amid the ongoing geopolitical tensions and uncertainties surrounding the US presidential election.
Israeli Prime Minister Benjamin Netanyahu said that Saturday’s attack on Iran severely damaged Tehran’s defenses. Meanwhile, Iranian officials vowed an “appropriate response” Sunday, while saying they do not seek a wider war, per CNN. The geopolitical risks and uncertainty around the upcoming US presidential election could provide some support to traditional safe-haven assets like Gold.
The purchases of Gold reserves among central banks and increasing demand from investors have lifted the price of yellow metal. The World Gold Council suggested that the central banks worldwide purchased more than 1,000 tonnes of gold during each of the last two years, and China ranks atop the list of nations seeking to bolster their gold reserves.
On the other hand, a slower pace of rate reductions from the US Federal Reserve (Fed) amid the stronger US economic data undermines the yellow metal. According to the CME FedWatch tool, traders are now pricing in nearly 97.7% that the Fed will cut rates by 25 basis points (bps) in November.
Gold has played a key role in human’s history as it has been widely used as a store of value and medium of exchange. Currently, apart from its shine and usage for jewelry, the precious metal is widely seen as a safe-haven asset, meaning that it is considered a good investment during turbulent times. Gold is also widely seen as a hedge against inflation and against depreciating currencies as it doesn’t rely on any specific issuer or government.
Central banks are the biggest Gold holders. In their aim to support their currencies in turbulent times, central banks tend to diversify their reserves and buy Gold to improve the perceived strength of the economy and the currency. High Gold reserves can be a source of trust for a country’s solvency. Central banks added 1,136 tonnes of Gold worth around $70 billion to their reserves in 2022, according to data from the World Gold Council. This is the highest yearly purchase since records began. Central banks from emerging economies such as China, India and Turkey are quickly increasing their Gold reserves.
Gold has an inverse correlation with the US Dollar and US Treasuries, which are both major reserve and safe-haven assets. When the Dollar depreciates, Gold tends to rise, enabling investors and central banks to diversify their assets in turbulent times. Gold is also inversely correlated with risk assets. A rally in the stock market tends to weaken Gold price, while sell-offs in riskier markets tend to favor the precious metal.
The price can move due to a wide range of factors. Geopolitical instability or fears of a deep recession can quickly make Gold price escalate due to its safe-haven status. As a yield-less asset, Gold tends to rise with lower interest rates, while higher cost of money usually weighs down on the yellow metal. Still, most moves depend on how the US Dollar (USD) behaves as the asset is priced in dollars (XAU/USD). A strong Dollar tends to keep the price of Gold controlled, whereas a weaker Dollar is likely to push Gold prices up.
October 27, 2024 – Written by David Woodsmith
STORY LINK Pound to Euro Rate Week Ahead Forecast: Possible 8-Year Best say Analysts
Danske Bank forecasts that the Pound to Euro (GBP/EUR) exchange rate will strengthen to 1.2350 on a 6-month view as UK yields remain attractive.
In contrast, ING expects that GBP/EUR will weaken to 1.1630 by the second quarter of 2025.
During the week, the Pound to Euro (GBP/EUR) exchange rate strengthened to 1.2050 before settling just below 1.2000 as the Euro attempted to pare wider losses.
UK business confidence data was weaker than expected, but markets have tended to focus more on fiscal policy at this stage.
There are strong expectations that Chancellor Reeves will tighten fiscal policy in this week’s budget, but the fiscal rules will be adjusted to allow a substantial increase in borrowing to fund medium-term investment. There are tensions over the debt outlook and UK yields have moved higher.
ING commented; “Gilts underperformed other developed market bonds after the fiscal rule announcement, and there seems to be a consensus view that UK yields have extra room to rise on budget news.”
It added; “From an FX market perspective, what matters is whether any gilt underperformance turns into uncontrolled volatility. Given the pound is pricing in no risk premium, the downside risks for the currency would be very large.”

Monetary policy will remain a key medium-term element.
Although markets remain confident over a November interest rate cut, the chances dipped to just below 90% following the fiscal reports.
Danske expects the Bank of England will maintain a cautious stance in the near term. It commented; “While recent data has come in softer than anticipated by the BoE across the board, warranting a November cut, we think they will remain cautious and pause in December.”
In this context, Danske added; “GBP continues to benefit from a cautiously hawkish tone from the BoE signalling a more gradual cutting cycle relative to peers and UK growth outperformance relative to the Eurozone. We think these forces will continue to weigh on the cross also in the coming months.”
Goldman Sachs maintains a positive Pound stance; “Persistence in the trend of more positive growth news from the UK relative to the Euro area, as well as asymmetrically negative risks for EUR versus GBP from current geopolitical and upcoming US election risks are key factors behind our open recommendation to be short EUR/GBP.”
HSBC is less positive on the Pound due to the policy mix; “On the monetary policy front, we expect the dovish momentum around the BoE to continue, aided by the downturn in headline UK inflation. The 30 October budget will add a fiscal headwind to growth. Loose monetary and tight fiscal policy is rarely a currency positive.”
Danske did point to potential pound vulnerability if risk appetite deteriorates; “The UK runs a large current-account deficit, which makes GBP vulnerable when capital inflows fade; this keeps GBP at risk vs EUR in the wake of souring global risk appetite.”
International Money Transfer? Ask our resident FX expert a money transfer question or try John’s new, free, no-obligation personal service! ,where he helps every step of the way,
ensuring you get the best exchange rates on your currency requirements.
TAGS: Pound Euro Forecasts
October 27, 2024 – Written by Tim Boyer
STORY LINK Pound to Dollar Week Ahead Forecast: For GBP/USD Reeves and Trump to Dominate
HSBC expects the Pound to Dollar (GBP/USD) exchange rate will weaken to at least 1.25 over the next few months.
The bank is broadly bearish on the Pound and net dollar gains to drive Cable lower.
Danske Bank considers that GBP/USD can hold above 1.30 on a 6-month view.
GBP/USD dipped to 10-week lows near 1.2900 before a recovery to 1.2980.
According to ING, GBP/USD will remain vulnerable on a near-term view; “For now, we reiterate a bearish bias on GBP/USD, which can suffer from defensive positioning ahead of the combined UK budget and US election risks. Our view remains that 1.28 can be reached in the near term.”
HSBC commented on UK fiscal policy; “Our economists expect government measures to reduce the budget deficit from an estimated 3.7% of GDP in fiscal year 2024/25, to 3.1% of GDP in 2025/26, and further falls thereafter to 1.5% in 2028/29.”
It added; “This represents a tightening of fiscal policy that looks unlikely to happen in the US whoever wins the White House. It would also likely require looser monetary policy to compensate.”
Markets remain confident that the Federal Reserve and Bank of England will both cut interest rates by 25 basis points at the November meetings, but the overall markets environment could be radically different, especially given a binary US election outcome.
HSBC added; “our economists expect a deeper rate cutting cycle, with 225bp of cuts by the end of 2025 once persistent inflation eases, taking the Bank rate to 2.75%.”
The US election could be pivotal for the Pound.
ING commented on near-term dynamics; “Markets and betting odds are leaning increasingly in favour of Trump. This may be due to greater hedging demand for a Trump presidency, which is seen as a more impactful macro/market event due to protectionism, tax cuts, strict migration policies and risks to the Fed independence. We see both dollar upside risks and wider implied-historical volatility spread into Election Day.”
According to HSBC; “We view three of the four election outcomes as USD bullish for the weeks after the election. Only a Harris Presidency with a divided Congress would be clearly USD negative, in our opinion. Even that scenario might ultimately prove USD bullish. We also view a disputed or delayed election outcome as potentially USD bullish.”
TD Securities commented on the election; “A “Red Wave” (Republican sweep) would prompt a substantial USD rally, reminiscent of US Exceptionalism driven by tariffs, tax cuts, and deregulation.”
It added; “Conversely, a “Blue Wave” (Democratic sweep) would be detrimental for the USD. It could lead to unwinding of pro-Trump trades and hedges, causing initial volatility. Additionally, higher taxes and increased regulation could make US equities less attractive, prompting a shift towards Asian currencies and alternatives.”
International Money Transfer? Ask our resident FX expert a money transfer question or try John’s new, free, no-obligation personal service! ,where he helps every step of the way,
ensuring you get the best exchange rates on your currency requirements.
TAGS: Pound Dollar Forecasts
The euro has plunged during most of the week, but we are starting to see a little bit of support near the 1.08 level.
At this point in time, the market looks as if it is trying to bounce but there is still a lot of negativity out there, and I believe any rally at this point in time will probably continue to attract short sellers and it comes to this pair, mainly due to the fact that interest rate spiking in the United States will be a major driver of the US dollar.
I have no interest in buying this pair in the short term, unless of course something changes from a fundamental point of view.

The US dollar has rallied again during the course of the week, but it does look like we are struggling a little bit with a certain amount of resistance.
If we can break above the present area, then we could go looking to the 0.8750 level, an area that previously has been important due to both support and resistance, and it’s likely that we could go looking to that area.
I also believe that area would be very difficult to get above. Pulling back from this area could open up the possibility of a move to the 0.8550 level, which is a little bit of a floor. We are in the middle of 2 major areas, so expect choppiness.

The New Zealand dollar has fallen pretty significantly during the course of the week, as we are testing the 0.60 level. Breaking down below the bottom of the candlestick for the previous week opens up the possibility of a move down to the 0.5850 level.
If we turn around and bounce from there, it’s very likely that the market could go looking to the 0.61 level, but quite frankly I think this is an area that should continue to be a massive resistance, and of course, if the interest rates in America continue to spike and of course we continue to see more “risk off behavior”, it makes sense that we will go negative in this pair.


The NASDAQ 100 has fallen quite a bit during the course of the week to reach the 20,000 level, only to turn around and bounce rather significantly.
In fact, as we are closing out the week it looks like we are trying to do everything we can to continue to go much higher, perhaps reaching the 21,000 level before it is all said and done.
Ultimately, I think that short-term pullbacks could continue to be an issue, but I also recognize that we have a situation where traders are certainly bullish, and I think that it’s almost impossible to start shorting this index anytime soon.

During the trading week, we have seen the US dollar rally toward the 20 MXN level, but that area continues to be a major resistance barrier.
If we can break above that area, then the market is likely to continue to see plenty of reasons to go higher. After all, the market has a lot of things to worry about right now, and that of course makes the US dollar much more attractive than the Mexican peso which is pretty far out on the risk appetite spectrum, and that of course is the most important thing to pay attention to.
If we can break above the 20 MXN level, that could open up a move to the 20.50 MXN level. As things stand right now, I do believe that this remains a “buy on the dips” market.

Gold markets have had another bullish week, and it is probably worth noting that we have sold off quite a bit toward the top.
That being said, I also recognize that a short-term pullback would probably be the best thing that could happen for gold. Whether or not we get it remains to be seen, but the one thing that I can take away from this chart is that we are most certainly due for some type of dip so that you can take advantage of it.
If and when it happens, I would be a major buyer, with the $2600 level being a massive support level

The West Texas Intermediate Crude Oil market has rallied a bit during the course of the week as we continue to see a lot of back and forth.
At this point, I believe that the $65.50 level is a major floor in the market, and the $85 level above is a major ceiling. As we are closer to the bottom than the top, I suspect that range bound traders will continue to look at each one of these dips as a potential trading opportunity.
Having said that, I don’t necessarily think that the market is going to take off and jump straight in the air, but at this point in time I also recognize that a little bit of sideways and back and forth trading makes a lot of sense.

The US dollar has had a strong week against the Japanese yen, as we continue to see a lot of noisy behavior.
With that being the case, the ¥152 level looks to be a major area of importance, so if we can break above there, then the market could very well find itself looking toward the ¥155 level.
On the other hand, if we get some type of pullback, then I think you’ve got a situation where people will be looking for work value as the interest rate differential continues to favor the greenback.
Ready to trade our Forex weekly forecast? We’ve shortlisted the top forex trading accounts to choose from