The main category of Forex News.
You can use the search box below to find what you need.
[wd_asp id=1]
The main category of Forex News.
You can use the search box below to find what you need.
[wd_asp id=1]
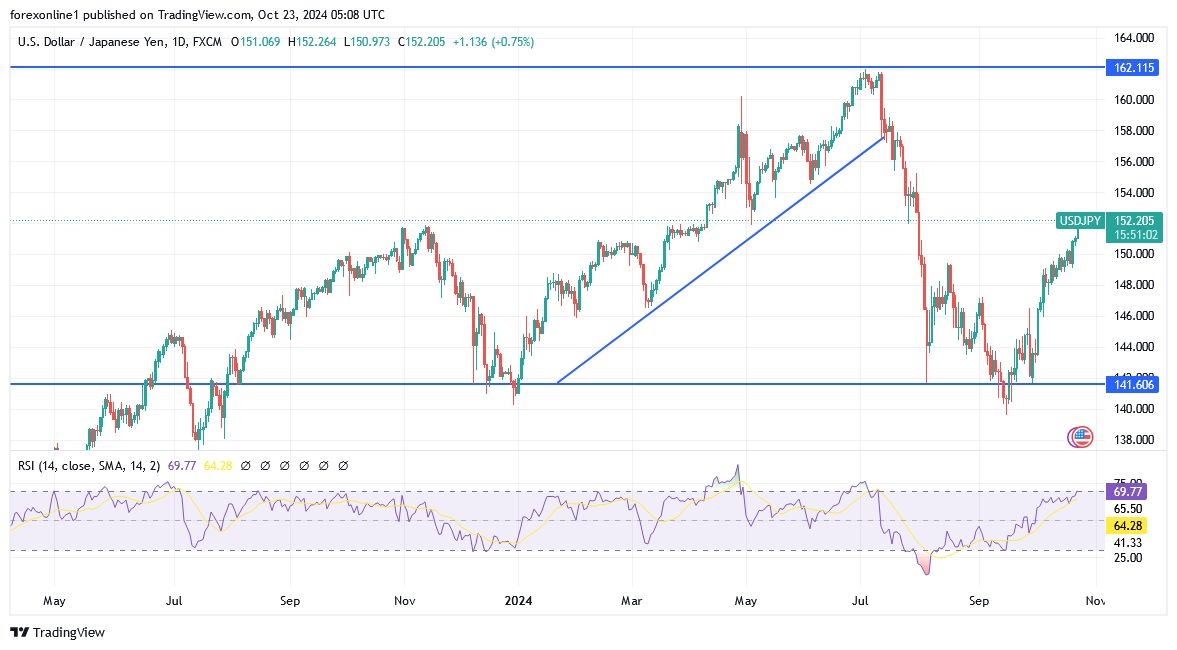
Japanese authorities had intervened in the currency markets earlier this year when the Yen breached the 160-yen level against the US dollar, with markets watching the 150-yen level as a potential new line in the sand.

According to forex market trading, the Japanese Yen began to weaken in mid-September due to increasing uncertainty about the path of interest rate hikes at the Bank of Japan. The local currency also came under pressure from the rising US dollar, which benefited from strong US economic data and increased odds of a Trump presidency again.
Overall, the US dollar has maintained its gains thanks to strong Treasury yields. The US Dollar Index traded slightly below the 104 marks on Tuesday, remaining at its strongest levels since early August, tracking the rise in Treasury yields amid strong US economic expectations and increased odds of a Trump presidency again.
A series of economic data on the Labor market, consumer inflation, and retail sales had indicated that the economy remains resilient, reducing the need for aggressive interest rate cuts by the Federal Reserve.
Given the series of strong US economic data, Minneapolis Federal Reserve President Neel Kashkari said the long-term path for interest rates may be higher than in the past. Dallas Federal Reserve President Lorie Logan also supported rate cuts but called for a patient approach.
Meanwhile, the so-called “Trump trade” has further boosted the US dollar as the former president’s tariff and tax policies are seen as inflationary. Investors are now looking forward to the release of preliminary Purchasing Managers’ Index data on Thursday, which will provide an updated view of the private sector’s performance in October.
According to the performance on the daily chart, the USD/JPY bullish trend is strengthening. As we mentioned before, a break of the psychological resistance of 150.00 will strengthen the bulls’ control over the trend and herald a stronger upward move with higher gains than the resistance of 152.25. furthermore, technical indicators are moving towards strong overbought levels. I expect the general trend of USD/JPY to remain bullish until the results of the US presidential elections early next month.
Ready to trade our USD/JPY forex forecast? Here are the best forex brokers in Japan to choose from.
Spot Gold reached yet another record high on Wednesday, trading as high as $2,758.36 before turning south. The bright metal retreated from such a high and trades at around $2,720 as the US Dollar maintained its positive momentum across the FX board. Financial markets are in risk-averse mode, with global stocks under pressure. Tech shares led the slide, albeit speculative interest is also looking at government bond yields, which jumped this week in anticipation of the United States (US) presidential election.
The world’s largest economy heads into the polls in little over two weeks, with no clear winner ahead of the event. It seems Vice President Kamala Harris is leading and has a roughly 2% lead over former President Donald Trump, yet the difference is barely significant.
Meanwhile, Treasury yields extended their weekly advance. The 10-year note currently offers 4.26%, while the 2-year note yields 4.06%, levels not seen since early in July.
The XAU/USD pair is currently stuck at around the 23.6% Fibonacci retracement of the $2,601.87/$2,756.36 rally at $2,721.20. The decline seems corrective, although it may continue towards $2,698.66, the 38.2% retracement of the same rally.
In the daily chart, technical indicators turned south, with the Relative Strength Index (RSI) indicator correcting overbought conditions and the Momentum easing from October highs. Both indicators support another leg lower, yet a break through the daily low at $2,708.57 will help confirm the slide. Additionally, it is worth mentioning moving averages maintain their firm upward slopes far below the current level, keeping the long-term bullish trend alive.
The 4-hour chart shows a near-term downward continuation is likely. Technical indicators head south almost vertically, crossing their midlines into the negative territory. At the same time, XAU/USD lost its bullish strength and turned flat, now providing dynamic resistance at around $2,732.70. Nevertheless, the 100 and 200 SMAs keep advancing far below the current level, limiting the downward potential of the pair.
Support levels: 2,708.50, 2,698.60, 2,680.10
Resistance levels: 2,732.70, 2,744.10 2,758.40
Silver price (XAG/USD) corrects sharply below $34.50 in Wednesday’s New York session after registering a fresh more than 12-year high slightly below $35.00 on Tuesday. The rally in the white metal appears to have paused for a while as the US Treasury yields have extended its upside.
10-year US Treasury yields jump to near 4.24% as investors expect the Federal Reserve (Fed) to follow a gradual policy-easing cycle. Historically, higher yields on interest-bearing assets increase the opportunity cost of holding an investment in non-yielding assets, such as Silver. The US Dollar (USD), which tracks the Greenback’s value against six major currencies, revisits the August high of 104.45.
However, the upside trend remains intact due to multiple catalysts. From growing United States (US) political uncertainty to escalating Middle East tensions, every catalyst is acting as a tailwind for the Silver price.
According to the Reuters/Ipsos polls, current Vice President Kamala Harris leads by a slight margin against former President Donald Trump. However, market participants worry that Trump’s victory could result in higher tariffs and lower taxes, which could force the Federal Reserve (Fed) to return to the restrictive policy stance for a period of time.
In the Middle East region, the launch of a rocket salvo by Iran-backed-Hezbollah on Israel’s military base near Tel Aviv exhibits signs that tensions between them will stay afloat. The appeal of precious metals, such as Silver, as a safe haven, given that investors consider them as a hedge against dismal market sentiment.
Silver price slumps after failing to capture the key resistance of $35.00. The white metal strengthened after breaking above the horizontal resistance plotted from the May 21 high of $32.50 on a daily timeframe, which will act as a support for now. Upward-sloping 20-day Exponential Moving Averages (EMAs) near $32.15 signal more upside ahead.
The 14-day Relative Strength Index (RSI) oscillates above 60.00, points to an active bullish momentum.
Silver is a precious metal highly traded among investors. It has been historically used as a store of value and a medium of exchange. Although less popular than Gold, traders may turn to Silver to diversify their investment portfolio, for its intrinsic value or as a potential hedge during high-inflation periods. Investors can buy physical Silver, in coins or in bars, or trade it through vehicles such as Exchange Traded Funds, which track its price on international markets.
Silver prices can move due to a wide range of factors. Geopolitical instability or fears of a deep recession can make Silver price escalate due to its safe-haven status, although to a lesser extent than Gold’s. As a yieldless asset, Silver tends to rise with lower interest rates. Its moves also depend on how the US Dollar (USD) behaves as the asset is priced in dollars (XAG/USD). A strong Dollar tends to keep the price of Silver at bay, whereas a weaker Dollar is likely to propel prices up. Other factors such as investment demand, mining supply – Silver is much more abundant than Gold – and recycling rates can also affect prices.
Silver is widely used in industry, particularly in sectors such as electronics or solar energy, as it has one of the highest electric conductivity of all metals – more than Copper and Gold. A surge in demand can increase prices, while a decline tends to lower them. Dynamics in the US, Chinese and Indian economies can also contribute to price swings: for the US and particularly China, their big industrial sectors use Silver in various processes; in India, consumers’ demand for the precious metal for jewellery also plays a key role in setting prices.
Silver prices tend to follow Gold’s moves. When Gold prices rise, Silver typically follows suit, as their status as safe-haven assets is similar. The Gold/Silver ratio, which shows the number of ounces of Silver needed to equal the value of one ounce of Gold, may help to determine the relative valuation between both metals. Some investors may consider a high ratio as an indicator that Silver is undervalued, or Gold is overvalued. On the contrary, a low ratio might suggest that Gold is undervalued relative to Silver.
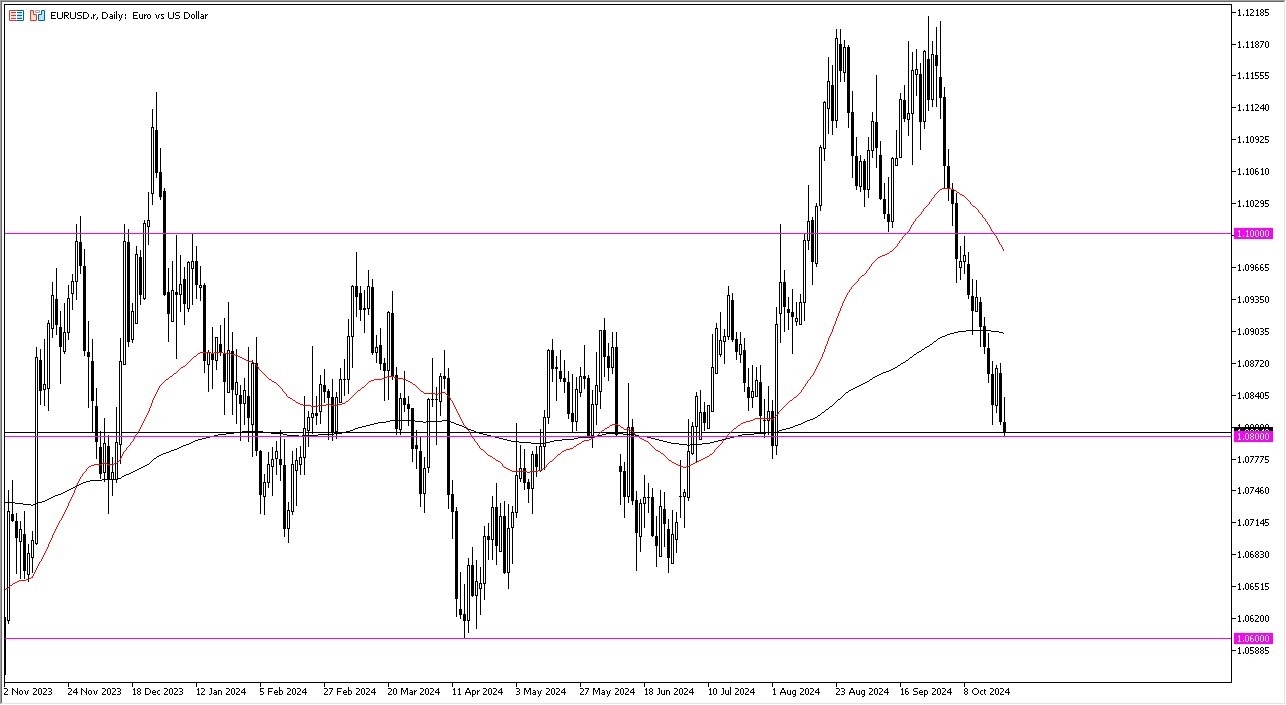
But that being said, it doesn’t look like that’s going to happen. We have to take a look at the 1.0775 level, and if we break down below there, then I think the market goes looking to the 1.07 level.
Keep in mind, a lot of this comes down to the Federal Reserve and the way it may have to react to stronger than anticipated economic data.
Furthermore, the European Union looks as if it is in a little bit of trouble. So, I think it all ties together for a potentially negative turn of events. All things being equal, I am more of the thought process of waiting to see whether or not this level actually holds.
I wouldn’t necessarily go into the market right now, but I think you have that binary decision. In other words, above the 1.09 level, you probably have to be a buyer. On the other hand, below the 1.0775 level, you probably have to be a seller.
Keep in mind how volatile this pair can be choppy, but I also recognize that once it starts moving, it does tend to trend for quite a while. Because of this, a certain amount of patience makes sense, and I think would be rewarded over the longer term.
Ready to trade our Forex daily analysis and predictions? Here are the best European brokers to choose from.
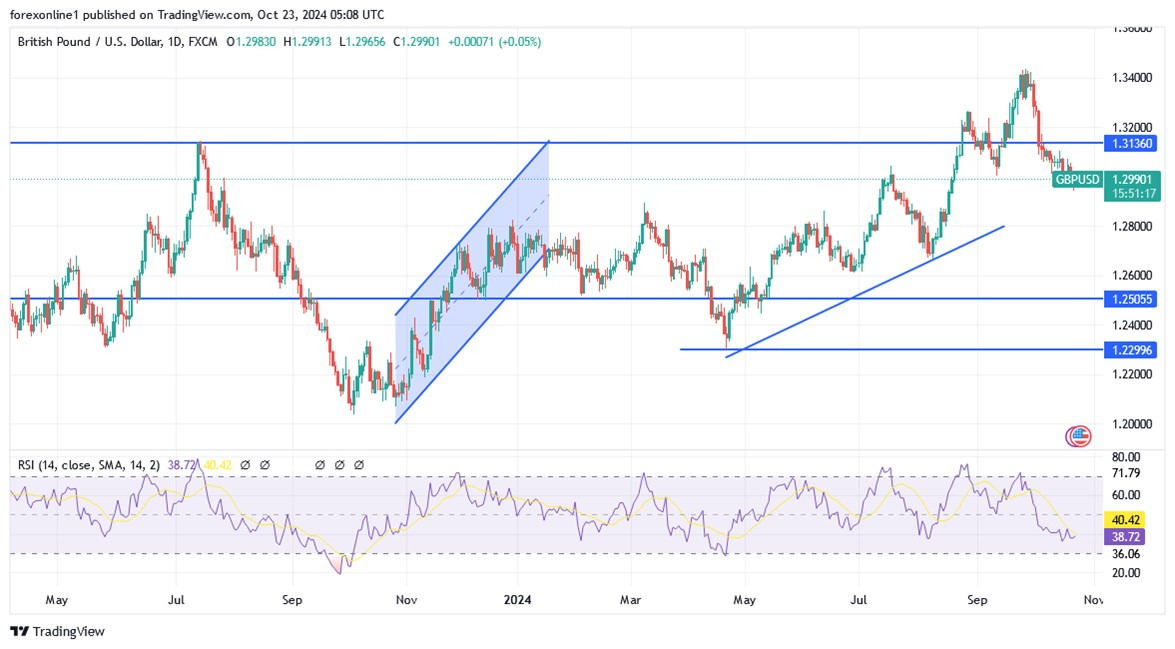
According to Forex market trading. The price of the US dollar is rising with the increasing chances of Donald Trump winning on November 4, and accordingly, analysts say that there are more possibilities in the following weeks for the victory. In this regard, US betting markets, including Polymarket, Kalshi and PredictIt, have raised the implied probability of a Trump win to more than 60%. The high expectations of a Trump victory are reflected in the continued outperformance of the US dollar, which includes another drop in the GBP/USD exchange rate to below 1.30. In the forex market, the euro/dollar exchange rate has also fallen by half a percent over the past 24 hours to trade at 1.0827.
Meanwhile, polls suggest the presidential race is much closer than the betting markets suggest. According to the Bookmakers Review, betting odds have accurately predicted a win for 77% of the expected candidates over the past 35 years.
Analysis from Barclays finds that at least 2% of the recent advance of the US dollar against the euro and the pound is due to positioning for the upcoming vote. As a result, a Kamala Harris win would see the premium fade while the status quo remains intact, sending the likes of GBP/USD and EUR/USD soaring.
In the event of a Trump victory, Barclays assumes markets will price in a 60% tariff on China as a near certainty and a 70% tariff on countries with large trade surpluses with the US. Earlier this week, analysts at Deutsche Bank said the likelihood of a “red victory” was also increasing, with Republicans gaining control of Congress and the White House. “We see the most bullish outcome for the US dollar being a red sweep and the most bearish outcome for the dollar being a blue sweep, but the magnitude of the moves is likely to be larger in the former case,” said George Saravelos, an analyst at Deutsche Bank. “We see the dollar rising across all currency pairs in a red sweep.” Trump, for his part, insisted last week that he has not changed his mind about pursuing a number of policies that are expected to support the dollar. In a new interview, Trump dismissed economists’ warnings that his proposed tariffs would have a negative impact on the economy and raise inflation. He said, “To me, the most beautiful word in the dictionary is tariffs,”.
A potential Trump president wants to impose a 60% tax on imports from China and a flat 10% levy on the rest of the world. This would be a repeat of the first-ever tariff-heavy agenda, and markets are taking notice. “It’s interesting that the dollar’s trajectory since its August lows closely follows the pattern that preceded the 2016 US election,” the analyst added.
Historically, the US dollar had surged in the wake of Trump’s victory in 2016. if history repeats itself, a significant rally could be in store in the coming weeks. Barclays’ model shows that the GBP/USD exchange rate is expected to fall to 1.23 in the event of a Trump victory. For EUR/USD, the target is set at 1.03. However, in case of Harris’ victory, EUR/USD is expected to recover to 1.11 in the following weeks. As for GBP/USD, the recovery is expected to extend to 1.33.
According to the performance on the daily chart, the general trend for the GBP/USD pair is still bearish. Technically, the stability below the psychological level of 1.3000 strengthens the bears’ control over the general trend and warns of a stronger downward move if the USD’s strength factors continue. The next support levels for the currency pair will be 1.2920 and 1.2800, respectively, which are sufficient to push the technical indicators towards strong oversold levels. On the other hand, and over the same time frame, there will be no initial break of the downtrend without first moving above the resistance of 1.3150.
Ready to trade our GBP/USD forecast? Here’s a list of some of the top forex brokers UK to check out.
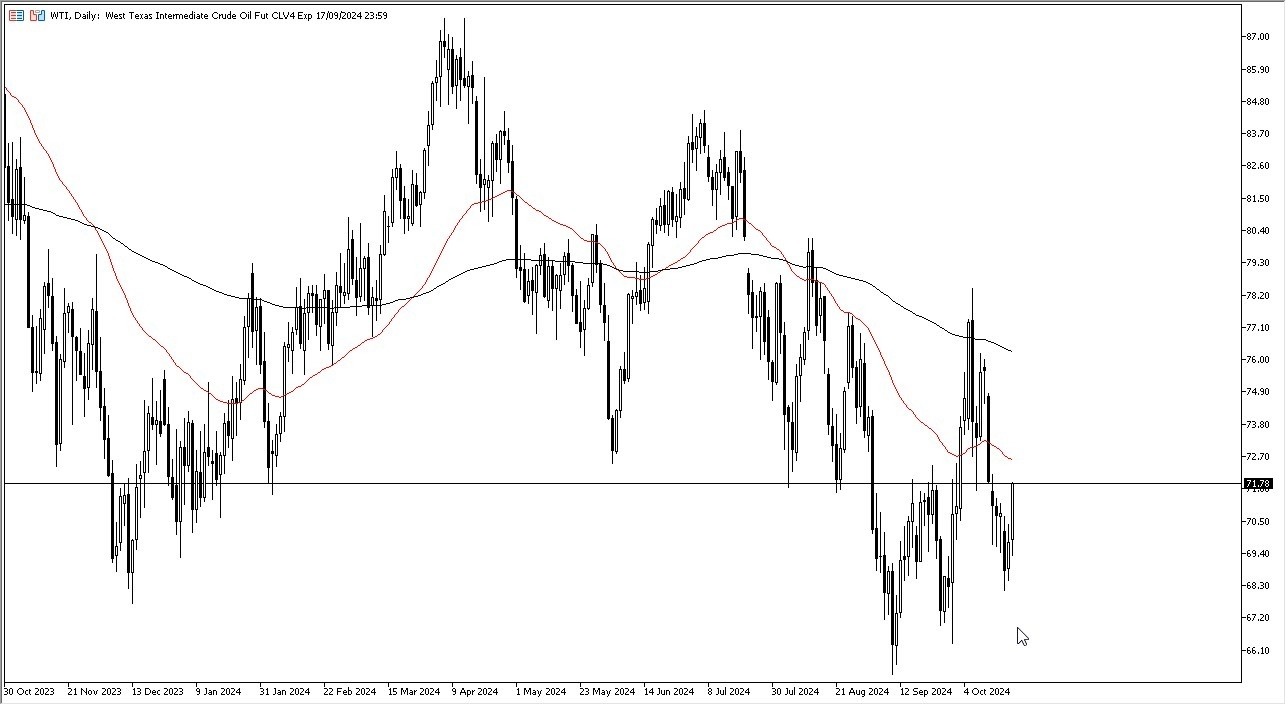
Furthermore, we also have geopolitical escalations out there that continue to be a major issue. Quite frankly, the Middle East isn’t calming down, and one would have to think that sooner or later it would have an influence on the oil market. I don’t necessarily think that the market is paying close attention to it right now, because quite frankly it’s been rather lackluster as of late. All things being equal, I think most of this comes down to the idea of demand, as traders are assuming that the conflict involving Israel and several factions in the Middle East probably won’t spread.
It was an extraordinarily bullish day on Tuesday, but we also have to pay attention to the fact that the 50 Day EMA sits right around the $72.70 level and is dropping. I would anticipate that the 50 Day EMA could offer a little bit of a ceiling in the market, as it is so widely followed. If we were to break above there, then I think it’s likely that we will continue to see oil go much higher, perhaps reaching the 200 Day EMA which is sitting just above the $76 level.
On the downside, there seems to be a significant amount of support at multiple levels, not the least of which would be the $66 level, which is the bottom of the range for the last 2 years. I think we are just simply bouncing from the lows, and that if you are a buyer of this market, you are essentially doing it for a short-term trade more than anything else. I would expect plenty of volatility in this general region.
Ready to trade oil price analysis and predictions? Here are the best Oil trading brokers to choose from.
Also, the US dollar is tracking the rise in Treasury yields, with the benchmark 10-year Treasury note reaching 4.22% for the first time since late July amid strong economic data and concerns about the deficit. Now, markets are pricing in a 90% probability that the Fed will opt for a more modest 25-basis point interest rate cut in November after a hefty 50-basis point cut in September. Concurrently, Investors are looking to the Federal Reserve’s Beige Book for updates on the central bank’s economic outlook.
According to forex trading, the US dollar is hovering at multi-month highs against other major currencies, with buying activity most pronounced against the yen.
In general, financial markets have increased their expectations for further rate cuts by the European Central Bank. The ECB cut interest rates for the third time this year, citing improved inflation control but a deteriorating economic outlook for the euro zone. ECB President Christine Lagarde’s comments were interpreted as a signal of a downward revision of economic forecasts, prompting markets to expect a 25bp cut at each meeting until mid-2025.
Investors are closely watching upcoming economic data, including PMI figures, which are expected to confirm the sluggish regional performance and potentially support further ECB action. A 25bp rate cut in December is widely expected, with a 30% chance of a larger 50bp cut. Meanwhile, strong US economic data has dampened expectations of a more aggressive rate cut by the Fed.
No change in my technical view on EUR/USD forecast as the overall trend remains bearish and breaking the 1.0800 psychological support strengthens the bears’ control over the trend and heralds a deeper downside move. Next up will be 1.0745 and 1.0600, respectively. These are enough to push all technical indicators towards strong oversold levels. On the other hand, and on the same time frame, the daily chart will not break the bearish outlook without the currency pair first moving above the psychological resistance of 1.1000. Aslo, the euro price will be affected today by new statements from the Governor of the European Central Bank, Lagarde.
Ready to trade our EUR/USD daily forecast? We’ve shortlisted the best forex broker list for you to check out.
In addition, the narrow US presidential election, which is only a few weeks away, is increasing demand for safe havens. At the same time, monetary easing from major global central banks is supporting the upward momentum of gold, as the People’s Bank of China and the European Central Bank recently cut key lending rates. At the same time, traders are assessing different views from Federal Reserve officials on the future path of US monetary policy.
In this regard, Kansas City Federal Reserve President Jeffrey Schmid is calling for a slower pace of interest rate cuts, while San Francisco Federal Reserve President Mary Daly stresses the need for further cuts to protect the Labor market.
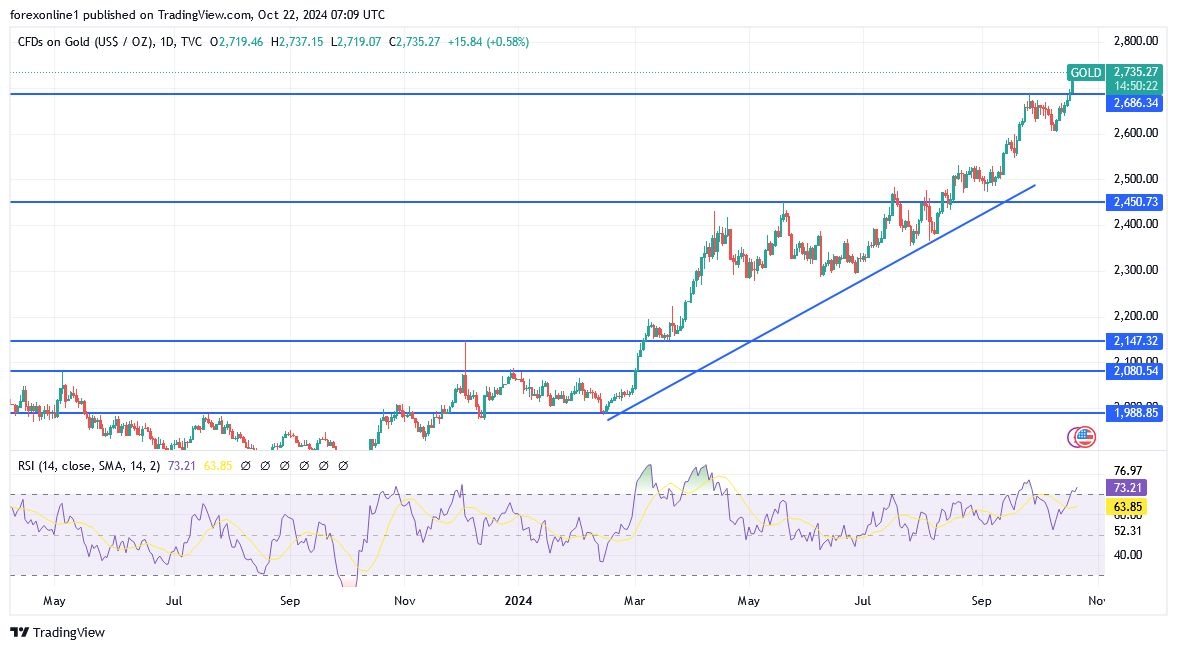
According to gold trading platforms, gold prices are rising due to an imbalance between supply and demand. Gold prices had risen to an all-time high of $2,753 per ounce as investors sought safe-haven assets amid rising geopolitical tensions. Consequently, this means that the price of the yellow metal has risen by 38 percent this year 2024. The rise in gold bullion prices came as the conflict between Lebanon and Israel intensified, with concerns growing about a broader regional escalation. At the same time, uncertainty about the outcome of the US elections, with particular concerns about the improvement in Donald Trump’s chances in betting markets, has also pushed investors towards safe-haven assets.
According to analysts, “gold usually attracts the attention of investors when they are looking for a store of value during uncertain times.”
Obviously, Gold is a proven hedge against inflation as investing in it is seen as preserving the real value of assets when other prices rise. It remains resilient when other markets are not. According to gold market analysis experts, “The gold price index tends to rise as interest rates fall due to the decline in the return on cash from banks, or bonds from governments, which pushes investors away from cash or debt towards the metal. And “A Trump victory in the US presidential election would increase the risk of a trade war, and his provocative nature could lead to increased uncertainty in the markets. And owning gold is essentially an insurance policy against the unknown.”
Analysts noted that investors’ appetite for gold has been boosted by “the risk of spillover into a wider conflict in the region” and uncertainty around the upcoming elections, making gold an attractive asset for those seeking to hedge against market volatility. The rising price of gold is a direct reflection of the fear and uncertainty facing investors.”
On the other hand, Chinese stimulus and a strong US economy are also boosting demand for gold. In addition to geopolitical factors, the second factor is the old supply and demand factors that affect the price of gold. Gold demand hit an all-time high in Q2, and we expect this rally to continue into Q3, and in the absence of increased supply, the price of gold will naturally rise.
Gold’s latest achievement comes amid growing concerns over conflicts in the Middle East and a tight US presidential election. Moreover, Gold is widely seen as a safe haven asset and attracts investors during times of geopolitical uncertainty. Furthermore, central banks around the world have been buying bullion in large quantities over the past year.
According to recent trading, the price of gold has risen by about 2.4% over the past week, as violence in the Middle East escalated and opinion polls showed a tight tie in the US presidential election. Furthermore, the gold price index is now up more than 30% this year as interest rates have been cut amid strong buying by central banks. Gold is not the only metal on the rise. Recently, Silver has jumped 5.5% in recent days and is now at its highest level since 2012. Also, Palladium and platinum are also on the rise.
Ready to trade today’s Gold forecast? Here are the best Gold brokers to choose from.
Gold (XAU/USD) remains bullish at $2,750.21, with support at $2,738.16. Resistance is at $2,754.01, and the 50-day EMA of $2,719.07 strengthens the trend. A break below support could signal sharper declines.
Sterling (GBP) remains steady as traders anticipate key speeches from MPC member Breeden and BOE Governor Bailey. Both talks are expected to offer insights into future monetary policy, so the pound may experience heightened volatility.
These speeches, alongside ongoing IMF meetings, could provide crucial guidance for the pound’s short-term direction.
Investors will be looking for any signals on interest rate adjustments or economic outlook, which could influence market sentiment and GBP movement.
GBP/USD is trading at $1.29688, down 0.11%, staying just below its pivot point of $1.29915. This level is key—if the pair breaks above it, we could see a stronger bullish bias, with immediate resistance at $1.30154 and further levels at $1.30531 and $1.30770.
Silver price (XAG/USD) halts its six-day winning streak, trading around $34.87 per troy ounce, the highest level not seen since October 2012, during Asian trading hours on Wednesday. The outlook for Silver is bullish, driven by safe-haven demand amid escalating tensions in the Middle East.
On Tuesday, Israel confirmed the death of Hashem Safieddine, the successor to the late Hezbollah leader Hassan Nasrallah, who was killed in an Israeli operation last month. The Israeli military stated that Safieddine was killed in a strike conducted three weeks ago in the southern suburbs of Beirut, according to Reuters.
Additionally, US Secretary of State Antony Blinken conveyed to Israeli Prime Minister Benjamin Netanyahu on Tuesday that Israel’s efforts to facilitate increased humanitarian aid into Gaza have been inadequate. Blinken urged Israel to take further action to improve the situation.
The upcoming US election has further heightened demand for safe-haven assets like Silver. A recent Reuters/Ipsos poll indicates that Democratic Vice President Kamala Harris holds a narrow lead of 46% to 43% over former Republican President Donald Trump.
This lead, recorded in a six-day poll that closed on Monday, is only slightly up from her 45% to 42% advantage in a poll conducted a week earlier, highlighting the tightness of the race with just two weeks remaining before the November 5 election.
Additionally, demand for non-yielding Silver has been boosted by monetary easing measures from major central banks. The People’s Bank of China (PBoC) and the European Central Bank (ECB) have both recently reduced key lending rates, contributing to increased interest in Silver.
Furthermore, the Bank of Canada (BoC) is expected to announce a significant interest rate cut of 50 basis points during its upcoming monetary policy meeting on Wednesday. In contrast, expectations for aggressive rate cuts by the Federal Reserve have decreased following a series of positive economic data.
Silver is a precious metal highly traded among investors. It has been historically used as a store of value and a medium of exchange. Although less popular than Gold, traders may turn to Silver to diversify their investment portfolio, for its intrinsic value or as a potential hedge during high-inflation periods. Investors can buy physical Silver, in coins or in bars, or trade it through vehicles such as Exchange Traded Funds, which track its price on international markets.
Silver prices can move due to a wide range of factors. Geopolitical instability or fears of a deep recession can make Silver price escalate due to its safe-haven status, although to a lesser extent than Gold’s. As a yieldless asset, Silver tends to rise with lower interest rates. Its moves also depend on how the US Dollar (USD) behaves as the asset is priced in dollars (XAG/USD). A strong Dollar tends to keep the price of Silver at bay, whereas a weaker Dollar is likely to propel prices up. Other factors such as investment demand, mining supply – Silver is much more abundant than Gold – and recycling rates can also affect prices.
Silver is widely used in industry, particularly in sectors such as electronics or solar energy, as it has one of the highest electric conductivity of all metals – more than Copper and Gold. A surge in demand can increase prices, while a decline tends to lower them. Dynamics in the US, Chinese and Indian economies can also contribute to price swings: for the US and particularly China, their big industrial sectors use Silver in various processes; in India, consumers’ demand for the precious metal for jewellery also plays a key role in setting prices.
Silver prices tend to follow Gold’s moves. When Gold prices rise, Silver typically follows suit, as their status as safe-haven assets is similar. The Gold/Silver ratio, which shows the number of ounces of Silver needed to equal the value of one ounce of Gold, may help to determine the relative valuation between both metals. Some investors may consider a high ratio as an indicator that Silver is undervalued, or Gold is overvalued. On the contrary, a low ratio might suggest that Gold is undervalued relative to Silver.