The main category of Forex News.
You can use the search box below to find what you need.
[wd_asp id=1]
The main category of Forex News.
You can use the search box below to find what you need.
[wd_asp id=1]
Silver price (XAG/USD) rebounds strongly above $34.00 in Thursday’s European session after declining to near $33.40 on Wednesday. The white metal bounces back as US bond yields tumble after a sharp rally in the past few weeks. 10-year US bond yields plummet to 4.19%, down 1.28% at the time of writing.
Lower yields on interest-bearing assets reduce the opportunity cost of holding an investment in non-yielding assets, such as Silver. Meanwhile, the US Dollar also faced a slight correction after a sharp rally. The US Dollar Index (DXY), which tracks the Greenback’s value against six major currencies, slides to near 104.15 after posting a fresh 12-week high around 104.50 on Wednesday.
The outlook of US yields and the Greenback remains firm as investors expect the Federal Reserve (Fed) to follow a moderate interest rate cut cycle. According to the CME FedWatch tool, the central bank is expected to cut interest rates by 25 basis points (bps) in November and December.
In today’s session, investors will focus on the flash United States (US) S&P Global PMI data for October, which will be published at 13:45 GMT.
The Silver price remains well-supported due to uncertainty over the US presidential election, which is coming in less than two weeks, and escalating Middle East tensions. The scenario of geopolitical and political uncertainty bodes well for precious metals, such as Silver price, as investors use the asset as a hedge in risky market conditions.
Silver price recovers sharply after a mild correction to near $33.40. The white metal aims to revisit a fresh over 12-year high near $35.00. The asset strengthened after breaking above the horizontal resistance plotted from the May 21 high of $32.50 on a daily timeframe, which will act as support for now. Upward-sloping 20- and 50-day Exponential Moving Averages (EMAs) near $32.30 and $31.10, respectively, signal more upside ahead.
The 14-day Relative Strength Index (RSI) oscillates above 60.00, points to an active bullish momentum.
Silver is a precious metal highly traded among investors. It has been historically used as a store of value and a medium of exchange. Although less popular than Gold, traders may turn to Silver to diversify their investment portfolio, for its intrinsic value or as a potential hedge during high-inflation periods. Investors can buy physical Silver, in coins or in bars, or trade it through vehicles such as Exchange Traded Funds, which track its price on international markets.
Silver prices can move due to a wide range of factors. Geopolitical instability or fears of a deep recession can make Silver price escalate due to its safe-haven status, although to a lesser extent than Gold’s. As a yieldless asset, Silver tends to rise with lower interest rates. Its moves also depend on how the US Dollar (USD) behaves as the asset is priced in dollars (XAG/USD). A strong Dollar tends to keep the price of Silver at bay, whereas a weaker Dollar is likely to propel prices up. Other factors such as investment demand, mining supply – Silver is much more abundant than Gold – and recycling rates can also affect prices.
Silver is widely used in industry, particularly in sectors such as electronics or solar energy, as it has one of the highest electric conductivity of all metals – more than Copper and Gold. A surge in demand can increase prices, while a decline tends to lower them. Dynamics in the US, Chinese and Indian economies can also contribute to price swings: for the US and particularly China, their big industrial sectors use Silver in various processes; in India, consumers’ demand for the precious metal for jewellery also plays a key role in setting prices.
Silver prices tend to follow Gold’s moves. When Gold prices rise, Silver typically follows suit, as their status as safe-haven assets is similar. The Gold/Silver ratio, which shows the number of ounces of Silver needed to equal the value of one ounce of Gold, may help to determine the relative valuation between both metals. Some investors may consider a high ratio as an indicator that Silver is undervalued, or Gold is overvalued. On the contrary, a low ratio might suggest that Gold is undervalued relative to Silver.
After closing the third consecutive day in negative territory on Wednesday, EUR/USD holds its ground and clings to small gains near 1.0800 early Thursday. Once the pair stabilizes above this level, sellers could be discouraged, paving the way for an extended recovery.
The table below shows the percentage change of Euro (EUR) against listed major currencies this week. Euro was the weakest against the US Dollar.
| USD | EUR | GBP | JPY | CAD | AUD | NZD | CHF | |
|---|---|---|---|---|---|---|---|---|
| USD | 0.62% | 0.67% | 1.72% | 0.04% | 0.75% | 0.67% | 0.21% | |
| EUR | -0.62% | -0.02% | 0.99% | -0.52% | 0.10% | -0.06% | -0.50% | |
| GBP | -0.67% | 0.02% | 1.03% | -0.63% | 0.09% | 0.00% | -0.51% | |
| JPY | -1.72% | -0.99% | -1.03% | -1.66% | -0.95% | -0.97% | -1.55% | |
| CAD | -0.04% | 0.52% | 0.63% | 1.66% | 0.63% | 0.69% | 0.04% | |
| AUD | -0.75% | -0.10% | -0.09% | 0.95% | -0.63% | -0.01% | -0.61% | |
| NZD | -0.67% | 0.06% | 0.00% | 0.97% | -0.69% | 0.00% | -0.51% | |
| CHF | -0.21% | 0.50% | 0.51% | 1.55% | -0.04% | 0.61% | 0.51% |
The heat map shows percentage changes of major currencies against each other. The base currency is picked from the left column, while the quote currency is picked from the top row. For example, if you pick the Euro from the left column and move along the horizontal line to the US Dollar, the percentage change displayed in the box will represent EUR (base)/USD (quote).
The broad-based US Dollar (USD) strength forced EUR/USD to stay on the back foot midweek. The USD benefited from the risk-averse market atmosphere and received an additional boost from rising US Treasury bond yields on Wednesday.
Early Thursday, the data from Germany and the Eurozone both showed that the business activity in the private sector contracted at a softening pace in early October. The preliminary HCOB Composite PMI for Germany improved to 48.4 from 47.5, while the Composite PMI for the Eurozone edged higher to 49.7 from 49.6.
Assessing the PMI surveys’ findings, “for the European Central Bank (ECB), the latest figures come with an unwelcome surprise. Inflation in the services sector seems likely to stay elevated, as costs and selling prices in October rose faster than the previous month,” said Dr. Cyrus de la Rubia, Chief Economist at Hamburg Commercial Bank and added:
“All this backs the idea that the ECB is likely to cut key interest rates by just 25 basis points in December, rather than the 50 basis points some have been talking about.”
In the second half of the day, the US economic calendar will feature the weekly Initial Jobless Claims and S&P Global PMI data. In case the number of first-time applications for unemployment benefits rise toward 250,000, the USD could come under bearish pressure with the immediate reaction. On the other hand, if the Composite PMI comes in near September’s reading of 54, the USD could stay resilient against its peers.
The upper limit of the descending regression channel coming from late September aligns as immediate resistance near 1.0800. The 20-period Simple Moving Average (SMA) on the 4-hour chart reinforces this level as well. Once the pair flips that level into support, it could extend its recovery toward 1.0850 (50-period SMA) and 1.0900 (round level, static level).
If EUR/USD fails to clear 1.0800, technical sellers could look to retain control. In this scenario, 1.0770 (mid-point of the descending channel) and 1.0730 (lower limit of the descending channel) could be seen as next support levels.
The Euro is the currency for the 19 European Union countries that belong to the Eurozone. It is the second most heavily traded currency in the world behind the US Dollar. In 2022, it accounted for 31% of all foreign exchange transactions, with an average daily turnover of over $2.2 trillion a day. EUR/USD is the most heavily traded currency pair in the world, accounting for an estimated 30% off all transactions, followed by EUR/JPY (4%), EUR/GBP (3%) and EUR/AUD (2%).
The European Central Bank (ECB) in Frankfurt, Germany, is the reserve bank for the Eurozone. The ECB sets interest rates and manages monetary policy. The ECB’s primary mandate is to maintain price stability, which means either controlling inflation or stimulating growth. Its primary tool is the raising or lowering of interest rates. Relatively high interest rates – or the expectation of higher rates – will usually benefit the Euro and vice versa. The ECB Governing Council makes monetary policy decisions at meetings held eight times a year. Decisions are made by heads of the Eurozone national banks and six permanent members, including the President of the ECB, Christine Lagarde.
Eurozone inflation data, measured by the Harmonized Index of Consumer Prices (HICP), is an important econometric for the Euro. If inflation rises more than expected, especially if above the ECB’s 2% target, it obliges the ECB to raise interest rates to bring it back under control. Relatively high interest rates compared to its counterparts will usually benefit the Euro, as it makes the region more attractive as a place for global investors to park their money.
Data releases gauge the health of the economy and can impact on the Euro. Indicators such as GDP, Manufacturing and Services PMIs, employment, and consumer sentiment surveys can all influence the direction of the single currency. A strong economy is good for the Euro. Not only does it attract more foreign investment but it may encourage the ECB to put up interest rates, which will directly strengthen the Euro. Otherwise, if economic data is weak, the Euro is likely to fall. Economic data for the four largest economies in the euro area (Germany, France, Italy and Spain) are especially significant, as they account for 75% of the Eurozone’s economy.
Another significant data release for the Euro is the Trade Balance. This indicator measures the difference between what a country earns from its exports and what it spends on imports over a given period. If a country produces highly sought after exports then its currency will gain in value purely from the extra demand created from foreign buyers seeking to purchase these goods. Therefore, a positive net Trade Balance strengthens a currency and vice versa for a negative balance.
STORY LINK Pound Euro Exchange Rate Forecast: GBP/EUR Touches Five-Day Best
The Pound Euro (GBP/EUR) exchange rate touched a five-day high on Wednesday, although it wavered in a narrow range, as a risk-off mood and UK budget hopes impacted the pairing.
At the time of writing, GBP/EUR traded at €1.2034, having hit a five-day high of €1.2043 earlier in the session.
The Euro (EUR) had a mixed performance on Wednesday, influenced by a risk-off market mood and a strengthening US Dollar (USD).
While the risk-averse market sentiment supported the safer Euro against its riskier counterparts, the Euro’s strong negative correlation with the rising US Dollar exerted downward pressure on EUR.
The US Dollar and the risk-off mood were both driven by ‘Trump trade’. Investors have been betting on a Donald Trump victory in next month’s US presidential election, with the policy implications impacting USD and wider markets.
Analysts suggest that Trump’s protectionist policies and tax cuts could drive up US inflation and negatively impact the global economy, with these expectations boosting the USD and souring the market mood.
Meanwhile, the increasingly risk-sensitive Pound (GBP) maintained its strength against the Euro on Wednesday, even in the face of a gloomy market mood.

GBP’s resilience was bolstered by hopes of pro-growth measures in the UK government’s upcoming Autumn Budget.
The anticipation surrounding the budget has caused some volatility in the Pound over recent weeks, with fears of tax hikes and spending cuts weighing on GBP, while hopes of pro-growth measures have provided support.
On Wednesday, hopes of pro-growth measures appeared to bolster Sterling, enabling it to hold steady against the safer Euro despite the prevailing risk-off market mood. The optimism came as the Lloyds Banking Group voiced its confidence in the budget.
Lloyds Chief Financial Officer William Chalmers stated:
‘Whatever the tax changes might be, we believe that they will be pursued in the context of a constructive, pro-growth agenda. And it’s that overall balance that we’re really looking for, and indeed it’s that overall balance, that pro-growth agenda, that we would seek to be a part of going forward.’
Looking forward, Thursday’s PMI surveys may influence the Pound Euro pair’s movement. The Eurozone’s surveys are predicted to indicate another contraction in overall business activity this month, though at a slower rate than in September.
Conversely, the UK’s PMIs are expected to remain steady, with both manufacturing and the key services sector staying in positive territory.
These outcomes might lead investors to prefer the Pound over the Euro. However, any unanticipated results could generate volatility.
International Money Transfer? Ask our resident FX expert a money transfer question or try John’s new, free, no-obligation personal service! ,where he helps every step of the way,
ensuring you get the best exchange rates on your currency requirements.
TAGS: Pound Euro Forecasts
STORY LINK EUR/GBP Forecast: Euro Woes Continue to Support the Pound
The Pound to Euro (GBP/EUR) exchange rate found support below 1.2000 on Tuesday and strengthened to 1.2030 on Wednesday, close to 30-month highs.
The Pound has been relatively quiet in global markets while the Euro has remained under pressure amid expectations of faster interest rate cuts.
According to Danske Bank; “GBP continues to benefit from UK growth outperformance relative to the Eurozone.
The bank sees the potential for GBP/EUR to extend gains to 1.2350 on a 6-month view. That would be the strongest level for over 8 years.
Euro vulnerability is likely to continue, but uncertainty surrounding UK fiscal policy could serve to limit the scope for near-term GBP/EUR gains.
Rabobank commented on the Euro; “It is likely that a large part of the single currency’s resilience through much of this year has been drawn from the view that the ECB would be cautious in cutting interest rates. However, this view is changing.”
ING noted; “Even the most hawkish members like Austria’s Holzmann decided not to push back against market pricing for back-to-back ECB cuts into mid-2025, and President Christine Lagarde reiterated her generally dovish tone at a TV interview yesterday.”
According to Holzmann; “the deflationary process was much faster than we had thought.”
On rate cuts he added; “I’m sure there will be others following in the future, and not too far.”
Portugal’s central bank head Centeno has continued to warn about inflation falling too low.
He commented; “I see more risks in undershooting target inflation than the other way around and most of the risks that we see, the downside risks that we see right now in our projections, they are endogenous.”
Rabobank added; “Even though Rabo’s central view is that the ECB will stick to 25 bps rate cut increments, it is possible that a more dovish ECB will remove the support which appears to be preventing the EUR from facing up to Germany’s structural economic woes.”
There have been no major UK data releases this week, although the latest survey evidence suggested a further easing of wage pressures.
According to human resources data company Brightmine, pay rises slowed to 4.0% in the third quarter from 4.8% in the second quarter while expectations surrounding increases for the coming year slowed sharply to 3% from 6% last year.
Sheila Attwood, senior content manager at Brightmine did note that there were still areas where the labour market is tight; “While pay awards are expected to decline in 2025, businesses are continuing to find creative ways to support their workforce, particularly by addressing skills shortages and retaining key talent.”
Markets remain very confident that rates will be cut at the November Bank of England (BoE) meeting, but inflation doubts will potentially deter a more aggressive BoE stance.
International Money Transfer? Ask our resident FX expert a money transfer question or try John’s new, free, no-obligation personal service! ,where he helps every step of the way,
ensuring you get the best exchange rates on your currency requirements.
TAGS: Euro Pound Forecasts
Gold price is reversing a part of Wednesday’s correction from record highs of $2,759 early Thursday. Gold buyers draw support from a pause in the US Dollar (USD) advance, as the US Treasury bond yields rally takes a breather in the lead-up to the preliminary S&P Global US PMI data.
The minor pullback in the USD alongside the US Treasury bond yields could be attributed to a stabilizing market mood in Asia, following Wall Street’s tech sell-off overnight. US equity futures rebound amid a risk reset after investors breathed a sigh of relief on Tesla Inc.’s encouraging earnings report.
Tesla reported adjusted earnings of 72 cents per share for the quarter, above the average analyst estimate and snapping four consecutive quarters in which the measure missed expectations, per CNBC News. The company said its Cybertruck, which it first delivered late last year, has reached profitability for the first time,
The further upside in Gold price, however, remains at the mercy of the upcoming Euro area and the US preliminary business PMI data. Investors will seek cues on the health of the global economy, impacting risk sentiment and safe-havens such as the USD, Gold price, etc.
The US S&P Global preliminary Manufacturing PMI is seen ticking higher to 47.5 in October from September’s 47.3 while the Services PMI is set to edge a tad lower to 55.0 in the same period from 55.2 in September.
Meanwhile, the market’s nervousness ahead of key US earnings reports and the presidential election will also play its part in driving the sentiment around Gold price. Any potential decline in Gold price is likely to be bought into, as buyers could re-emerge on Gold’s safe-haven demand due to the November 5 US election and the ongoing Middle East conflict.
Gold price seems to be facing stiff resistance at $2,723, the 23.6% Fibonacci Retracement (Fibo) level of the latest record rally from the October 10 low of $2,604 to an all-time high of $2,759.
Acceptance above that level could encourage buyers to take on the $2,750 psychological barrier. The record high of $2,759 will be next on buyers’ radars.
The 14-day Relative Strength Index (RSI) is flattish but well above the 50 level, currently trading near 65.60, pointing to more upside momentum.
However, if Gold sellers jump back into the game, the 38.2% Fibo level of the same ascent at $2,700 will come to the rescue of buyers.
A sustained move below the latter will put the 50% Fibo support at $2,682 to the test.
The line in the sand for Gold optimists is aligned at the 21-day Simple Moving Average (SMA) at $2,670.

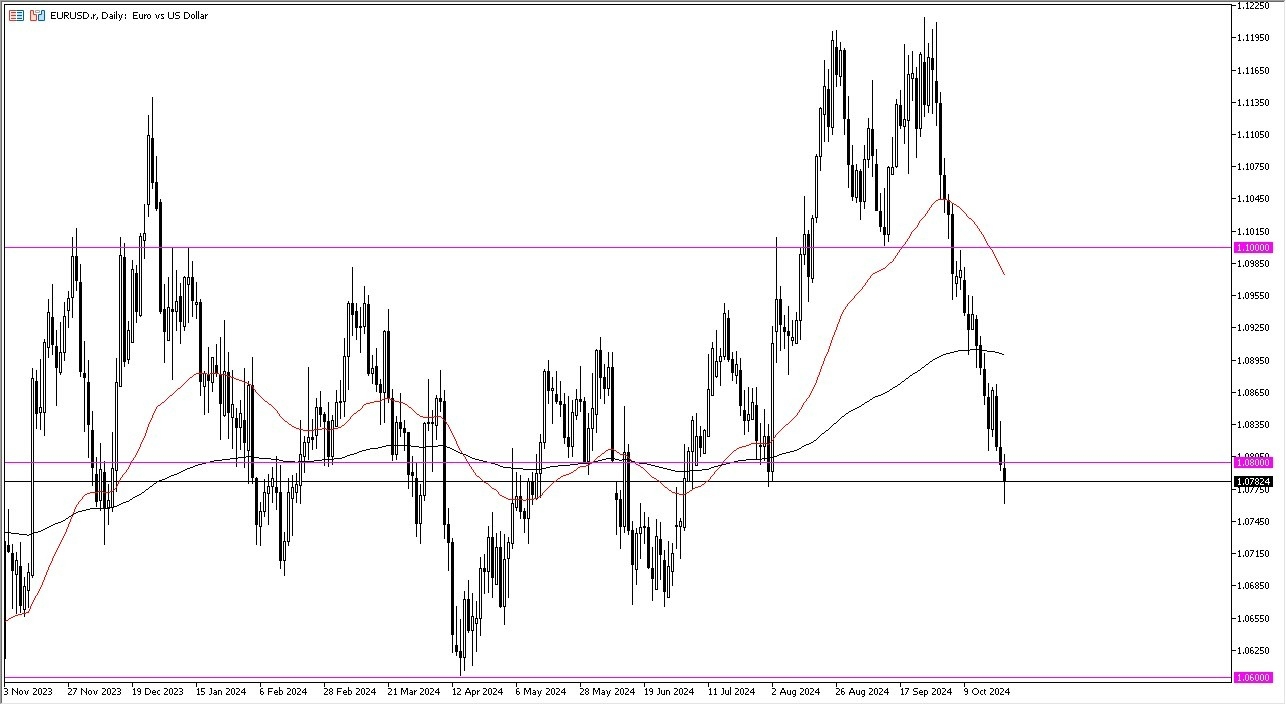
In other words, there is a real concern that the Federal Reserve is about to lose control of the bond market, and if that’s the case, things could get wild. At this point, a turnaround is possible, though. We do have PMI numbers coming out of Germany and the United States during the trading session, but I think that Thursday’s probably going to be a question of whether or not we can recover. The 200-day EMA sits right around the 1.09 level, and it’s not until we break above there that I would consider buying this pair. Between now and then, we could see a little bit of a rally, only to see exhaustion and start selling again.
Keep in mind, there’s also the risk appetite part of the equation, because if risk appetite starts to fall apart, then the US dollar typically attracts a lot of inflows via the treasury market. Keep in mind that as rates go higher and people are concerned about the world, they will typically need to buy US dollars in order to get involved in the bond market, which is exactly what we are seeing right now. If this continues, the US dollar will become a major issue for not only this currency, but most markets around the world to begin with.
Ready to start trading the EUR/USD daily analysis? Get our top rated Forex brokers list here.
Gold price is reversing a part of Wednesday’s correction from record highs of $2,759 early Thursday. Gold buyers draw support from a pause in the US Dollar (USD) advance, as the US Treasury bond yields rally takes a breather in the lead-up to the preliminary S&P Global US PMI data.
The minor pullback in the USD alongside the US Treasury bond yields could be attributed to a stabilizing market mood in Asia, following Wall Street’s tech sell-off overnight. US equity futures rebound amid a risk reset after investors breathed a sigh of relief on Tesla Inc.’s encouraging earnings report.
Tesla reported adjusted earnings of 72 cents per share for the quarter, above the average analyst estimate and snapping four consecutive quarters in which the measure missed expectations, per CNBC News. The company said its Cybertruck, which it first delivered late last year, has reached profitability for the first time,
The further upside in Gold price, however, remains at the mercy of the upcoming Euro area and the US preliminary business PMI data. Investors will seek cues on the health of the global economy, impacting risk sentiment and safe-havens such as the USD, Gold price, etc.
The US S&P Global preliminary Manufacturing PMI is seen ticking higher to 47.5 in October from September’s 47.3 while the Services PMI is set to edge a tad lower to 55.0 in the same period from 55.2 in September.
Meanwhile, the market’s nervousness ahead of key US earnings reports and the presidential election will also play its part in driving the sentiment around Gold price. Any potential decline in Gold price is likely to be bought into, as buyers could re-emerge on Gold’s safe-haven demand due to the November 5 US election and the ongoing Middle East conflict.
Gold price seems to be facing stiff resistance at $2,723, the 23.6% Fibonacci Retracement (Fibo) level of the latest record rally from the October 10 low of $2,604 to an all-time high of $2,759.
Acceptance above that level could encourage buyers to take on the $2,750 psychological barrier. The record high of $2,759 will be next on buyers’ radars.
The 14-day Relative Strength Index (RSI) is flattish but well above the 50 level, currently trading near 65.60, pointing to more upside momentum.
However, if Gold sellers jump back into the game, the 38.2% Fibo level of the same ascent at $2,700 will come to the rescue of buyers.
A sustained move below the latter will put the 50% Fibo support at $2,682 to the test.
The line in the sand for Gold optimists is aligned at the 21-day Simple Moving Average (SMA) at $2,670.
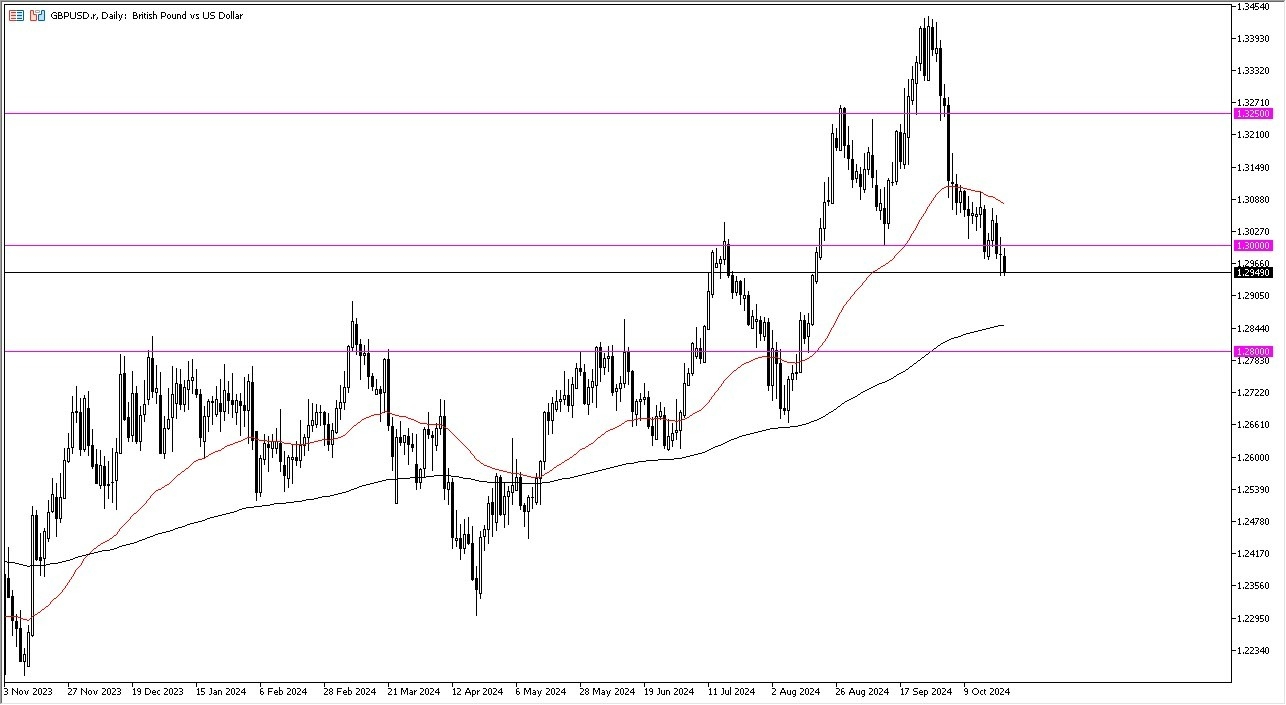
Now keep in mind that the Thursday session features PMI numbers coming out of multiple countries, including both of these, we will initially get the United Kingdom manufacturing and services PMI figures. But later in the day, we will also get the same coming out of the United States. If we turn around and rally from here, especially at the end of the day on Thursday, and break above the 1.30 level, it could be the beginning of a recovery.
The real test will be the 50 day EMA above that could cause a significant amount of resistance. If we break down from here, again, I think we go looking to the 200 day EMA and then eventually the 1.28 level. The market has seen rather massive selling. But when you look at the structure of the price action in the British pound, it looks very similar to a lot of other currency pairs, such as the Euro against the dollar, the Australian dollar against the US dollar, the New Zealand dollar against the US dollar, and so on. So this is clearly all about the US dollar and the fact that interest rates in America continue to rise. If that remains the same, the US dollar could very well swallow everything.
This has been the case for multiple times over the course of the year, and for the same reason, the fact that interest rates are rising in the United States. Now that the bond market is essentially telling the Federal Reserve that they are wrong, things could get rather ugly but also, we need to keep in mind that those PMI figures could cause a lot of noise.
Ready to trade our daily GBP/USD Forex analysis? Here are the best regulated trading platforms UK to choose from.
The USD/JPY extended its gains sharply during Wednesday in the North American session, sponsored by the close positive correlation with the US 10-year T-note yield, while traders remain concerned about US elections. At the time of writing, the pair exchanges hands at 152.60, up by more than 1%.
The USD/JPY rose above the Ichimoku Cloud (Kumo) and the 200-day Simple Moving Average (SMA), turning bullish for the first time since early August 2024.
Momentum clearly indicates that buyers are in charge, and targeting the 160.00 figure, once they cleared key technical levels. In addition, the Relative Strength Index (RSI) cleared the latest peak, meaning that further USD/JPY upside is seen.
The USD/JPY first resistance would be the 153.19 October 23 daily high, followed by the 154.00 mark. On further strength, the USD/JPY could challenge the July 30 peak at 155.21, before etending its gains to July 19 peak at 157.86.
For a bearish scenario, sellers must clear the 200-day SMA at 151.38, before pushing the exchange rate below the Tenkan-Sen at 150.79, and inside the Kumo at 150.70.
The table below shows the percentage change of Japanese Yen (JPY) against listed major currencies today. Japanese Yen was the strongest against the Australian Dollar.
| USD | EUR | GBP | JPY | CAD | AUD | NZD | CHF | |
|---|---|---|---|---|---|---|---|---|
| USD | 0.22% | 0.51% | 0.98% | 0.17% | 0.85% | 0.72% | 0.13% | |
| EUR | -0.22% | 0.30% | 0.74% | -0.04% | 0.65% | 0.51% | -0.08% | |
| GBP | -0.51% | -0.30% | 0.45% | -0.36% | 0.35% | 0.21% | -0.34% | |
| JPY | -0.98% | -0.74% | -0.45% | -0.80% | -0.12% | -0.19% | -0.79% | |
| CAD | -0.17% | 0.04% | 0.36% | 0.80% | 0.69% | 0.58% | 0.02% | |
| AUD | -0.85% | -0.65% | -0.35% | 0.12% | -0.69% | -0.11% | -0.69% | |
| NZD | -0.72% | -0.51% | -0.21% | 0.19% | -0.58% | 0.11% | -0.57% | |
| CHF | -0.13% | 0.08% | 0.34% | 0.79% | -0.02% | 0.69% | 0.57% |
The heat map shows percentage changes of major currencies against each other. The base currency is picked from the left column, while the quote currency is picked from the top row. For example, if you pick the Japanese Yen from the left column and move along the horizontal line to the US Dollar, the percentage change displayed in the box will represent JPY (base)/USD (quote).
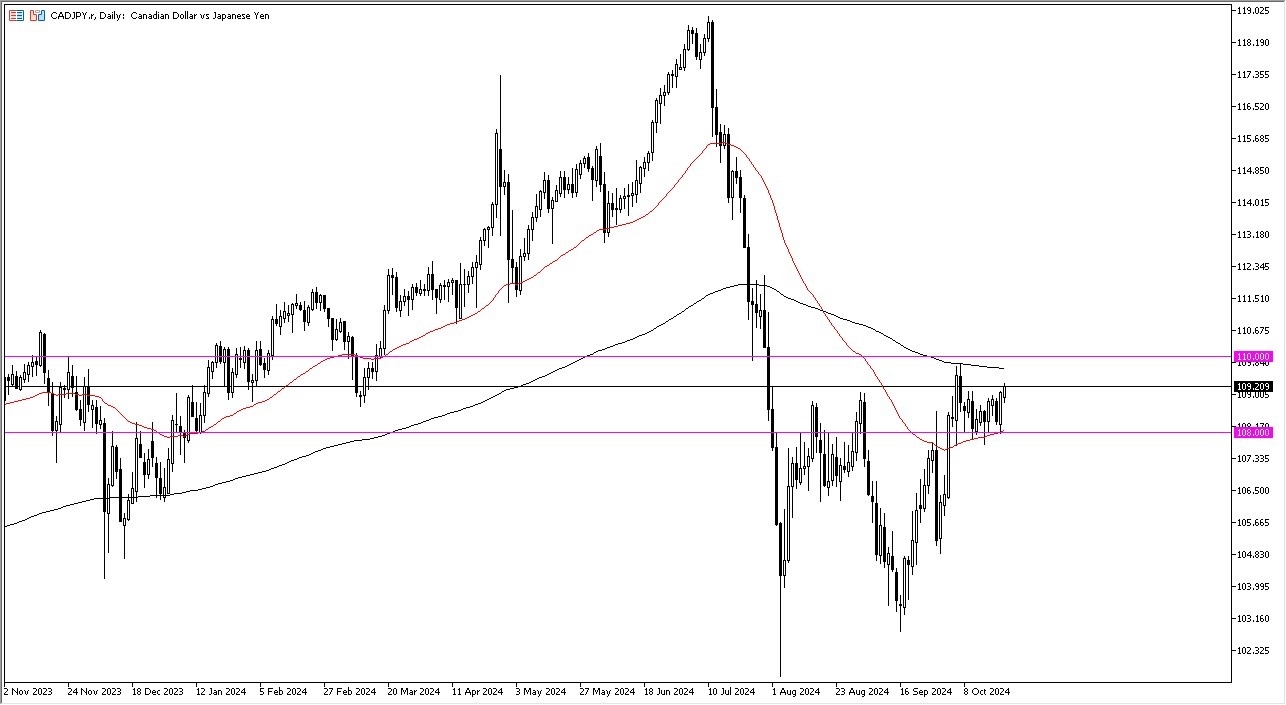
For example, if the Bank of Canada cuts 25 basis points, that could send this pair rocketing to the upside.
Furthermore, there’s the press conference and statement a little later, both of which have the potential to send the market in one direction or the other. So, I have the 110 yen level marked on the chart and the 108 yen level marked on the chart as well. I’m just simply waiting for this market to break out of this area to determine which way to go.
One thing is for sure, if the Bank of Canada decides to cut interest rates by 50 basis points and then suggests that they are done cutting, if the market believes them, that will send the CAD/JPY exchange pair higher due to the carry trade.
Furthermore, you have to pay attention to oil because this is a highly sensitive market to the oil markets as the Japanese have to import 100% of their petroleum. And of course, Canada is known as an exporter of crude oil. With that being the situation, this sets up as a very interesting potential trade.
I will be watching very closely, as this could be a situation where we are watching a big move set up, and potentially open the possibility of a bigger move that has some sustained momentum.
Ready to trade our Forex daily analysis and predictions? Here’s a list of regulated forex brokers to choose from.