The main category of Forex News.
You can use the search box below to find what you need.
[wd_asp id=1]
The main category of Forex News.
You can use the search box below to find what you need.
[wd_asp id=1]
Silver price hit new highest since November 2012 on Monday, in extension of last Friday’s record daily rally of 6.4%, with psychological $34.00 barrier being cracked.
Increased safe haven demand dragged silver price, as geopolitical situation is overheated and markets pricing around 90% chance of Fed rate cut in November FOMC policy meeting.
Strong bullish signal has been generated on monthly chart after bulls eventually broke above key barriers at $30.00/50 (psychological / 50% retracement of $49.78/$11.23, 2011/2020 downtrend) which where the price was stuck for four months.
Firmly bullish daily studies continue to contribute to positive structure, underpinned by favorable fundamentals.
The price is currently riding on extended fifth wave of five wave sequence from $26.39 (Aug 8 low) with FE 161.8% (33.89) being cracked.
Close above this level to verify fresh signal and open way for attack at next targets at $35.00/05 (psychological / Fibo 61.8% of $49.78/$11.23) and $35.369 (FE 200%).
Meanwhile, bulls may take a breather under these barriers as daily studies are overbought, with limited dips to be ideally contained above $32.20 zone and to offer better buying opportunities.
Res: 33.89; 34.26; 35.00; 35.36
Sup: 33.51; 32.95; 32.23; 32.00
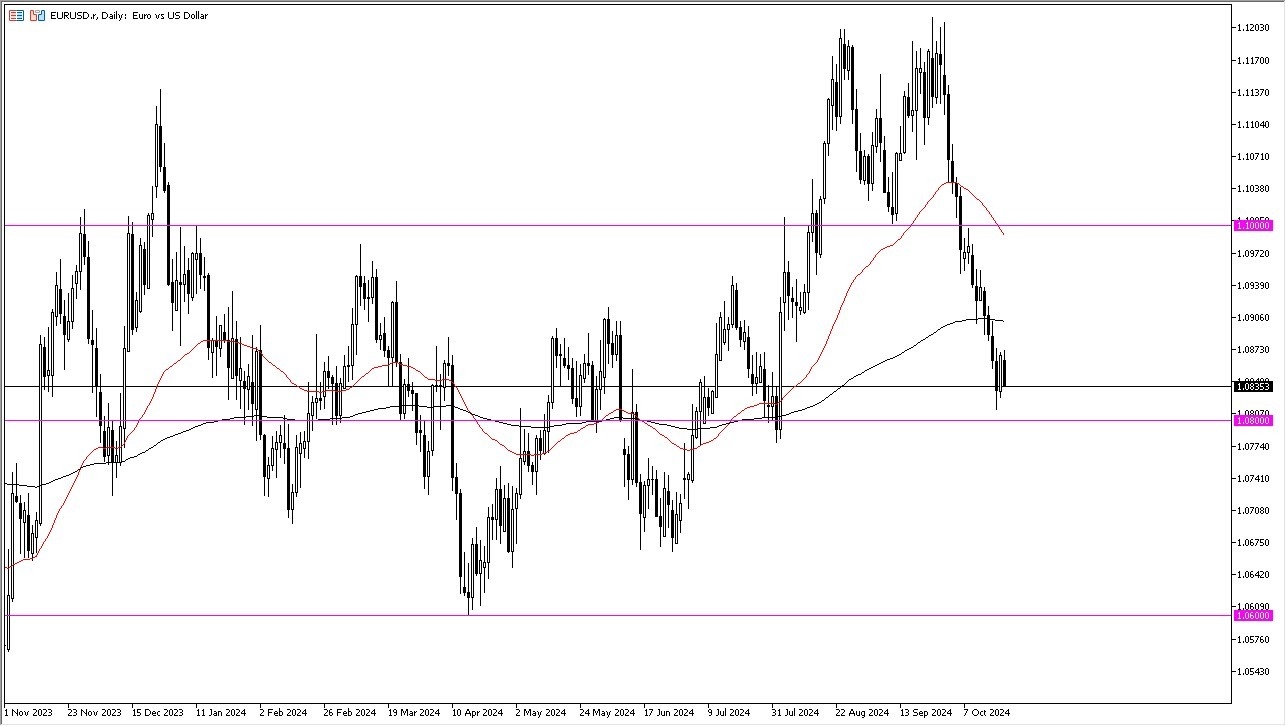
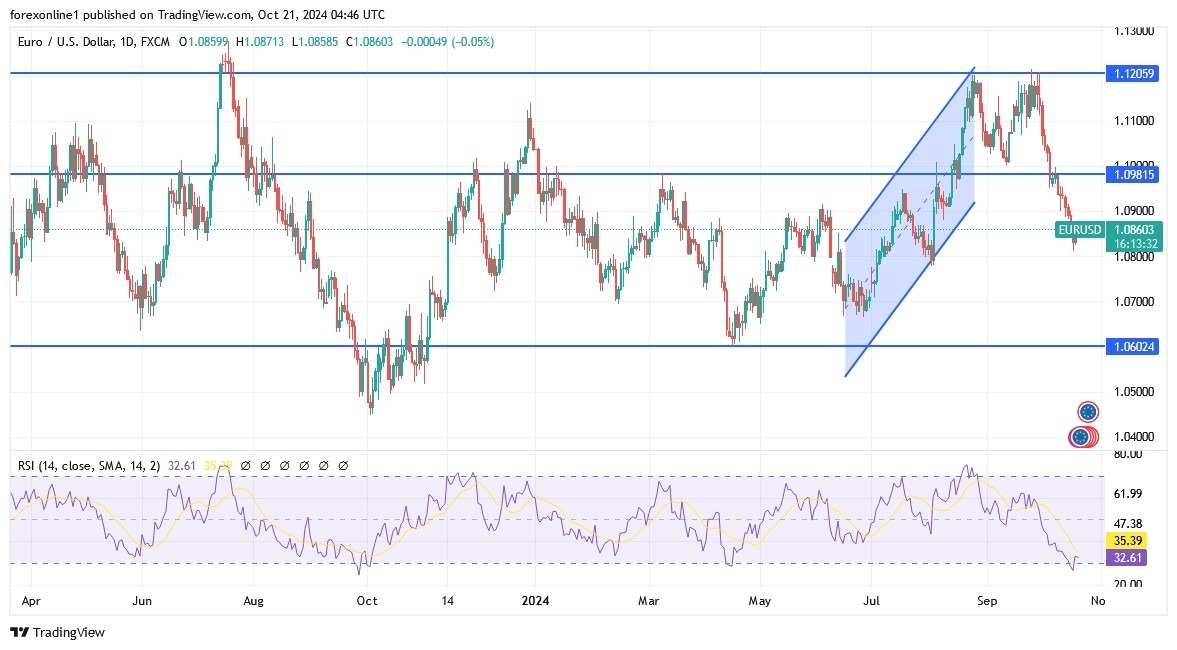
The 1.08 level underneath of course is a large round psychologically significant figure and that of course, I think, will have a certain amount of influence. We are currently below the 200 day EMA, but at this point, I think that the 1.08 level of course will continue to matter. And if we can turn around and bounce back to the upside, then I think it’s just more of the same working off the froth. The US dollar has exploded in value against the euro, and therefore the downtrend has been rather massive. If the market were to turn around and take out the 200 day EMA above, then I think it’s possible that we could go looking to the 1.10 level.

On the other hand, if we break down below the 1.08 level, perhaps closing on a daily candlestick underneath the 1.0775 level, then I think it opens up a move down to the 1.07 level, followed by the 1.06 level. This is a market that has got far too ahead of itself, so it does make a certain amount of sense. Therefore, I think you’ve got a situation where people are trying to sort out where they’re going next. But right now, I think it’s more or less trying to find stability and looking for that next catalyst. Yes, the Monday candlestick has been very ugly so far, but we haven’t broken through anything significant as far as support is concerned. So, I’m not sure how much this will change my analysis other than I think we still have some work to do before we make our next big move.
Ready to trade our EUR/USD Forex forecast? Here’s a list of some of the top forex brokers in Europe to check out.
Disclaimer: Opinions are our own and not financial or investment advice
A lot is written about gold and silver predictions, there is hardly any research on platinum predictions.
At jpost.com, we try to fill that gap by presenting readers with our platinum prediction research readout.
We look at the following topics in this article. Readers who are only interested in the specific platinum predictions for 2025, not in the research, may scroll down to the bottom to find our best case and base case platinum forecast 2025.
Platinum, a precious metal known for its luster and durability, is also a cornerstone of modern industry. Its unique properties and versatility make it indispensable in various applications.
Platinum, a precious metal often overshadowed by its more well-known counterparts, gold and silver, offers unique investment opportunities due to its distinct characteristics and market dynamics. As a component of a diversified portfolio, platinum can provide several advantages:
1. Diversification Benefits:
2. Precious Metals Synergy:
3. Long-Term Investment Potential:
4. Tactical Allocation Strategy:
5. Chart Analysis: A Long-Term Perspective
As we gain an understanding of the importance of having some exposure to physical platinum, we now pivot to platinum’s leading price indicators as well as intermarket dynamics.
Platinum, being one of the 4 precious metals, has a rather strong correlation with other precious metals, particularly gold and silver.
However, there are some specific things that investors should know about intermarket dynamics between platinum and the precious metals universe. This is critical, both from an investor perspective and also to set the expectations right for a platinum forecast for 2025.
The chart below, exhibiting all 4 precious metals, over a period of 30 years, helps us create a framework for a reasonable platinum prediction for 2025 and beyond.
Take-away – Platinum is expected to have a bullish bias in 2025 as gold’s bull market is now here to stay.
The platinum price chart will ultimately have the answers for a reasonable platinum price prediction in 2025.
The platinum market is consolidating around the $1,000 mark for nearly 8 years. That’s remarkable.
What’s even more remarkable is the obvious falling trendline combined with ultra strong support around $800 on the platinum chart. Anyone can spot this, no PhD needed.
Chart-wise, platinum is creating what is called a bullish triangle:
The bullish triangle on the platinum chart makes it very simple for investors – as long as $800 is respected, platinum is supposed to be working on a bullish resolution.
Now that is an important input into a 2025 platinum price prediction. Moreover, it looks also bright for investors that can exhibit patience.
Take-away – For as long as platinum respects support, the base case platinum prediction 2025 is a move to $1,200. Visibly, this chart suggests that whenever a breakout occurs, clearing the 16-year falling trendline, a quick move to $1,440 is the obvious outcome. Based on this chart, we consider $1,200 to be the base case platinum forecast for 2025, and $1,440 the best case prediction.
The platinum chart messages are clear – support at $800, first higher target $1,200 followed by $1,440 which where the real platinum market starts.
Now, let’s look at potential intermarket drivers, within the precious metals universe.
Based on our own research, it appears that platinum has the strongest correlation with silver.
The next chart, showing both platinum (candlesticks) and silver (line), over a period of 40 years, makes is it crystal clear – silver and platinum are strongly correlated.
What is absolutely crucial is the long term aspect of this intermarket dynamic – the chart shows a correlation over 40 years. Investors should not compare both silver and platinum on a day-by-day basis. Rather, it is a quarter-by-quarter comparison that should be applied to discover the correlation.
Essentially, the key question to resolve to understand whether intermarket dynamics will push platinum higher, is what silver will do.
This authority in silver forecasting has a high confidence level result from this research – silver is set to move higher in 2025. The research underpinning this bullish silver prediction is based on lots of data points, but it also considers a variety of angles.
Take-away – It is fair to say that silver is set to move higher, creating bullish intermarket dynamics for platinum. This increases confidence is a sustained move higher in platinum in the coming years. The $1,200 platinum price prediction for 2025 is rightfully a base case prediction, and the best case forecast of $1,440 is likely a reasonable platinum target either in 2025 or 2026, provided $800 holds strong.
Next up is the physical platinum market.
We consult World Platinum Investment Council (WPIC), a specialist in analyzing the physical platinum market.
Their latest research suggests that platinum is entering a period with supply deficit.
This should sound like music in the ears of smart investors, looking to pick up physical platinum at discounted prices, around $1,000.
Below is the platinum market prediction for 2025 and beyond, particularly physical demand and supply data, on aggregate level.
Visibly, 2023 and 2024 are pivotal years for platinum. Equally important is the adjusted forecast by the WPIC, as seen below, suggesting even tighter physical market conditions in 2025 and beyond (compared to their previous forecast).
It seems like there is a trend – a sustained supply deficit in the physical platinum market.
Now, let’s combine the data points we presented in this research:
All of the above are visible on the platinum price charts:
Because of this, it is fair to say that the $1,200 platinum price prediction for 2025 is a base case prediction, likely even a conservative prediction.
The best case platinum price forecast for 2025 and 2026 is $1,440 followed by $1,800.
So far, among financial institutions, only ANZ Research has published a platinum prediction for 2025. ANZ Research expects platinum to rise to $1,273/oz in 2025.
Their platinum prediction sits somewhere in-between our price targets, so it’s fair to say that it seems a rather conservative target, based on the data at hand at the time of writing.
Over time, we plan to add more platinum price predictions of financial institutions as more of them decide to publish their annual platinum forecast.
“Best Overall” by Money Magazine, Award-Winning for 6 Years, Thousands of 5-Star Rankings
Renowned for its exceptional customer service and commitment to transparency, Augusta Precious Metals has garnered numerous accolades, including “Best Overall” from Money magazine and “Most Transparent” from Investopedia. The company’s dedication to educating and supporting its clients has earned it top ratings from organizations such as A+ from BBB and AAA from BCA.

Industry leader with over $2 Billion in gold and silver. Top rated precious metals company with buy back guarantee
From precious metals iras to direct purchases of gold and silver, goldco have helped thousands of americans place over $2 billion in gold and silver. Top-rated precious metals company rated A+ by the better business bureau rated triple a by business consumer alliance earned over 6,000+ 5-star customer ratings Money.Com 2024 best customer service 2024 inc. 5000 regionals: pacific ranked #17 2024 gold stevie award, fastest growing company inc. 5000 award recipient, 8+ years

American Hartford Gold, ranked #1 Gold Company on Inc. 5000, boasts thousands of A+ BBB ratings and 5-star reviews, endorsed by Bill O’Reilly and Rick Harrison..
With over $2 billion in precious metals sold, American Hartford Gold helps individuals and families diversify and protect their wealth. Their expert team provides investors with the latest market insights and a historical perspective, ensuring informed decisions. Trusted by public figures and praised for exceptional customer service, the company offers competitive pricing on top-tier gold and silver coins, backed by a 100% customer satisfaction guarantee
Silver price (XAG/USD) jumps above $34.00 in Monday’s North American session for the first time in almost 12 years. The white metal strengthens on multiple tailwinds: continuing war between Israel and Iran, and growing uncertainty over United States (US) presidential elections.
Israel vowed to retaliate against Iran’s attack on October 1, as shown by leaked documents originating from the National Security Agency (NSA) and the Geospatial Intelligence Agency (GEOIN), which was authenticated by a US official, reported by The New York Times. The scenario of escalating geopolitical tensions improves the appeal of precious metals, such as Silver, as a safe haven.
The Silver’s safe-haven appeal has also been strengthened by neck-to-neck competition between US Vice President Kamala Harris and former US President Donald Trump for presidential elections on November 5.
Meanwhile, the US Dollar (USD) bounces back strongly after a mild correction on expectations that the Federal Reserve’s (Fed) policy-easing spell will be moderate in the remainder of the year. The US Dollar Index (DXY), which gauges the Greenback’s value against six major currencies, aims to recapture the 11-week high around 104.00.
Going forward, investors will pay close attention to the United States (US) flash S&P Global PMI data for October, which will be published on Thursday.
Silver price strengthens after a breakout above the horizontal resistance plotted from the May 21 high of $32.50 on a daily timeframe. Upward-sloping 20- and 50-day Exponential Moving Averages (EMAs) near $30.70 and $31.70, respectively, signals more upside ahead.
The 14-day Relative Strength Index (RSI) oscillates above 60.00, points to an active bullish momentum.
Silver is a precious metal highly traded among investors. It has been historically used as a store of value and a medium of exchange. Although less popular than Gold, traders may turn to Silver to diversify their investment portfolio, for its intrinsic value or as a potential hedge during high-inflation periods. Investors can buy physical Silver, in coins or in bars, or trade it through vehicles such as Exchange Traded Funds, which track its price on international markets.
Silver prices can move due to a wide range of factors. Geopolitical instability or fears of a deep recession can make Silver price escalate due to its safe-haven status, although to a lesser extent than Gold’s. As a yieldless asset, Silver tends to rise with lower interest rates. Its moves also depend on how the US Dollar (USD) behaves as the asset is priced in dollars (XAG/USD). A strong Dollar tends to keep the price of Silver at bay, whereas a weaker Dollar is likely to propel prices up. Other factors such as investment demand, mining supply – Silver is much more abundant than Gold – and recycling rates can also affect prices.
Silver is widely used in industry, particularly in sectors such as electronics or solar energy, as it has one of the highest electric conductivity of all metals – more than Copper and Gold. A surge in demand can increase prices, while a decline tends to lower them. Dynamics in the US, Chinese and Indian economies can also contribute to price swings: for the US and particularly China, their big industrial sectors use Silver in various processes; in India, consumers’ demand for the precious metal for jewellery also plays a key role in setting prices.
Silver prices tend to follow Gold’s moves. When Gold prices rise, Silver typically follows suit, as their status as safe-haven assets is similar. The Gold/Silver ratio, which shows the number of ounces of Silver needed to equal the value of one ounce of Gold, may help to determine the relative valuation between both metals. Some investors may consider a high ratio as an indicator that Silver is undervalued, or Gold is overvalued. On the contrary, a low ratio might suggest that Gold is undervalued relative to Silver.
The USD/JPY climbed in the mid-North American session on Monday, up by 0.62%. The pair printed a 12-week peak of 150.52, as US Treasury bond yields rose as traders trimmed odds that the Federal Reserve would embark on an aggressive easing cycle. At the time of writing, the pair fluctuates at around 150.50
The USD/JPY began the week on the front foot and extended its gains past 150.00. Momentum remains bullish as depicted by the Relative Strength Index (RSI), which is at the brisk of clearing the latest higher peak.
If USD/JPY clears the 100-day moving average (DMA) confluence and the top of the Ichimoku Cloud (Kumo) at 150.78, this could sponsor a leg-up towards the 200-DMA at 151.34. If cleared, buyers would eye 152.00.
Conversely, a daily close below 150.00 would pave the way for a pullback, exposing the Tenkan-Sen at 149.27. Once surpassed, key support levels would be exposed, like 149.00, followed by the Senkou Span at 147.16, before testing the 50-DMA at 145.55.
The table below shows the percentage change of Japanese Yen (JPY) against listed major currencies today. Japanese Yen was the strongest against the Australian Dollar.
| USD | EUR | GBP | JPY | CAD | AUD | NZD | CHF | |
|---|---|---|---|---|---|---|---|---|
| USD | 0.44% | 0.53% | 0.66% | 0.24% | 0.74% | 0.61% | 0.14% | |
| EUR | -0.44% | 0.01% | 0.15% | -0.15% | 0.26% | 0.06% | -0.38% | |
| GBP | -0.53% | -0.01% | 0.12% | -0.29% | 0.22% | 0.09% | -0.43% | |
| JPY | -0.66% | -0.15% | -0.12% | -0.43% | 0.07% | -0.01% | -0.57% | |
| CAD | -0.24% | 0.15% | 0.29% | 0.43% | 0.41% | 0.43% | -0.22% | |
| AUD | -0.74% | -0.26% | -0.22% | -0.07% | -0.41% | -0.05% | -0.66% | |
| NZD | -0.61% | -0.06% | -0.09% | 0.00% | -0.43% | 0.05% | -0.51% | |
| CHF | -0.14% | 0.38% | 0.43% | 0.57% | 0.22% | 0.66% | 0.51% |
The heat map shows percentage changes of major currencies against each other. The base currency is picked from the left column, while the quote currency is picked from the top row. For example, if you pick the Japanese Yen from the left column and move along the horizontal line to the US Dollar, the percentage change displayed in the box will represent JPY (base)/USD (quote).
Spot Gold keeps reaching record highs on a daily basis, trading as high as $2,740.42, before retreating after Wall Street’s opening. The US Dollar gathered momentum alongside government bond yields as looming United States (US) elections fuel demand for safe-haven assets. According to the latest Washington Post poll, Donald Trump, the Republican candidate and Kamala Harris, the Democratic one, are still virtually tied in the seven key states.
However, there are different polls showing that former President Trump outperforms Vice-president Harris in key matters such as the economy, inflation, and immigration. A Trump victory would mean quite a different scenario, with more taxes and restrictions that could negatively affect inflation and, hence, push the Federal Reserve (Fed) away from the current monetary loosening path. The uncertainty is high three weeks ahead of elections, explaining resurgent bonds demand.
In the meantime, escalating geopolitical tensions in the Middle East further support the USD. Israel launched airstrikes across Lebanon overnight, targeting Hezbollah’s financial operations, as reported by local authorities. Israeli Foreign Minister Israel Katz noted: “We will keep striking the Iranian proxy until it collapses,” cooling down hopes for a potential cease-fire.
From a technical point of view, the daily chart for XAU/USD shows the risk remains skewed to the upside. The pair develops above bullish moving averages, with the 20 Simple Moving Average (SMA) currently at around $2,660. The Momentum indicator lost its upward strength but holds near its October high, while the Relative Strength Index (RSI) indicator turned directionless at around 72, suggesting receding buying interest.
XAU/USD has corrected extreme overbought conditions in the near term. The 4-hour chart shows technical indicators turning flat after retreating from multi-week peaks, still holding well above their midlines and suggesting buyers have paused yet not given up. The 20 SMA, in the meantime, keeps advancing below the current level while above the 100 and 200 SMAs, in line with the dominant bullish trend.
Support levels: 2,716.40 2,700.00 2,685.45
Resistance levels: 2,740.00 2,755.00 2,770.00
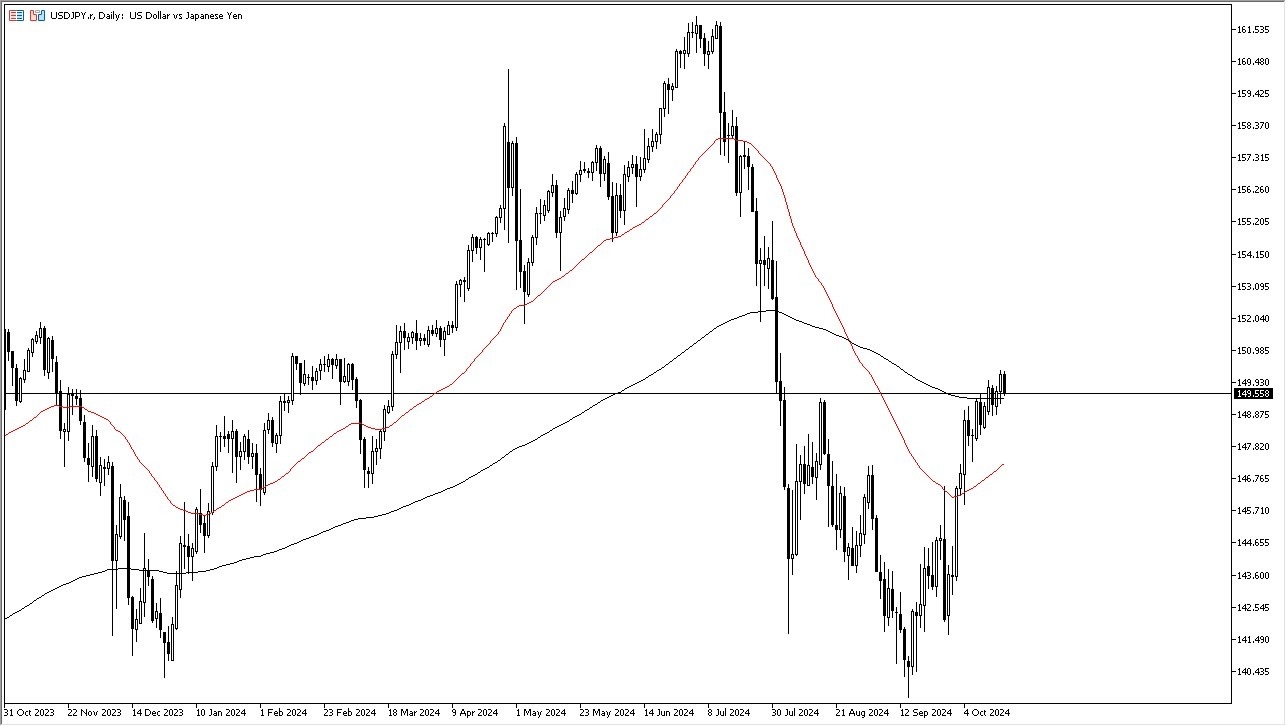
At this point in time, it’s worth noting that the Bank of Japan has readily admitted that they cannot raise interest rates anytime soon, so I think you’ve got a situation where it is probably a situation where we continue to see the Japanese yen punished, although it’s probably worth noting that the action on Friday certainly seem to be a bit of profit-taking and perhaps a little bit of exhaustion from the yen selling off.
At this point in time, we are above the 200 Day EMA, at least at the moment, and that of course would be a very bullish sign.
[graph_5755]
Furthermore, there are a lot of noisy areas underneath that should continue to offer value, and I think you have to look at this through the prism of whether or not we can find some type of momentum inducing fundamental noise to get the market moving.
If we do break to the upside, then I think it’s very likely that this pair could go looking to the ¥143 level.
If we pull back significantly from here, I think there is a lot of support to be found near the ¥147 level, which also features the 50 Day EMA approaching it and therefore I think technical traders would be interested in that region as well. In general, this is a market that I am a buyer of, and have no interest in shorting.
Ready to trade our daily forex forecast? Here are the best forex brokers in Japan to choose from.
| Coffee price forecast 20/10/2024: Increasing pressure from international market and domestic weather concerns Coffee price forecast 21/10/2024: Market fluctuates, positive sign for coffee growers |
According to experts, the increase in USD and the strong short buying volume on the two exchanges pushed up coffee prices. world has been decreasing continuously in recent weeks. This week, coffee continues to be under pressure from new crop supply in Vietnam. Domestically, many localities have entered the new crop coffee harvest.
Many experts predict that coffee prices on October 22, 10 will continue to increase slightly in many localities across the country. After the increase at the beginning of the week, domestic coffee prices are expected to continue to increase due to the influence of the world market and the stable trend of supply and demand.
Recorded in the trading session on October 21, 10, domestic coffee prices today increased by 2024 VND/kg to between 100 – 111.200. Currently, the average purchase price in the Central Highlands provinces is 111.800 VND/kg, the highest purchase price in the province Dak Nong is 111.8100 VND/kg.
Specifically, the coffee purchase price in the province Gia Lai (Chu Prong) is 111.600 VND stable compared to yesterday, in Pleiku and La Grai the same price is 111.500 VND/kg. In the province Kon Tum at 111.600 VND, unchanged from yesterday; In Dak Nong province, coffee was purchased at 111.800 VND/kg, an increase of 100 VND/kg compared to yesterday.
| Coffee price forecast October 22, 10: Will the slight upward trend continue? |
Price of green coffee beans (coffee beans, fresh coffee beans) in the province Lam Dong In districts such as Bao Loc, Di Linh, Lam Ha, coffee is purchased at 111.200 VND/kg, an increase of 100 VND/kg compared to yesterday.
Coffee prices today (April 21) in the province Dak LakIn Cu M’gar district, coffee is purchased at about 111.600 VND/kg, an increase of 100 VND/kg, while in Ea H’leo district and Buon Ho town, it is purchased at 111.500 VND/kg.
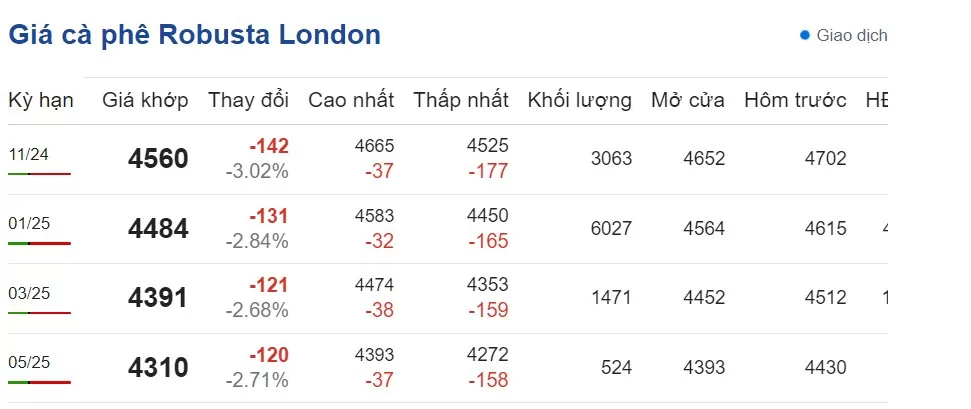
Updated world coffee prices at 20:00 p.m. on August 21, 10, Vietnam time on the London exchange, the price of Robusta coffee futures contract for delivery in September 2024 on the London floor is at 11 USD/ton, down 2024 USD compared to the beginning of the trading session.
 |
| London Robusta coffee price (Photo: Screenshot giacaphe.com |
The delivery term for January 1 is 2025 USD/ton, down 4.484 USD; the delivery term for March 131 is 3 USD/ton, down 2025 USD and the delivery term for May 4.391 is 121 USD/ton, down 5 USD.
 |
| New York Arabica coffee price (Photo: Screenshot from giacaphe.com) |
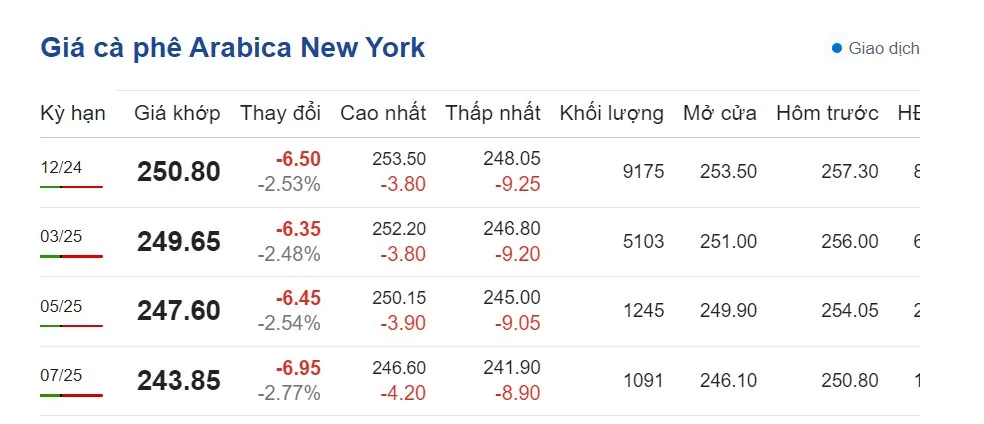
In particular, the price of Arabica coffee on the New York floor today at 20:00 p.m. on September 21, 10 decreased in all terms, fluctuating at 2024 – 243.85 cents/lb.
Specifically, the December 12 delivery period is 2024 cents/lb; down 250.80 cents/lb compared to the beginning of the session. The March 6.50 delivery period is 3 cents/lb, down 2025 cents/lb; the May 249.65 delivery period is 6.35 cents/lb, down 5 cents/lb and the July 2025 delivery period is 247.60 cents/lb, down 6.45 cents/lb.
 |
| Brazilian Arabica coffee price (Photo: Screenshot from giacaphe.com) |
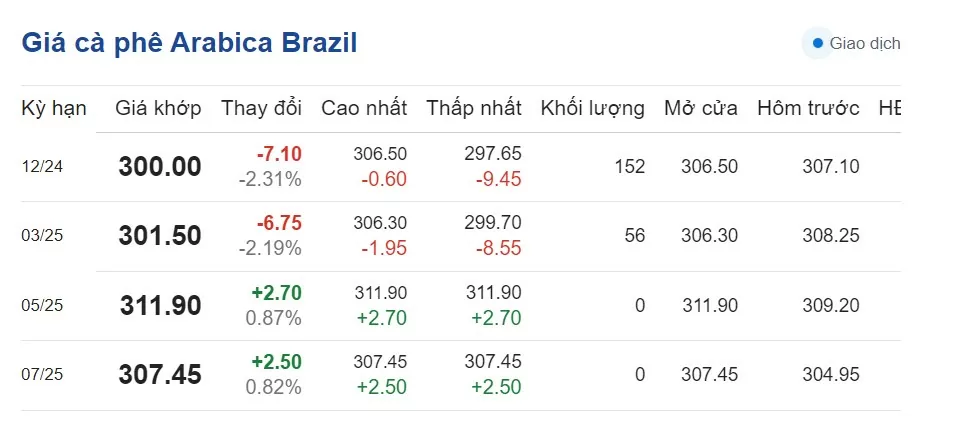
The price of Brazilian Arabica coffee today at 21:00 p.m. on September 21, 10 increased and decreased in opposite directions. Specifically, the delivery period for December 2024 is 12 USD/ton, down 2024%; the delivery period for March 300.00 is 2.31 USD/ton, down 3%; the delivery period for May 2025 is 301.50 USD/ton, up 2.19% and the delivery period for July 5 is 2025 USD/ton, up 311.90%.
Robusta coffee traded on ICE Futures Europe (London floor) opens at 16:00 and closes at 00:30 (the next day), Vietnam time.
Arabica coffee on the ICE Futures US floor (New York floor) opens at 16:15 p.m. and closes at 01:30 a.m. (the next day), Vietnam time.
Vietnam is gearing up for a new coffee harvest. However, according to a Reuters survey, Vietnam’s coffee output in the 2024-2025 crop year could fall by up to 10% due to the impact of the worst drought in a decade, which lasted from March to early May.
Nguyen Ngoc Quynh, Deputy General Director of the Vietnam Commodity Exchange, said that the drought had severely damaged coffee trees, leading to a sharp drop in output, even though rain returned in May.
Trinh Duc Minh, chairman of the Buon Ma Thuot Coffee Association, forecasts that coffee output in the 2024-2025 crop year could fall by 5,4%. Meanwhile, traders in Europe predict a smaller decline of about 3,4%, but still enough to raise concerns about a global robusta shortage.
*Information is for reference only, prices may vary depending on region and locality
Sources: https://congthuong.vn/du-bao-gia-ca-phe-ngay-22102024-xu-huong-tang-nhe-se-tiep-tuc-dien-ra-353810.html
The European Central Bank cut interest rates for the third time this year, indicating improved control over inflation but a deterioration in the economic outlook for the eurozone. In this regard, the comments of the European Central Bank President Christine Lagarde were interpreted as a downgrade of economic expectations, which prompted financial markets to price in a 25-basis point rate cut at each meeting until mid-2025. A 25-basis point rate cut is fully expected in December, with a 25% chance of a larger 50 basis point cut.
Conversely, strong US economic data has reduced expectations of interest rate cuts by the Federal Reserve.
In addition to the future of central bank policies and according to economic data results, in the United States, preliminary estimates of the S&P Global Purchasing Managers’ Indices will provide a first look at the performance of the private sector in October. Also, Durable goods orders are expected to decline by 0.9% in September, following a flat reading in August. Additionally, it will be interesting to follow existing and new home sales, final readings of the University of Michigan US Consumer Sentiment Index, and regional manufacturing indices including the Richmond Fed Manufacturing Index, the Chicago Fed National Activity Index, and the Kansas City Fed Manufacturing Index.
A number of US Federal Reserve officials are also scheduled to appear. On the corporate front, the earnings season will continue with major companies such as Tesla, Coca Cola, 3M, General Motors and Verizon releasing their quarterly reports.
In Europe, preliminary PMI estimates will provide key insights into economic performance for October. The eurozone is likely to see a continued contraction in manufacturing, while growth in the services sector is expected to accelerate modestly. In Germany, the manufacturing slowdown is set to deepen, with services growth slowing. France is expected to see a continued contraction in both sectors.
Meanwhile, Germany’s Ifo business climate index is expected to remain unchanged at an eight-month low in September, while French consumer confidence could decline. However, consumer sentiment in the eurozone is expected to improve, reaching its highest level since February 2022.
According to Forex Market, EUR/USD hit its lowest level since early August after the European Central Bank cut interest rates, hinting at further cuts due to a slowing economy. The decline was also driven by higher-than-consensus US retail sales, which widened the fundamental gap between the expectations facing the eurozone and the US.
Moreover, with the Relative Strength Index (RSI) now in oversold territory (as indicated by a reading below 30) and the October decline tracking the full extent of the August rally, it may be time to stay neutral. Technically, Near-term support lies at 1.0778, the low from early August. A deeper decline in a repeat of 2016 cannot be ruled out if US yields gain upward momentum after the presidential election.
Technically, EUR/USD has now broken below its 200-day moving average (DMA) – which represents a deterioration in the medium-term trend. It suggests that the exchange rate has entered a longer-term downtrend. At the same time, the 200-day moving average is also now acting as a resistance area for any subsequent recovery that may follow the exhaustion of the frenzied October sell-off.
Thus, although the decline may reach its limits in the short term, the prospects for a material recovery appear relatively limited at this stage.EUR/USD
Ready to trade our EUR/USD daily forecast? We’ve shortlisted the best forex broker list for you to check out.
GBP/USD stays under modest bearish pressure and declines toward 1.3000 to start the new week, after posting daily gains on Thursday and Friday. A daily close below 1.2960 could open the door for another leg lower.
The table below shows the percentage change of British Pound (GBP) against listed major currencies last 7 days. British Pound was the weakest against the US Dollar.
| USD | EUR | GBP | JPY | CAD | AUD | NZD | CHF | |
|---|---|---|---|---|---|---|---|---|
| USD | 0.76% | 0.37% | 0.54% | 0.31% | 0.88% | 0.74% | 0.97% | |
| EUR | -0.76% | -0.47% | -0.31% | -0.35% | 0.15% | -0.11% | 0.12% | |
| GBP | -0.37% | 0.47% | 0.14% | -0.03% | 0.65% | 0.37% | 0.56% | |
| JPY | -0.54% | 0.31% | -0.14% | -0.23% | 0.36% | 0.25% | 0.42% | |
| CAD | -0.31% | 0.35% | 0.03% | 0.23% | 0.52% | 0.46% | 0.47% | |
| AUD | -0.88% | -0.15% | -0.65% | -0.36% | -0.52% | -0.13% | 0.05% | |
| NZD | -0.74% | 0.11% | -0.37% | -0.25% | -0.46% | 0.13% | 0.16% | |
| CHF | -0.97% | -0.12% | -0.56% | -0.42% | -0.47% | -0.05% | -0.16% |
The heat map shows percentage changes of major currencies against each other. The base currency is picked from the left column, while the quote currency is picked from the top row. For example, if you pick the British Pound from the left column and move along the horizontal line to the US Dollar, the percentage change displayed in the box will represent GBP (base)/USD (quote).
Pound Sterling held its ground in the second half of the week as it managed to capture capital outflows out of the Euro. Additionally, the positive shift seen in risk mood helped GBP/USD edge higher heading into the weekend.
The cautious risk mood early Monday helps the US Dollar (USD) stay resilient against its rivals and forces GBP/USD to stay on the back foot. US stock index futures trade marginally lower on the day, although Wall Street’s main indexes registered gains on Friday.
The economic calendar will not feature any high-impact data releases on Monday. Hence, investors could continue to react to changes in risk perception. If major US equity indexes turn bearish after the opening bell, the USD could preserve its strength and make it difficult for GBP/USD to limit its losses.
On Tuesday, Bank of England (BoE) Governor Andrew Bailey will deliver a keynote address at the Bloomberg Global Regulatory Forum in New York. Later in the week, investors will scrutinize S&P Global’s preliminary October Manufacturing and Services Purchasing Managers Index (PMI) data for the UK and the US.
The Relative Strength Index (RSI) indicator on the 4-hour chart retreated below 50 after holding above this level in the second half of the previous week, reflecting buyers’ hesitancy to bet on an extended recovery.
On the downside, 1.2980 (static level) aligns as immediate support before 1.2960, where the 100-day Simple Moving Average (SMA) is located. A daily close below the latter could bring in additional technical sellers and pave the way for another leg lower toward 1.2900 (round level, static level).
Looking north, interim resistance could be spotted at 1.3050 (50-period SMA) before 1.3090-1.3100 (Fibonacci 23.6% retracement of the latest downtrend, static level) and 1.3140 (50- day SMA).
The Pound Sterling (GBP) is the oldest currency in the world (886 AD) and the official currency of the United Kingdom. It is the fourth most traded unit for foreign exchange (FX) in the world, accounting for 12% of all transactions, averaging $630 billion a day, according to 2022 data. Its key trading pairs are GBP/USD, also known as ‘Cable’, which accounts for 11% of FX, GBP/JPY, or the ‘Dragon’ as it is known by traders (3%), and EUR/GBP (2%). The Pound Sterling is issued by the Bank of England (BoE).
The single most important factor influencing the value of the Pound Sterling is monetary policy decided by the Bank of England. The BoE bases its decisions on whether it has achieved its primary goal of “price stability” – a steady inflation rate of around 2%. Its primary tool for achieving this is the adjustment of interest rates. When inflation is too high, the BoE will try to rein it in by raising interest rates, making it more expensive for people and businesses to access credit. This is generally positive for GBP, as higher interest rates make the UK a more attractive place for global investors to park their money. When inflation falls too low it is a sign economic growth is slowing. In this scenario, the BoE will consider lowering interest rates to cheapen credit so businesses will borrow more to invest in growth-generating projects.
Data releases gauge the health of the economy and can impact the value of the Pound Sterling. Indicators such as GDP, Manufacturing and Services PMIs, and employment can all influence the direction of the GBP. A strong economy is good for Sterling. Not only does it attract more foreign investment but it may encourage the BoE to put up interest rates, which will directly strengthen GBP. Otherwise, if economic data is weak, the Pound Sterling is likely to fall.
Another significant data release for the Pound Sterling is the Trade Balance. This indicator measures the difference between what a country earns from its exports and what it spends on imports over a given period. If a country produces highly sought-after exports, its currency will benefit purely from the extra demand created from foreign buyers seeking to purchase these goods. Therefore, a positive net Trade Balance strengthens a currency and vice versa for a negative balance.