The main category of Forex News.
You can use the search box below to find what you need.
[wd_asp id=1]
The main category of Forex News.
You can use the search box below to find what you need.
[wd_asp id=1]
EUR/USD trades on the back foot to start the week and stays in negative territory at around 1.0850 after closing in the green on Friday. The pair’s near-term technical outlook suggests that buyers remain reluctant to bet on an extended rebound.
The table below shows the percentage change of Euro (EUR) against listed major currencies last 7 days. Euro was the weakest against the US Dollar.
| USD | EUR | GBP | JPY | CAD | AUD | NZD | CHF | |
|---|---|---|---|---|---|---|---|---|
| USD | 0.79% | 0.34% | 0.49% | 0.33% | 0.88% | 0.71% | 0.97% | |
| EUR | -0.79% | -0.52% | -0.39% | -0.37% | 0.12% | -0.17% | 0.08% | |
| GBP | -0.34% | 0.52% | 0.12% | 0.02% | 0.68% | 0.38% | 0.58% | |
| JPY | -0.49% | 0.39% | -0.12% | -0.15% | 0.41% | 0.28% | 0.47% | |
| CAD | -0.33% | 0.37% | -0.02% | 0.15% | 0.49% | 0.40% | 0.46% | |
| AUD | -0.88% | -0.12% | -0.68% | -0.41% | -0.49% | -0.16% | 0.05% | |
| NZD | -0.71% | 0.17% | -0.38% | -0.28% | -0.40% | 0.16% | 0.19% | |
| CHF | -0.97% | -0.08% | -0.58% | -0.47% | -0.46% | -0.05% | -0.19% |
The heat map shows percentage changes of major currencies against each other. The base currency is picked from the left column, while the quote currency is picked from the top row. For example, if you pick the Euro from the left column and move along the horizontal line to the US Dollar, the percentage change displayed in the box will represent EUR (base)/USD (quote).
The improving risk mood heading into the weekend made it difficult for the US Dollar (USD) to preserve its strength and paved the way for a rebound in EUR/USD on Friday.
In the absence of high-tier data releases, dovish comments from European Central Bank (ECB) officials weigh on the Euro, causing EUR/USD to stretch lower on Monday.
ECB Governing Council member Gediminas Šimkus said on Monday that if disinflation gets entrenched, rates could get lower than the natural level. Meanwhile, ECB policymaker Martins Kazaks argued that interest rates are still inhibiting growth, adding that he expects rates to continue to decline as inflation falls further.
Later in the week, ECB President Christine Lagarde will be delivering speeches at different events. On Thursday, S&P Global will release preliminary October Manufacturing and Services Purchasing Managers Index (PMI) data for Germany, the Euro area and the US.
The Relative Strength Index (RSI) indicator on the 4-hour chart declines toward 40 after rising to the 50 area on Friday, suggesting that EUR/USD’s remains bearish in the near term following a technical correction.
On the downside, 1.0830 (static level) aligns as interim support before 1.0780 (beginning point of the latest uptrend) and 1.0740 (static level from April). Looking north, immediate resistance could be spotted at 1.0870 (Fibonacci 78.6% retracement of the latest uptrend) ahead of 1.0900 (static level, round level, 50-period Simple Moving Average). A daily close above the latter could attract technical buyers and open the door for another leg higher toward 1.0950 (Fibonacci 61.8% retracement).
The Euro is the currency for the 19 European Union countries that belong to the Eurozone. It is the second most heavily traded currency in the world behind the US Dollar. In 2022, it accounted for 31% of all foreign exchange transactions, with an average daily turnover of over $2.2 trillion a day. EUR/USD is the most heavily traded currency pair in the world, accounting for an estimated 30% off all transactions, followed by EUR/JPY (4%), EUR/GBP (3%) and EUR/AUD (2%).
The European Central Bank (ECB) in Frankfurt, Germany, is the reserve bank for the Eurozone. The ECB sets interest rates and manages monetary policy. The ECB’s primary mandate is to maintain price stability, which means either controlling inflation or stimulating growth. Its primary tool is the raising or lowering of interest rates. Relatively high interest rates – or the expectation of higher rates – will usually benefit the Euro and vice versa. The ECB Governing Council makes monetary policy decisions at meetings held eight times a year. Decisions are made by heads of the Eurozone national banks and six permanent members, including the President of the ECB, Christine Lagarde.
Eurozone inflation data, measured by the Harmonized Index of Consumer Prices (HICP), is an important econometric for the Euro. If inflation rises more than expected, especially if above the ECB’s 2% target, it obliges the ECB to raise interest rates to bring it back under control. Relatively high interest rates compared to its counterparts will usually benefit the Euro, as it makes the region more attractive as a place for global investors to park their money.
Data releases gauge the health of the economy and can impact on the Euro. Indicators such as GDP, Manufacturing and Services PMIs, employment, and consumer sentiment surveys can all influence the direction of the single currency. A strong economy is good for the Euro. Not only does it attract more foreign investment but it may encourage the ECB to put up interest rates, which will directly strengthen the Euro. Otherwise, if economic data is weak, the Euro is likely to fall. Economic data for the four largest economies in the euro area (Germany, France, Italy and Spain) are especially significant, as they account for 75% of the Eurozone’s economy.
Another significant data release for the Euro is the Trade Balance. This indicator measures the difference between what a country earns from its exports and what it spends on imports over a given period. If a country produces highly sought after exports then its currency will gain in value purely from the extra demand created from foreign buyers seeking to purchase these goods. Therefore, a positive net Trade Balance strengthens a currency and vice versa for a negative balance.
The gold price is holding the renewed upside near a fresh record high of $2,729 early Monday. Gold buyers take a breather amid rife Middle East tensions and the uncertainty around the US presidential election, awaiting a fresh trading impetus from the upcoming speeches from US Federal Reserve (Fed) policymakers.
The US Dollar (USD) maintains its corrective mode intact, tracking the renewed weakness in the US Treasury bond yields, as Chinese stocks recover ground after the People’s Bank of China (PBOC) delivered a bigger-than-expected cut to the one-year Loan Prime Rate (LPR) from 3.35% to 3.10%.
Markets were unimpressed in an initial reaction to the PBOC policy announcements but they now remain expectant of more stimulus coming in from China to support the economic growth. Meanwhile, China’s stimulus optimism alongside the persistent tensions between Israel and Iran kept the Gold price underpinned.
According to Lebanese media outlets, Israel carried out a new wave of air strikes on southern Beirut after it announced the targeting of Hezbollah’s al-Qard al-Hassan financial institution’s offices. Additionally, The US government has launched an investigation into the unauthorized release of classified documents detailing Israel’s military preparations for a potential strike on Iran. Investors prefer to flock to safety in the traditional safe-haven Gold price, in times of geopolitical turmoil.
However, the US Dollar could see resurgent demand on the revival of the ‘Trump rally’. Markets seem optimistic that Republican nominee Donald Trump will win the 2024 US presidential elections. Trump’s fiscal and trade policies are seen as inflationary and positive for the Greenback.
In the absence of top-tier US economic data releases due on Monday, the focus will remain on risk sentiment and the speeches from several Fed policymakers for a fresh directional impetus to Gold price.
Gold price challenged the $2,730 level on the renewed upside this Monday.
The 14-day Relative Strength Index (RSI) has turned flattish while holding above the 70 level – the overbought zone.
This suggests that buyers are facing exhaustion and that a pullback could be in the offing.
The immediate support, therefore, is seen at Friday’s low of $2,692, below which a drop toward the previous resistance now turned support at $2,670 cannot be ruled out.
A sustained break below that level will expose sellers to the key 21-day Simple Moving Average (SMA) support at $2,653.
On the other hand, if Gold buyers manage to take out the $2,730 round level, a test of the $2,750 psychological barrier will be inevitable.
Gold has played a key role in human’s history as it has been widely used as a store of value and medium of exchange. Currently, apart from its shine and usage for jewelry, the precious metal is widely seen as a safe-haven asset, meaning that it is considered a good investment during turbulent times. Gold is also widely seen as a hedge against inflation and against depreciating currencies as it doesn’t rely on any specific issuer or government.
Central banks are the biggest Gold holders. In their aim to support their currencies in turbulent times, central banks tend to diversify their reserves and buy Gold to improve the perceived strength of the economy and the currency. High Gold reserves can be a source of trust for a country’s solvency. Central banks added 1,136 tonnes of Gold worth around $70 billion to their reserves in 2022, according to data from the World Gold Council. This is the highest yearly purchase since records began. Central banks from emerging economies such as China, India and Turkey are quickly increasing their Gold reserves.
Gold has an inverse correlation with the US Dollar and US Treasuries, which are both major reserve and safe-haven assets. When the Dollar depreciates, Gold tends to rise, enabling investors and central banks to diversify their assets in turbulent times. Gold is also inversely correlated with risk assets. A rally in the stock market tends to weaken Gold price, while sell-offs in riskier markets tend to favor the precious metal.
The price can move due to a wide range of factors. Geopolitical instability or fears of a deep recession can quickly make Gold price escalate due to its safe-haven status. As a yield-less asset, Gold tends to rise with lower interest rates, while higher cost of money usually weighs down on the yellow metal. Still, most moves depend on how the US Dollar (USD) behaves as the asset is priced in dollars (XAU/USD). A strong Dollar tends to keep the price of Gold controlled, whereas a weaker Dollar is likely to push Gold prices up.
Silver price (XAG/USD) extends its winning streak for the fifth consecutive day, trading around $34.10 during the Asian session on Monday. This upward trend is driven by safe-haven demand amidst escalating geopolitical tensions in the Middle East.
Lebanese media report that Israel has launched a new series of airstrikes on southern Beirut, targeting the offices of Hezbollah’s al-Qard al-Hassan financial institution. Furthermore, the US government has initiated an investigation into the unauthorized release of classified documents that outline Israel’s military preparations for a potential strike on Iran.
Furthermore, easing monetary policies from major central banks are bolstering non-yielding Silver prices. On Monday, the People’s Bank of China (PBoC) reduced the 1-year Loan Prime Rate (LPR) from 3.35% to 3.10% and the 5-year LPR from 3.85% to 3.60%. Last week, the European Central Bank (ECB) also opted to cut its interest rates by 25 basis points.
The Bank of Canada (BoC) is widely anticipated to implement a significant interest rate cut of 50 basis points at its upcoming monetary policy meeting on Wednesday. Recent inflation data suggests that both the Bank of England (BoE) and the Reserve Bank of New Zealand (RBNZ) may consider potential rate cuts next month. Additionally, the US Federal Reserve (Fed) is expected to lower interest rates by 50 basis points by the end of 2024.
Regarding the US elections, markets appear optimistic about Republican nominee Donald Trump winning the 2024 presidential election. Trump’s fiscal and trade policies are viewed as inflationary and favorable for the US Dollar (USD), which could negatively impact Silver demand. A stronger US Dollar makes Silver more expensive for buyers using foreign currencies, potentially dampening their purchasing power.
Silver is a precious metal highly traded among investors. It has been historically used as a store of value and a medium of exchange. Although less popular than Gold, traders may turn to Silver to diversify their investment portfolio, for its intrinsic value or as a potential hedge during high-inflation periods. Investors can buy physical Silver, in coins or in bars, or trade it through vehicles such as Exchange Traded Funds, which track its price on international markets.
Silver prices can move due to a wide range of factors. Geopolitical instability or fears of a deep recession can make Silver price escalate due to its safe-haven status, although to a lesser extent than Gold’s. As a yieldless asset, Silver tends to rise with lower interest rates. Its moves also depend on how the US Dollar (USD) behaves as the asset is priced in dollars (XAG/USD). A strong Dollar tends to keep the price of Silver at bay, whereas a weaker Dollar is likely to propel prices up. Other factors such as investment demand, mining supply – Silver is much more abundant than Gold – and recycling rates can also affect prices.
Silver is widely used in industry, particularly in sectors such as electronics or solar energy, as it has one of the highest electric conductivity of all metals – more than Copper and Gold. A surge in demand can increase prices, while a decline tends to lower them. Dynamics in the US, Chinese and Indian economies can also contribute to price swings: for the US and particularly China, their big industrial sectors use Silver in various processes; in India, consumers’ demand for the precious metal for jewellery also plays a key role in setting prices.
Silver prices tend to follow Gold’s moves. When Gold prices rise, Silver typically follows suit, as their status as safe-haven assets is similar. The Gold/Silver ratio, which shows the number of ounces of Silver needed to equal the value of one ounce of Gold, may help to determine the relative valuation between both metals. Some investors may consider a high ratio as an indicator that Silver is undervalued, or Gold is overvalued. On the contrary, a low ratio might suggest that Gold is undervalued relative to Silver.
The Gold price (XAU/USD) extends its upside to around $2,720 during the early Asian session on Monday. The uncertainty surrounding tensions in the Middle East and the US presidential election boosts the safe haven flows.
The uptick in the precious metal is bolstered by ongoing geopolitical tensions in the Middle East, uncertainties around the US elections and easing monetary policy expectations from the US Federal Reserve (Fed). “With the conflict intensifying – particularly following Hezbollah’s announcement to escalate the war with Israel – investors are flocking to gold, a traditional safe-haven asset,” noted Alexander Zumpfe, a precious metals trader at Heraeus Metals Germany. “Adding to the momentum, concerns around the U.S. presidential election and anticipation of looser monetary policies have further fuelled the rally,” Zumpfe added.
Furthermore, the prospects of further Fed rate cuts continue to underpin the Gold price. The US central bank lowered its interest rates for the first time in more than four years in the September meeting. According to the CME FedWatch Tool, the odds of an additional quarter-point rate cut in November stand at more than 90%. Lower interest rates generally reduce the opportunity cost of holding non-yielding bullion, lifting the Gold price.
On the other hand, China’s sluggish economy could undermine the precious metal. China’s economy grew in the third quarter (Q3) at the slowest pace since early last year. The National Bureau of Statistics reported on Friday that the GDP expanded 4.6% YoY in Q3 versus 4.7% prior. This figure was below the government’s “around 5%” target for this year. This, in turn, might weigh on the yellow metal as China is the world’s largest gold consumer.
Gold has played a key role in human’s history as it has been widely used as a store of value and medium of exchange. Currently, apart from its shine and usage for jewelry, the precious metal is widely seen as a safe-haven asset, meaning that it is considered a good investment during turbulent times. Gold is also widely seen as a hedge against inflation and against depreciating currencies as it doesn’t rely on any specific issuer or government.
Central banks are the biggest Gold holders. In their aim to support their currencies in turbulent times, central banks tend to diversify their reserves and buy Gold to improve the perceived strength of the economy and the currency. High Gold reserves can be a source of trust for a country’s solvency. Central banks added 1,136 tonnes of Gold worth around $70 billion to their reserves in 2022, according to data from the World Gold Council. This is the highest yearly purchase since records began. Central banks from emerging economies such as China, India and Turkey are quickly increasing their Gold reserves.
Gold has an inverse correlation with the US Dollar and US Treasuries, which are both major reserve and safe-haven assets. When the Dollar depreciates, Gold tends to rise, enabling investors and central banks to diversify their assets in turbulent times. Gold is also inversely correlated with risk assets. A rally in the stock market tends to weaken Gold price, while sell-offs in riskier markets tend to favor the precious metal.
The price can move due to a wide range of factors. Geopolitical instability or fears of a deep recession can quickly make Gold price escalate due to its safe-haven status. As a yield-less asset, Gold tends to rise with lower interest rates, while higher cost of money usually weighs down on the yellow metal. Still, most moves depend on how the US Dollar (USD) behaves as the asset is priced in dollars (XAU/USD). A strong Dollar tends to keep the price of Gold controlled, whereas a weaker Dollar is likely to push Gold prices up.
STORY LINK Pound to Dollar Week Ahead Forecast: US Election Talk Dominates
ING expects the Pound to Dollar (GBP/USD) exchange rate will weaken to 1.28 in the short term.
During the week, GBP/USD dipped to 8-week lows around 1.2975 before a tentative recovery to 1.3030.
The November US election is looming large on investment bank commentary and forecasts.
ING sees further potential dollar demand; “With the election less than three weeks away, it looks like investors will be reluctant to position against such threats even though the election outcome remains very uncertain.”
Given the high degree of uncertainty, ING is unwilling to make a longer-term GBP/USD forecast.
Socgen outlined a potential recovery path; “above 1.3135 can lead to a larger bounce. In such scenario, GBP/USD is likely to head higher towards August high of 1.3270 and perhaps even towards recent peak around 1.3450/1.3480.”
Morgan Stanley forecasts GBP/USD gains to 1.34 by the second quarter of 2025.

MUFG added “The rising probability of Donald Trump winning the US election next month is likely contributing to the hawkish repricing of Fed rate cut expectations in the near-term and encouraging a stronger US dollar. According to PolyMarket, the probability of Donald Trump winning the election rose back above 60% yesterday and closer to levels prior to President Biden’s decision to drop out of the race to seek re-election.”
RBC commented on the potential election implications; “on the grounds that Trump’s proposed policies are more inflationary, the Trump/Red Congress combination should be the most USD positive, even if Trump and some of his closest advisors have advocated for weaker USD to boost competitiveness. Harris on the other hand is less likely to materially shift USD relative to the status quo, particularly if Congress is split.”
According to Rabobank; “we don’t expect cable to revisit its recent highs any time soon and see risk that the US election could open a little more downside potential for the currency pair.”
Expectations of US interest rate cuts have continued to fade.
MUFG commented; “the latest US retail sales report for September revealed that the US economy is continuing to grow more strongly than expected which has put a further dampener on market expectations for Fed rate cut expectations.
According to Morgan Stanley; “We think the labor market will remain solid and that sequential inflation will stay slightly above target for the rest of the year, a scenario aligned with a string of 25bp cuts, we believe.”
In contrast, the weaker than expected UK inflation data triggered speculation over a more aggressive Bank of England stance with two rate cuts before the end of 2024.
UK headline inflation declined more sharply than expected to a 3-year low of 1.7% from 2.2% previously with the core rate declining to 3.2% from 3.4% and below expectations of 3.4%.
According to ING; “the house view that the BoE base rate is cut from 5.00% to 3.25% by late next year – a view not priced by the markets. That’s why we’re mildly negative on GBP. Look for two more BoE cuts this year.”
International Money Transfer? Ask our resident FX expert a money transfer question or try John’s new, free, no-obligation personal service! ,where he helps every step of the way,
ensuring you get the best exchange rates on your currency requirements.
TAGS: Pound Dollar Forecasts
The GBP/USD weekly forecast shows a neutral bias as the US and UK economies show resilience. The price manages to close above 1.3000 handle.
The GBP/USD pair ended the week nearly flat amid economic reports from the UK and the US. Retail sales in both countries exceeded expectations, indicating robust consumer spending. Meanwhile, UK inflation eased more than expected to reach 1.7%, below the Bank of England’s target. Market participants are betting on a rate cut in November.
–Are you interested to learn more about Australian forex brokers? Check our detailed guide-
Elsewhere, the greenback firmed as markets increasingly bet on a Trump win in November. Such an outcome would likely increase inflation and pause the Fed’s rate-cycle, boosting the dollar.
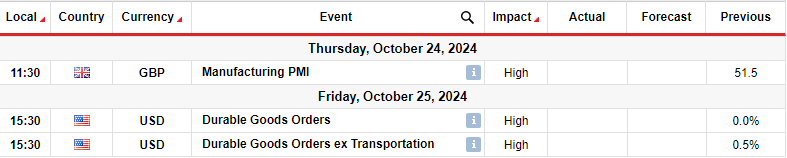
Next week, the UK will release data on business activity in the manufacturing sector. At the same time, traders will focus on US durable goods orders.
The previous reading revealed that the UK manufacturing sector is in expansion. A better-than-expected reading on Thursday will likely lower the chances of a Bank of England rate cut in November. The opposite is also true.
Meanwhile, inflation in the UK has fallen below the central bank’s target at 1.7%. At the same time, service inflation has fallen. Therefore, policymakers might be more willing to cut rates.
Meanwhile, the US durable goods orders will show the state of demand, impacting Fed rate cut expectations.
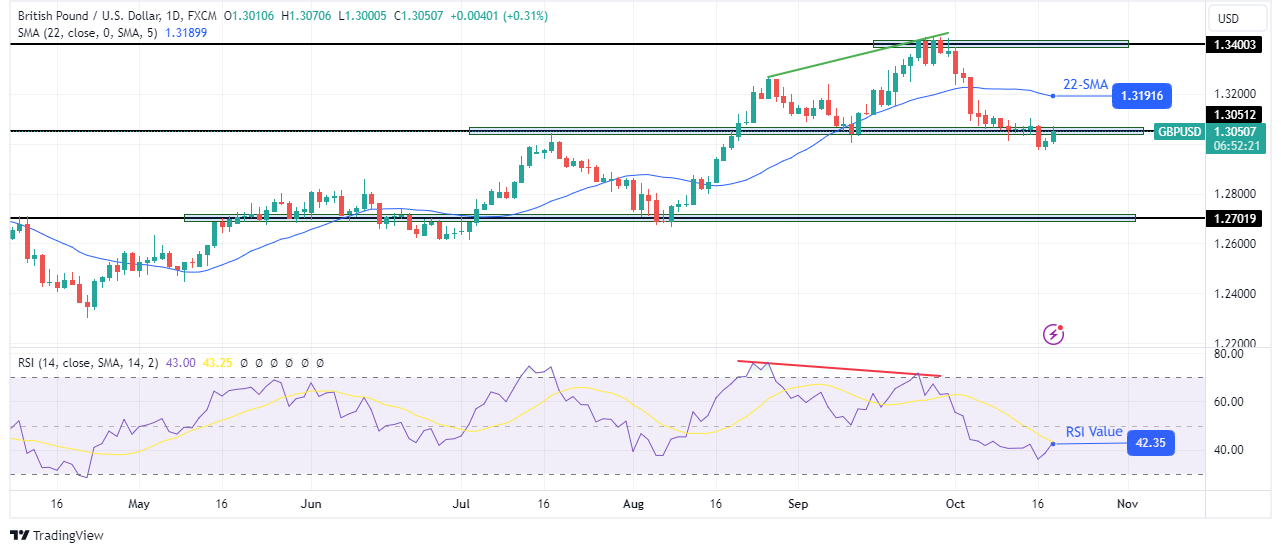
On the technical side, the GBP/USD price is retesting the 1.3051 after recently breaking below. Bears have taken the lead after the price reversed at the 1.3400 key resistance level. A bearish RSI divergence was the first sign of trouble for the previous bullish trend. Soon after, bears breached the 30-SMA support while the RSI dropped below 50, into bearish territory.
If you are interested in guaranteed stop-loss forex brokers, check our detailed guide-
However, the price must now detach from the 1.3051 level to continue the downtrend. Before this happens, bulls might challenge the 22-SMA. A break above the SMA would return GBP/USD to the high at 1.3400. On the other hand, if the SMA holds or the price immediately collapses, bears will target the 1.2701 support level.
Looking to trade forex now? Invest at eToro!
67% of retail investor accounts lose money when trading CFDs with this provider. You should consider whether you can afford to take the high risk of losing your money.
The coffee market has been experiencing complex fluctuations in recent days, with both supporting and negative factors affecting prices. In that context, the forecast of coffee prices tomorrow, October 20, 10, is attracting the attention of investors and farmers. Below is reference information about the market situation and forecast of coffee prices tomorrow, and at the same time, comments on price prospects in the coming time.
At the end of the trading session on October 19, 10, Robusta coffee prices on the London floor increased sharply, with an increase from 2024 USD/ton to 17 USD/ton. This shows that the demand for Robusta coffee is increasing in the international market, especially from the Chinese market and European countries. Arabica coffee prices on the New York floor also recorded a significant increase in the trading session on October 26, 19, with an increase from 10% to 2024%, reflecting the general optimism about the demand for Arabica coffee.
| Coffee price forecast October 20, 10: Increasing pressure from international markets and domestic weather concerns. |
However, Brazilian Arabica coffee prices recorded mixed increases and decreases, with December 12 and March 2024 delivery terms decreasing, while May 3 and July 2025 delivery terms increasing. This shows the differentiation in demand for Brazilian Arabica coffee, possibly due to weather factors or trade policies.
Meanwhile, the domestic coffee market has been moving in the opposite direction to the international market. On October 19, 10, domestic coffee prices fell sharply, with an average decrease of VND 2024/kg. The main reason is believed to be the impact of the weather. Information from the Department of Industry and Trade Gia Lai said that continuous rain is expected to hit the Central Highlands this weekend and into the new week, which could affect the progress of the new coffee harvest. This is the time when the largest producer of Robusta coffee world The new coffee harvest is scheduled to start between October 10 and September 2024. Traditionally, people expect rain to stop around this time to facilitate harvesting.
In addition to weather factors, domestic coffee prices are also affected by policy. The Council of the European Union has announced an agreement to postpone the implementation date of the European Union Deforestation Regulation (EUDR). This could put pressure on coffee prices in the long term, as the EUDR will require coffee exporters to prove that their coffee has not been linked to deforestation.
Based on the above analysis, it can be predicted that Robusta coffee prices will continue to increase slightly tomorrow, October 20, 10, due to high demand and the market’s expectation of a delay in the implementation of the EUDR. Arabica coffee prices may also increase slightly, but the increase will be lower than that of Robusta. However, due to the impact of rain, domestic coffee prices may decrease slightly tomorrow, but the decrease will not be significant.
However, it should be noted that coffee price forecasts are for reference only and may change depending on market developments. Investors and farmers should closely monitor information on the coffee market to make appropriate investment decisions.
In the coming time, the coffee market will continue to face many challenges and opportunities. Global coffee consumption is expected to continue to increase, due to the economic development of emerging countries and the increasing popularity of coffee consumption. However, the market also faces risks from climate change, epidemics and trade policies.
To ensure stability and sustainable development for the coffee market, coffee producing countries need to coordinate with each other to respond to challenges and maximize opportunities. Investors and farmers need to proactively update market information and develop appropriate business strategies.
*Information for reference only.
Sources: https://congthuong.vn/du-bao-gia-ca-phe-20102024-ap-luc-tang-tu-thi-truong-quoc-te-va-lo-ngai-ve-thoi-tiet-trong-nuoc-353501.html
Most Read: S&P 500, Nasdaq 100 – Wall Street Indexes Rise as TSMC Leads Chip Stock Rally, Where to Next?
Gold prices advanced further overnight gaining acceptance above the $2700/oz as global rate cut bets intensified. The killing of Hamas Political Bureau leader and of the masterminds behind the October 7 attacks Yahya Sinwar had raised expectations of an escalation in the Middle East conflict, but the precious metal was already well on its way to fresh highs.
Currently, a mix of factors is fueling the gold rally. Despite the strengthening US dollar, gold prices continue to climb. Economic data from the UK and the ECB’s interest rate meeting have boosted expectations for rate cuts worldwide, enhancing gold’s attractiveness. Lower global interest rates reduce the opportunity cost of holding this non-yielding precious metal and could keep the rally moving forward.
A bullish take from the London Bullion Market Association who conducted a poll recently further adds credence to the idea that Gold prices may not be done just yet. The poll was to predict the price of Gold in 12 months time with the association seeing prices at $2941/oz.
The US election is nearing as well and uncertainty continues around the next US President. This could be another reason the appeal of safe haven continues to grow.
From a technical analysis standpoint, Gold has been difficult to analyze with the lack of price action.
Gold bears may have been hoping for some headwinds from US data but that has not materialized as housing data disappointed. This has led to some USD weakness, which in theory should aid Gold prices. .
The concern for bulls lies in the fact that the RSI is now in overbought territory on the four-hour, daily and weekly charts. That coupled with the potential for profit taking before the end of the day leaves me slightly concerned. However, the threat of a retaliatory strike by Israel on Iran has strengthened as Israeli officials commented today a strike is imminent. This is something that could limit downside ahead of the weekend and into next week as well.
Immediate support rests at 2700 before the 2685 and 2673 handles come into focus.
Conversely, looking at the upside and immediate resistance rests at today’s high print around 2717 before 2725 and 2750 come into focus.
GOLD (XAU/USD) Four-Hour (H4) Chart, October 18, 2024
Source: TradingView (click to enlarge)
Support
Resistance
Follow Zain on Twitter/X for Additional Market News and Insights @zvawda
Content is for general information purposes only. It is not investment advice or a solution to buy or sell securities. Opinions are the authors; not necessarily that of OANDA Business Information & Services, Inc. or any of its affiliates, subsidiaries, officers or directors. If you would like to reproduce or redistribute any of the content found on MarketPulse, an award winning forex, commodities and global indices analysis and news site service produced by OANDA Business Information & Services, Inc., please access the RSS feed or contact us at info@marketpulse.com. Visit https://www.marketpulse.com/ to find out more about the beat of the global markets. © 2023 OANDA Business Information & Services Inc.
The 200-Day MA was reclaimed on September 11, leading to a sharp rally to the 3.02 swing high, which is also the top of a large symmetrical triangle pattern. Subsequently, the current decline is the first real test of support around the 200-Day MA since the upside breakout. There was a brief test shortly after the breakout, but this test of support at the 200-Day line takes on a greater significance.
Given that natural gas has fallen hard, down by as much as 0.76 points or 25.4% from the 3.02 high, as of today’s low, it may yet break below the 200-Day line. Further, there has been barely a retracement during the decline. There has been only one day out of ten that natural gas has not had a lower daily low and lower high on the way down. This clearly shows sellers in charge, and they may yet stay in charge.
If the 200-Day line is broken to the downside, the 78.6% retracement at 1.92 is next in line as a lower target. Also, the internal uptrend line, which is the lower line of the triangle pattern, needs to be considered as well, if it is eventually approached. Given that resistance was seen at the top of the consolidation pattern, a full swing to test support around the lower boundary of the pattern could yet occur before the decline is complete.
Although the 200-Day MA may not be as reliable of an indicator when inside a larger consolidation pattern, the market did recognize the 200-Day line specifically as support following the September 11 bull breakout. And there have been relatively wide price swings inside the triangle pattern given its large size. Bullish momentum accelerated following the initial test of support on September 19.
For a look at all of today’s economic events, check out our economic calendar.
The US dollar (DXY) is pulling back today, but what does that mean for pairs like EURUSD, GBPUSD, and USDJPY next week?
Find out in today’s weekly forex forecast for the week ending October 25, 2024.
The DXY is pulling back slightly today, but US dollar bulls remain in control following the 102.60 reclaim this month.
The October 9th close above 102.60 signaled a significant turning point for the USD.
It put the dollar index back inside of its 2023 ascending channel, and a well-established horizontal area from August of last year.
The DXY also reclaimed the 103.00 to 103.30 area this week, flipping it back to key support.
However, dollar bulls face a monumental challenge next week in the 104.00 to 104.50 region.
Although we’ll likely get a pullback from there, I’d be careful to expect much dollar weakness this year while areas like 103.00 and 102.60 are holding as support.
The EURUSD has played out nicely for us this month following the close below 1.1110 and the 1.1000 breakdown
Turning bearish on the euro was straightforward after the DXY’s break above levels like 102.00 and especially 102.60
However, Friday’s session is threatening to close back above the 1.0840 pivot, which could offer some relief next week
That said, the EURUSD would need to secure a daily close above that level to expose 1.0900
As long as the DXY is above 103.00 and 102.60, I favor looking for EURUSD shorts at resistance with a target in the 1.0800 range

GBPUSD has been more challenging to trade than its euro counterpart due to the choppy price action this month
However, the failure to hold above 1.3200-1.3250 at the beginning of the month signals a potentially significant turning point for the pound
That was the first weekly break of structure since the rally began in April
As mentioned earlier in the week, 1.3050 has flipped to resistance for GBPUSD, with support coming in at 1.2900
There’s also a daily imbalance in the 1.2900 region based on the August 16th candle

USDJPY has been relatively choppy this week despite continuing the rally that began in September
However, the recent break above levels like 146.50 has opened up resistance levels like 151.00 to 152.00
Given today’s price action from USDJPY and even the DXY, I would expect a pullback early next week
One area to watch is 148.50, with a failure there opening up 146.50
Remember that the 151.00 to 152.00 area will attract significant selling pressure if tested