The main category of Forex News.
You can use the search box below to find what you need.
[wd_asp id=1]
The main category of Forex News.
You can use the search box below to find what you need.
[wd_asp id=1]
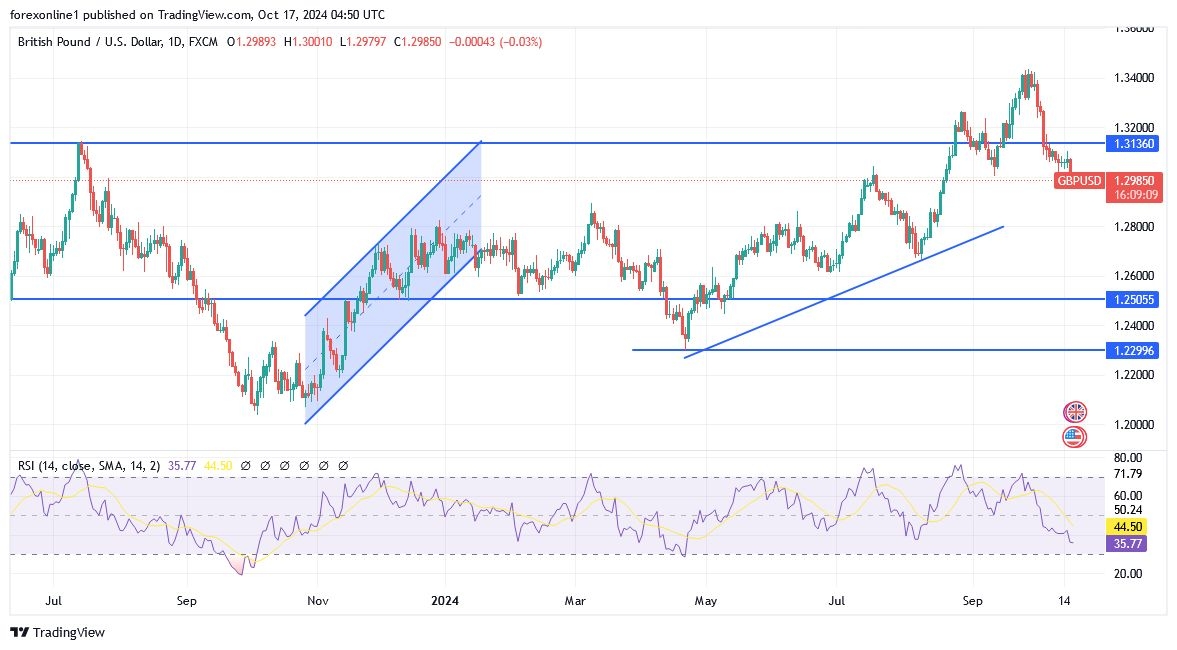
The psychological support level of 1.30 for GBP/USD is closely watched by analysts and market participants as an important level. However, analysts believe that sellers will emerge strongly and enter selling trades if 1.30 gives way. In this regard, JP Morgan’s trading desk says, “Through the 1.30 support, the next level of interest is the 100D (moving average) at 1.2950 and then the 1.2820/50 support range would be a fare initial target.”

According to Forex Market Trading, the pound fell against the dollar, the euro and all of its G10 peers after the UK headline inflation rate fell to 1.7% year-on-year in September. Meanwhile, the Bank of England’s inflation rate fell from 5.6% to 4.9%. Accordingly, Robert Howard, market analyst at Reuters, said: “The pound could extend lower towards the 1.28 support if the UK inflation data is cooler than expected, as this would raise the risk of two BoE rate cuts before Christmas.”
Now, 25 basis point cuts are fully priced in for the November 07 Bank of England interest rate meeting, with a 70% chance of another 25-basis point cut now priced in for December. Nick Andrews, chief FX analyst at HSBC, says, “However, the Bank of England’s endpoint is still relatively high at 3.51%, which means that GBP-USD could weaken in the coming months.”
Joe Maher, Associate Economist at Capital Economics, said, “We expect the pound to weaken by around 4% against the euro and around 1% against the US dollar by the end of 2025. We expect the yield gaps to move against the pound, especially against the euro, over the next year. Accordingly, we believe that the Bank of England will cut interest rates by much more than what is currently being discounted in the financial markets.
Based on the daily chart performance attached, the overall downward trend of the GBP/USD pair is gaining strength. As mentioned earlier, a move below the psychological support level of 1.3000 will confirm the bears’ strong control of the trend and signal a stronger downward move, especially if the US dollar gains additional positive momentum from today’s US retail sales and weekly jobless claims figures. If this happens, the next support levels will be 1.2920 and 1.2840, respectively. Furthermore, these levels are sufficient to push technical indicators towards oversold levels. Conversely, the first break of the current trend requires stabilization above the resistance level of 1.3160.
Ready to trade our GBP/USD weekly forecast? Here’s a list of some of the top forex brokers UK to check out.
Silver’s price extended its gains to three straight days yet remains below the $32.00 figure as US Treasury yields cap the grey metal’s advance. This, along with a buoyant US Dollar, didn’t deter the precious metal from advancing higher, and it consolidated at around the higher bound of the $31.50/$31.90 range. The XAG/USD trades at $31.90, above its opening price by 0.80%.
After plunging almost vertically from a year-to-date (YTD) peak of $32.95 to $30.12 within three days, the non-yielding metal is now recovering, with buyers targeting a potential test of the $33.00 level.
Silver’s recovery from plunging almost vertically from a year-to-date (YTD) peak of $32.95 to $30.12 within three days continued on Thursday. Momentum hints at buyers gathering steam, as depicted by the Relative Strength Index (RSI). Hence, the XAG/USD path of least resistance is tilted to the upside.
That said, the first resistance would be the $32.00 figure, followed by the October 16 high at $32.17. Once those levels are surpassed, the next stop would be the May 20 swing high at $32.51 before challenging the YTD high at $32.95.
Conversely, if XAG/USD slips below $31.37, Silver could drop to the weekly low of $30.76. If surpassed, this would clear the path to challenge October’s 8 low of $30.12.
Silver is a precious metal highly traded among investors. It has been historically used as a store of value and a medium of exchange. Although less popular than Gold, traders may turn to Silver to diversify their investment portfolio, for its intrinsic value or as a potential hedge during high-inflation periods. Investors can buy physical Silver, in coins or in bars, or trade it through vehicles such as Exchange Traded Funds, which track its price on international markets.
Silver prices can move due to a wide range of factors. Geopolitical instability or fears of a deep recession can make Silver price escalate due to its safe-haven status, although to a lesser extent than Gold’s. As a yieldless asset, Silver tends to rise with lower interest rates. Its moves also depend on how the US Dollar (USD) behaves as the asset is priced in dollars (XAG/USD). A strong Dollar tends to keep the price of Silver at bay, whereas a weaker Dollar is likely to propel prices up. Other factors such as investment demand, mining supply – Silver is much more abundant than Gold – and recycling rates can also affect prices.
Silver is widely used in industry, particularly in sectors such as electronics or solar energy, as it has one of the highest electric conductivity of all metals – more than Copper and Gold. A surge in demand can increase prices, while a decline tends to lower them. Dynamics in the US, Chinese and Indian economies can also contribute to price swings: for the US and particularly China, their big industrial sectors use Silver in various processes; in India, consumers’ demand for the precious metal for jewellery also plays a key role in setting prices.
Silver prices tend to follow Gold’s moves. When Gold prices rise, Silver typically follows suit, as their status as safe-haven assets is similar. The Gold/Silver ratio, which shows the number of ounces of Silver needed to equal the value of one ounce of Gold, may help to determine the relative valuation between both metals. Some investors may consider a high ratio as an indicator that Silver is undervalued, or Gold is overvalued. On the contrary, a low ratio might suggest that Gold is undervalued relative to Silver.
“For me, the most beautiful word in the dictionary is ‘tariff.’”
He wants to impose a 60% tax on imports from China and a flat 10% fee on the rest of the world. Economists say that raising the cost of imports will have a negative impact, raising domestic retail prices. In this regard, Tom Kenny, senior international economist at ANZ Bank, says, “The proposed 10-20% increase in tariffs across the board has the potential to be inflationary.”
“Tariffs tend to be inflationary, which would boost the value of the US dollar, and that’s why we expect the US dollar to be stronger in the first months of a Trump presidency compared to a Harris presidency,” Rabobank said. However, it warned that tariffs could eventually reduce productivity and growth potential. Furthermore, inflationary tariffs mean the Federal Reserve will need to exercise more caution in cutting US interest rates.
Trump’s response? Convince the Fed that it needs to cut rates anyway.
In his interview with Bloomberg, Trump indicated that he seeks greater influence at the Federal Reserve. However, he did not have a direct response to a question about whether he would seek to fire Fed Chairman Jerome Powell. He said he believes it is up to the president to tell the Fed chairman how he thinks interest rates should be changed. He added, “If you’re a very good president and you have common sense, you should be able to at least talk to him,”.
However, Trump stressed that the president should not be able to dictate policy to the Fed.
According to stock trading platforms, European stocks declined amid weak earnings. European stocks closed sharply lower on Wednesday, continuing the previous session’s losses amid pessimistic earnings from the eurozone’s largest companies. The Stoxx 50 index for the single currency area fell 0.7% to 4911, and the Stoxx 600 European index fell 0.2% to 520, with the latter supported by positive UK inflation. Also, ASML shares fell 5.1% to extend the previous session’s 15.6% decline after the chipmaker issued disappointing sales forecasts following its third-quarter earnings report.
Additionally, LVMH shares fell 3.7% after recording a decline in revenue during the third quarter, its first negative change since the COVID-19 pandemic, confirming concerns about declining demand in China. As a result, shares of Hermes and Kering fell 1.3% and 0.8%, respectively, while L’Oreal lost more than 2% after being downgraded by JP Morgan.
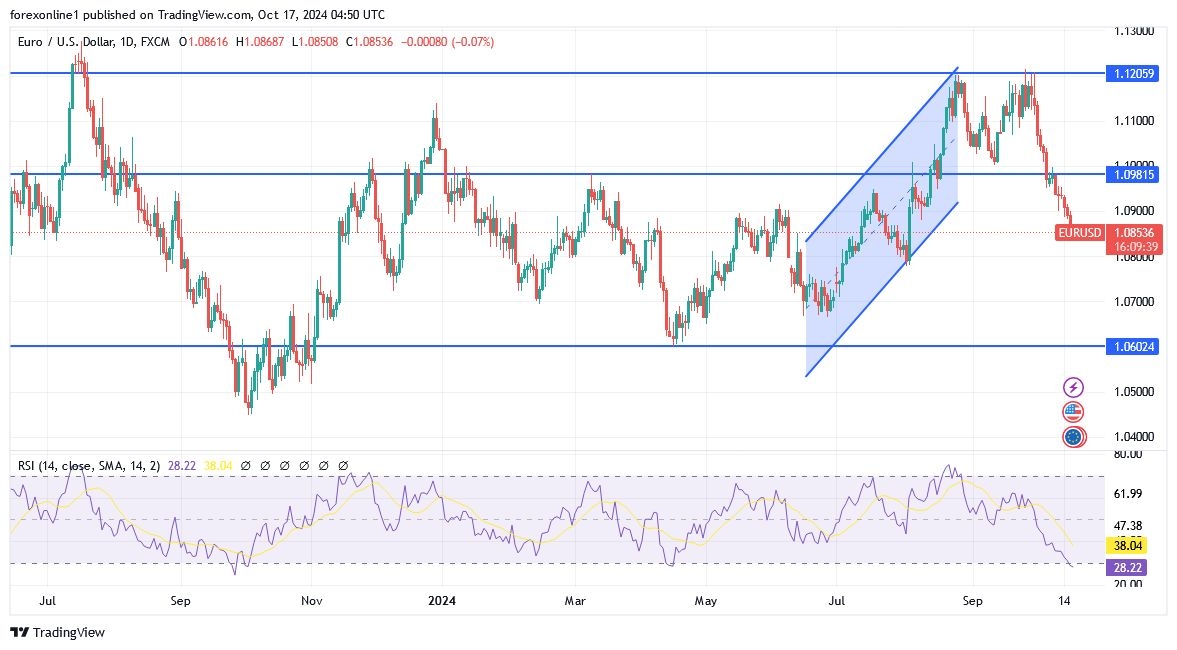
Ahead of today’s important events, the EUR/USD pair is stabilizing in a downward trend, and with the break of the 1.0880 support, it has previously shown that it supports the bears’ strong control of the trend and at the same time moves technical indicators towards oversold levels. Obviously, today’s reaction to the announcement of inflation figures in the eurozone and the European Central Bank’s announcement will determine the fate of performance in the coming days. The closest support levels to the current performance may reach support levels of 1.0820 and 1.0770, respectively. Conversely, and according to the daily chart performance, the resistance of 1.1000 will remain the key to the bulls regaining control.
Ready to trade our daily Forex forecast? Here’s a list of some of the top forex brokers in Europe to check out.
Gold price reached a fresh all-time high on Thursday, trading as high as $2,969.63 a troy ounce during American trading hours. Gold buyers gained confidence early in Asia as the poor performance of local shares fueled demand for safety. Demand for the bright metal was also backed by concerns about the United States (US) future government. Three weeks ahead of the election, polls show a tight vote intention between the two candidates, generating uncertainty.
XAU/USD suffered a minor intraday setback after the European Central Bank (ECB) announced its decision on monetary policy. The ECB trimmed the three main benchmarks by 25 basis points (bps) each as widely anticipated. In the following press conference, President Christine Lagarde delivered a pretty dovish message, putting pressure on the Euro and pushing the Greenback temporarily up.
The US Dollar further advanced after local data beat expectations. September Retail Sales rose by 0.4% in the month, while the Philadelphia Fed Manufacturing Survey jumped to 10.3 in October from 1.7 in September. Finally, Initial Jobless Claims for the week ended October 11 rose by 241K, below the 260K anticipated. As a result, Wall Street surged, while Treasury bonds fell amid expectations the Federal Reserve (Fed) would be able to doge an economic setback.
From a technical point of view, the daily chart for XAU/USD suggests the bullish run is far from over. The pair keeps slowly but steadily grinding north, while a bullish 20 Simple Moving Average (SMA) leads the way north by providing support at around $2,649.50. At the same time, the 100 and 200 SMAs advance far below the shorter one, reflecting persistent buying interest. Finally, technical indicators gain upward strength within positive levels, in line with another leg north.
In the near term, and according to the 4-hour chart, the risk also skews to the upside. A bullish 20 SMA extends its upward slope above the 100 SMA, while the 200 SMA grinds north far below the shorter ones. Technical indicators, in the meantime, hold well above their midlines, although without clear directional strength. The $2,700 mark is at reach in the upcoming sessions, with a corrective decline afterwards possible. Still, there are no signs buyers are giving up; instead, they would likely take their chances on dips.
Support levels: 2,685.45 2,668.80 2,655.65
Resistance levels: 2,700.00 2,715.00, 2,740.00
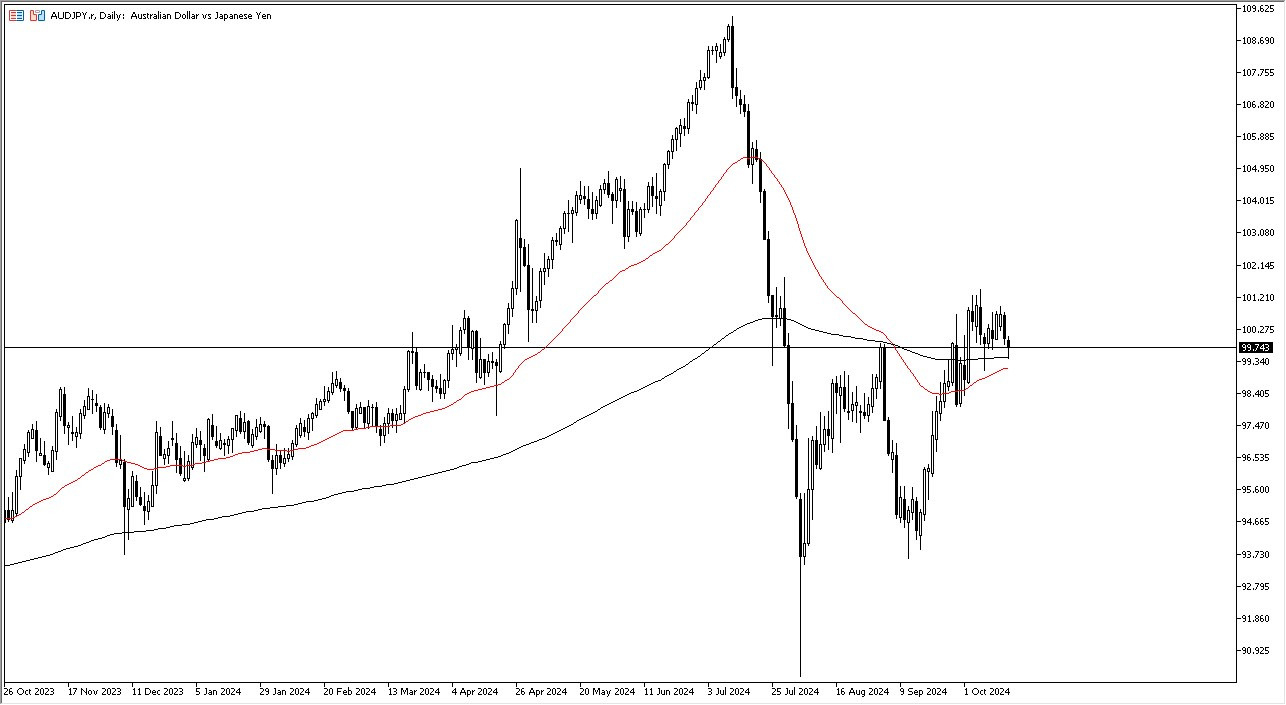
That being said, the 100 yen level just above is an area that I think continues to attract a lot of attention. So, with that being said, if we turn around and rally above there, then I think we have a real shot at heading back to the 101 yen level. If we get back above there again, then I think it’s time for the Australian dollar to finally take off against the Japanese yen. Yet again, we recently have broken out above a little bit of resistance and formed a massive W pattern, so now I think we are in a consolidation phase in order to build up the necessary momentum to keep going higher.
If and when we break above the 101 yen level on a daily close, we could find ourselves going as high as 108 yen before it’s all said and done. Simply put, it would be a massive move waiting to happen. If you just take the measured move from the W pattern, you could be looking at about a 7% move, which puts you right around 107 yen. So, either way, it looks extraordinarily bullish. Furthermore, keep in mind that the interest rate differential continues to favor the Australian dollar, so you get paid at the end of every day to hold this pair anyway. And I think that’s what a lot of people are looking at in this market, as well as other “yen-related pairs.”
Ready to trade our Forex daily analysis and predictions? Here are the best trading platform for beginners to choose from.
Silver price (XAG/USD) trades in a tight range below the key resistance of $32.00 in Thursday’s North American session. The white metal consolidates as investors look for fresh cues about the Federal Reserve’s (Fed) likely interest rate action in the remaining year.
According to the CME FedWatch tool, 30-day Federal Funds futures pricing data shows that the central bank will cut interest rates by 25 basis points (bps) in both policy meetings in November and December.
Meanwhile, upbeat United States (US) monthly Retail Sales and lower Initial Jobless Claims for the week ending October 11 have strengthened the US Dollar (USD). The US Dollar Index (DXY), which tracks the Greenback’s value against six major currencies, posts a fresh 10-month high at 103.85.
The Retail Sales data, a key measure of consumer spending, rose by 0.4%, faster than estimates of 0.3% and the former release of 0.1%. Meanwhile, individuals claiming jobless benefits for the first time came in lower at 241K than estimates of 260K.
10-year US Treasury yields soar to 4.08%. Historically, higher yields on interest-bearing assets increase the opportunity cost of holding an investment in non-yielding assets, such as Silver. However, the Silver price remains supported as growing speculation for former President US Donald Trump winning upcoming presidential elections has improved its appeal as safe-haven.
Silver price strives to reclaim the decade-high of $33.00. Upward-sloping 20- and 50- Exponential Moving Averages (EMAs) near $31.20 and $30.45, respectively, suggest a strong uptrend.
The 14-day Relative Strength Index (RSI) approaches 60.00. A decisive break above the same would activate a bullish momentum.
Silver is a precious metal highly traded among investors. It has been historically used as a store of value and a medium of exchange. Although less popular than Gold, traders may turn to Silver to diversify their investment portfolio, for its intrinsic value or as a potential hedge during high-inflation periods. Investors can buy physical Silver, in coins or in bars, or trade it through vehicles such as Exchange Traded Funds, which track its price on international markets.
Silver prices can move due to a wide range of factors. Geopolitical instability or fears of a deep recession can make Silver price escalate due to its safe-haven status, although to a lesser extent than Gold’s. As a yieldless asset, Silver tends to rise with lower interest rates. Its moves also depend on how the US Dollar (USD) behaves as the asset is priced in dollars (XAG/USD). A strong Dollar tends to keep the price of Silver at bay, whereas a weaker Dollar is likely to propel prices up. Other factors such as investment demand, mining supply – Silver is much more abundant than Gold – and recycling rates can also affect prices.
Silver is widely used in industry, particularly in sectors such as electronics or solar energy, as it has one of the highest electric conductivity of all metals – more than Copper and Gold. A surge in demand can increase prices, while a decline tends to lower them. Dynamics in the US, Chinese and Indian economies can also contribute to price swings: for the US and particularly China, their big industrial sectors use Silver in various processes; in India, consumers’ demand for the precious metal for jewellery also plays a key role in setting prices.
Silver prices tend to follow Gold’s moves. When Gold prices rise, Silver typically follows suit, as their status as safe-haven assets is similar. The Gold/Silver ratio, which shows the number of ounces of Silver needed to equal the value of one ounce of Gold, may help to determine the relative valuation between both metals. Some investors may consider a high ratio as an indicator that Silver is undervalued, or Gold is overvalued. On the contrary, a low ratio might suggest that Gold is undervalued relative to Silver.
Externally, the Japanese yen continues to face pressure from a stronger US dollar on bets that the Federal Reserve will be less aggressive in cutting US interest rates. The so-called Trump trade also lifted the dollar as his policies are seen as inflationary, which would prevent the Federal Reserve from cutting interest rates further.
In Asian markets, Chinese stocks experienced early volatility and dipped as investor impatience grew over the pace of stimulus measures by the central government. The CSI 300 index, which tracks the largest listed companies in Shanghai and Shenzhen, fell 0.2% by midday after initially declining by 1.3% during morning trading. This latest decline represents a total drop of more than 10% since reaching its peak on October 8. Meanwhile, Hong Kong-listed Chinese stocks managed a modest recovery, with the Hang Seng index rising 0.7%.
The volatile market driven by stimulus optimism fades
The recent market volatility highlights the volatility in Chinese stocks since late September, when a wave of stimulus measures by the central bank briefly sparked optimism among investors. But this initial enthusiasm has now quickly faded as Beijing has yet to provide further details on fiscal spending plans. Moreover, this uncertainty fuels doubts about whether the Chinese authorities are ready to roll out more aggressive measures to stabilize the economy and support stock markets.
“Given how quickly markets have risen, they can fall just as fast. But the overall policy measures are moving in the right direction, and when things calm down, Chinese stocks may still trade in a higher range than before.” Although a 10% decline may typically indicate a technical correction for the CSI 300 index, the recent extreme volatility in Chinese markets has diminished the significance of such landmarks. After rising more than 30% over three weeks from mid-September, the index has now lost its momentum, reflecting mixed investor sentiment about whether the rally has peaked or if more gains are still possible.
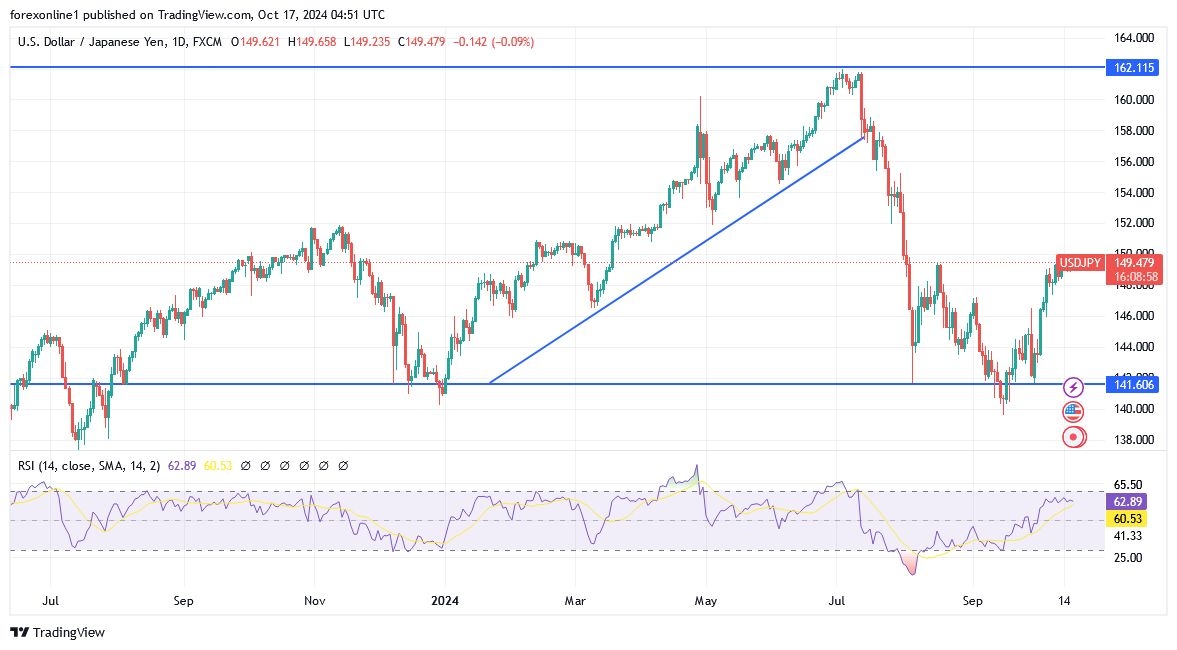
Bulls are still watching the possibility of USD/JPY breaking the psychological resistance level of 150.00 to confirm control and thus prepare for stronger upward breaches. Technically, any positive reaction to the announcement of US retail sales figures and the number of weekly jobless claims today will bring bulls more momentum to move towards the resistance levels of 150.70 and 151.40 respectively, which are levels that strengthen the uptrend. On the other hand, and in the same time frame, there will be no break of the uptrend without returning to the support level of 145.90. The currency pair will remain subject to signals from central bank officials regarding the path of tightening, in addition to the extent of investors’ risk appetite or not.
Ready to trade our Forex daily forecast? We’ve shortlisted the best FX trading platform in the industry for you.
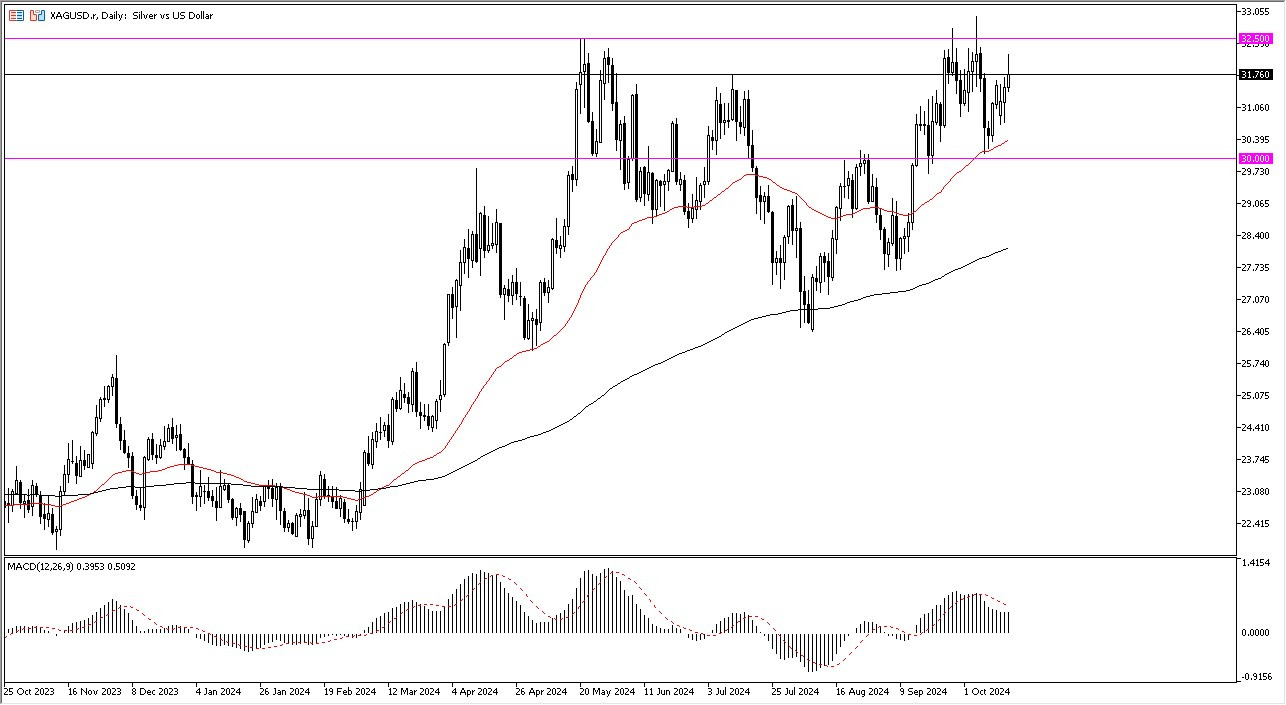
At this point in time, the market looks as if it continues to go back and forth between the $30 level in the bottom, and the $32.50 level above. We are a little closer to the top, and I think at this point in time I think that short-term pullbacks offer buying opportunities. Furthermore, we also have the 50 Day EMA, underneath is an area that a lot of people would be looking to. After all, it is a technical indicator that a lot of people watch, and therefore it makes a certain amount of sense.
Keep in mind that silver is not gold. Yes, I recognize that both are considered to be precious metals, but silver does behave a little bit differently than gold. After all, the silver market is highly tied to a lot of the “green technologies” that a lot of people are so excited about, so keep in mind that when you start to see things in that sector attract more attention, it suggests that perhaps there will be more demand for silver. Furthermore, you also have the interest rates around the world dropping so that could end up being a driver of silver being positive as well. After that, we also have geopolitical concerns, which like gold, some people will put money toward silver.
That being said, silver is not gold. What I mean by this is that it does have a few other aspects that move the market, and of course it’s a much more volatile and dangerous contract. The contract size is larger from a nominal value position, so therefore it’s likely that the average trader needs to be very careful with their position size, because it can be so dangerous to your account. I prefer buying dips, as long as we can stay above the $30 level, but I also recognize that things will be very noisy.
Ready to trade our daily forex analysis and predictions? Here are the best Silver trading brokers to choose from.
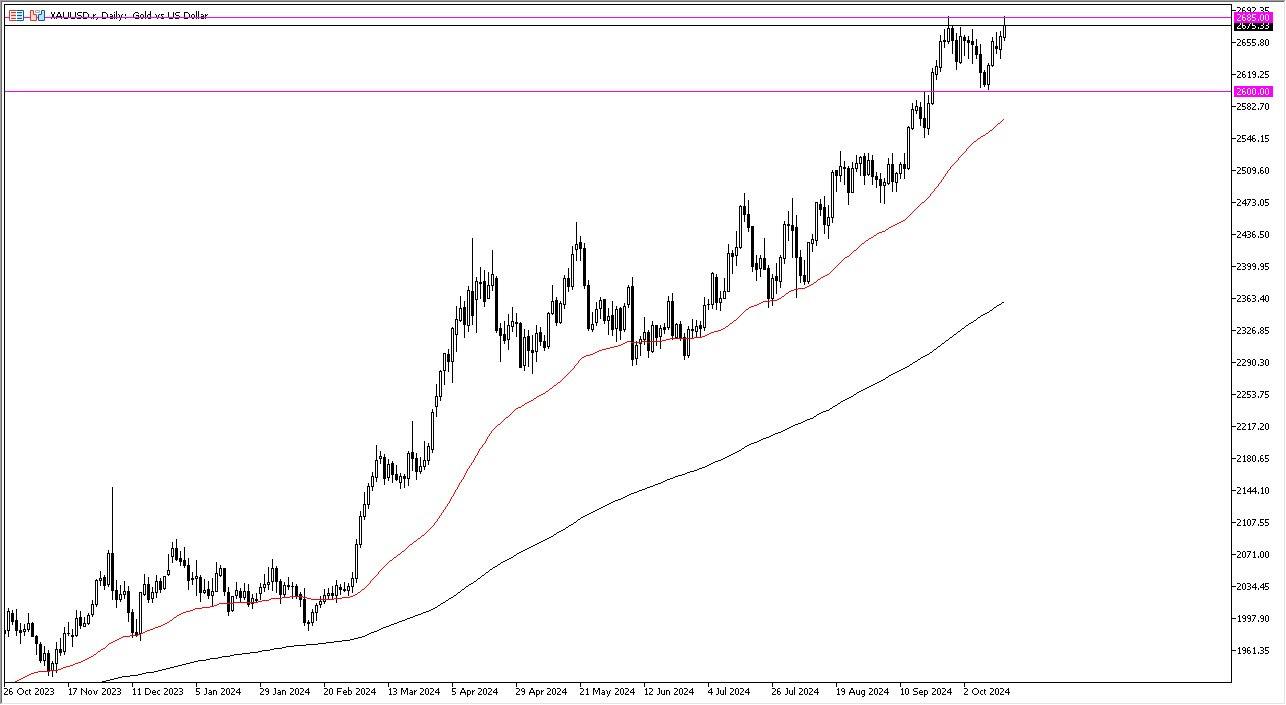
The reason I say it’s panic is that we started to see the stock markets in the United States pull apart rather rapidly at the open, and at the same time started to see gold take off to the upside. That being said, the market is still very much in an uptrend, so I don’t necessarily think that we need to see some type of panic break out. Rather, I think that we just need to see a lot of the same behavior that has been the case for a while. There are plenty of fundamental reasons for gold to continue going higher, so therefore I think this continues to be a bit of a “one-way trade” as things continue to look the same as they did a few months ago.
There are plenty of fundamental reasons for gold to go higher, not the least of which of course would be the geopolitical issues that currently plague the markets right now, including the hot war in Ukraine, the hot war in Lebanon and the various other areas of tension around the world. Furthermore, we also have central banks around the world cutting rates, so that of course means that bonds won’t pay as much in the way of payments anymore, meaning that storing gold will be more palatable. Beyond that, we have a lot of concerns as to whether or not we need to find some type of safety in general, as markets look very shaky, that means that gold could very well be a safe haven for a lot of portfolios.
I am a buyer, and I recognize that short-term pullbacks are more likely than not going to be buying opportunities. It is not until we break down below the 50 Day EMA that I would start to worry about the overall trend, but even then, I think we have quite a bit more damage necessary to start shorting.
Ready to trade our Gold price forecast? We’ve made a list of the best Gold trading platforms worth trading with.
GBP/USD struggles to stage a recovery and stays below 1.3000 in the European session on Thursday after suffering large losses on Wednesday. The pair remains technically bearish as the market focus shifts to the mid-tier macroeconomic data releases from the US.
The table below shows the percentage change of British Pound (GBP) against listed major currencies this week. British Pound was the weakest against the US Dollar.
| USD | EUR | GBP | JPY | CAD | AUD | NZD | CHF | |
|---|---|---|---|---|---|---|---|---|
| USD | 0.80% | 0.70% | 0.49% | 0.09% | 1.08% | 0.94% | 0.98% | |
| EUR | -0.80% | -0.18% | -0.39% | -0.62% | 0.31% | 0.05% | 0.08% | |
| GBP | -0.70% | 0.18% | -0.23% | -0.58% | 0.51% | 0.24% | 0.24% | |
| JPY | -0.49% | 0.39% | 0.23% | -0.41% | 0.61% | 0.50% | 0.48% | |
| CAD | -0.09% | 0.62% | 0.58% | 0.41% | 0.94% | 0.88% | 0.71% | |
| AUD | -1.08% | -0.31% | -0.51% | -0.61% | -0.94% | -0.13% | -0.14% | |
| NZD | -0.94% | -0.05% | -0.24% | -0.50% | -0.88% | 0.13% | -0.03% | |
| CHF | -0.98% | -0.08% | -0.24% | -0.48% | -0.71% | 0.14% | 0.03% |
The heat map shows percentage changes of major currencies against each other. The base currency is picked from the left column, while the quote currency is picked from the top row. For example, if you pick the British Pound from the left column and move along the horizontal line to the US Dollar, the percentage change displayed in the box will represent GBP (base)/USD (quote).
Softer-than-forecast September inflation readings from the UK on Wednesday caused investors to start pricing in multiple Bank of England (BoE) rate cuts this year, triggering a Pound Sterling selloff.
Early Thursday, the cautious market mood helps the US Dollar (USD) stay resilient against its rivals and makes it difficult for GBP/USD to gain traction. In the second half of the day, September Retail Sales and the weekly Initial Jobless Claims data from the US will be watched closely by market participants.
The number of first-time applications for unemployment benefits is forecast to stay unchanged at 258,000 in the week ending October 12. A noticeable decline in this data, with a print below 220,000, could boost the USD and force GBP/USD to stretch lower. On the other hand, a reading near or above the market expectation could pave the way for a weaker USD. In this scenario, GBP/USD could retrace a portion of its weekly decline.
The Relative Strength Index (RSI) indicator on the 4-hour chart stays below 40, suggesting that the bearish stance holds. On the downside, 1.2950-1.2940 (100-day Simple Moving Average (SMA), static level) forms a strong support area ahead of 1.2900 (static level, round level).
In case GBP/USD manages to rise above 1.3000 (round level, static level) and stabilizes there, sellers could be discouraged. In this scenario, 1.3050 (static level) could be seen as next resistance before 1.3100 (round level, static level).
The Pound Sterling (GBP) is the oldest currency in the world (886 AD) and the official currency of the United Kingdom. It is the fourth most traded unit for foreign exchange (FX) in the world, accounting for 12% of all transactions, averaging $630 billion a day, according to 2022 data. Its key trading pairs are GBP/USD, also known as ‘Cable’, which accounts for 11% of FX, GBP/JPY, or the ‘Dragon’ as it is known by traders (3%), and EUR/GBP (2%). The Pound Sterling is issued by the Bank of England (BoE).
The single most important factor influencing the value of the Pound Sterling is monetary policy decided by the Bank of England. The BoE bases its decisions on whether it has achieved its primary goal of “price stability” – a steady inflation rate of around 2%. Its primary tool for achieving this is the adjustment of interest rates. When inflation is too high, the BoE will try to rein it in by raising interest rates, making it more expensive for people and businesses to access credit. This is generally positive for GBP, as higher interest rates make the UK a more attractive place for global investors to park their money. When inflation falls too low it is a sign economic growth is slowing. In this scenario, the BoE will consider lowering interest rates to cheapen credit so businesses will borrow more to invest in growth-generating projects.
Data releases gauge the health of the economy and can impact the value of the Pound Sterling. Indicators such as GDP, Manufacturing and Services PMIs, and employment can all influence the direction of the GBP. A strong economy is good for Sterling. Not only does it attract more foreign investment but it may encourage the BoE to put up interest rates, which will directly strengthen GBP. Otherwise, if economic data is weak, the Pound Sterling is likely to fall.
Another significant data release for the Pound Sterling is the Trade Balance. This indicator measures the difference between what a country earns from its exports and what it spends on imports over a given period. If a country produces highly sought-after exports, its currency will benefit purely from the extra demand created from foreign buyers seeking to purchase these goods. Therefore, a positive net Trade Balance strengthens a currency and vice versa for a negative balance.