The main category of Forex News.
You can use the search box below to find what you need.
[wd_asp id=1]
The main category of Forex News.
You can use the search box below to find what you need.
[wd_asp id=1]
Silver’s price skyrocketed during the North American session, sponsored by falling US Treasury bond yields. Even though traders trimmed bets that the Federal Reserve would ease policy less aggressively than expected, precious metals extended their gains. The XAG/USD trades at $32.33, up over 2.26%.
Silver’s price uptrend remains intact, at the brisk of registering a yearly record high. Earlier in the session, XAG/USD cleared the $32.00 psychological barrier and has extended its gains past the $32.50 area.
The Relative Strength Index (RSI) is bullish, aiming higher, indicating buyers are gathering steam.
Given the backdrop, the XAG/USD key resistance levels would be the year-to-date (YTD) high at $32.95, followed by the $33.00 mark. Once it is exceeded, the next stop would be October 1, 2012, peaking at $35.40.
Conversely, if XAG/USD retreats below $32.00, the first support would be the October 17 swing low of $31.32, followed by the confluence of the October 8 low and the 50-day moving average (DMA) at $30.13
Silver is a precious metal highly traded among investors. It has been historically used as a store of value and a medium of exchange. Although less popular than Gold, traders may turn to Silver to diversify their investment portfolio, for its intrinsic value or as a potential hedge during high-inflation periods. Investors can buy physical Silver, in coins or in bars, or trade it through vehicles such as Exchange Traded Funds, which track its price on international markets.
Silver prices can move due to a wide range of factors. Geopolitical instability or fears of a deep recession can make Silver price escalate due to its safe-haven status, although to a lesser extent than Gold’s. As a yieldless asset, Silver tends to rise with lower interest rates. Its moves also depend on how the US Dollar (USD) behaves as the asset is priced in dollars (XAG/USD). A strong Dollar tends to keep the price of Silver at bay, whereas a weaker Dollar is likely to propel prices up. Other factors such as investment demand, mining supply – Silver is much more abundant than Gold – and recycling rates can also affect prices.
Silver is widely used in industry, particularly in sectors such as electronics or solar energy, as it has one of the highest electric conductivity of all metals – more than Copper and Gold. A surge in demand can increase prices, while a decline tends to lower them. Dynamics in the US, Chinese and Indian economies can also contribute to price swings: for the US and particularly China, their big industrial sectors use Silver in various processes; in India, consumers’ demand for the precious metal for jewellery also plays a key role in setting prices.
Silver prices tend to follow Gold’s moves. When Gold prices rise, Silver typically follows suit, as their status as safe-haven assets is similar. The Gold/Silver ratio, which shows the number of ounces of Silver needed to equal the value of one ounce of Gold, may help to determine the relative valuation between both metals. Some investors may consider a high ratio as an indicator that Silver is undervalued, or Gold is overvalued. On the contrary, a low ratio might suggest that Gold is undervalued relative to Silver.
GBP/JPY has formed a right-angle triangle which indicates a breakout higher is likely.
Price is more likely to break above the flat edge, according to technical analysis (TA) theory, which in this case runs along the topside of the pattern.
A decisive breakout above the top of the triangle would activate the pattern’s first upside target at 199.59, the 61.8% Fibonacci extrapolation of the height of the triangle (at its widest point) higher. This is the usual TA method for forecasting such moves.
One bearish sign is that the Moving Average Divergence Convergence (MACD) momentum indicator has been diverging bearishly with price during the formation of the triangle. Whilst price has made a higher high, MACD has declined. This is a mildly bearish sign.
A decisive breakout would be one accompanied by a long green candlestick that pierced cleanly through the top of the triangle at 196.00 and closed above near its high. This, or three green candlesticks in a row that broke cleanly above the flat top of the pattern.
The Pound Sterling (GBP) fell for the third consecutive week against the US Dollar (USD), as the GBP/USD pair tested levels below the 1.3000 round level for the first time since mid-August before staging a late recovery.
Markets turned more dovish on the Bank of England’s (BoE) monetary policy outlook while sealing in a smaller interest-rate cut by the US Federal Reserve (Fed), thus strengthening the US Dollar’s advance at the expense of the Pound Sterling.
The annual UK Consumer Price Index (CPI) inflation fell sharply to 1.7% in September from 2.2% in August, the lowest reading since April 2021 and driven down by lower airfares and petrol prices, the Office for National Statistics (ONS) said on Wednesday. The data came in below the expected 1.9% figure. On Tuesday, the ONS said that the UK pay growth, as measured by the Average Earnings Excluding Bonus, fell below 5.0% in the three months to August.
Falling inflation and softening labor market conditions made the case for rate reductions by the BoE at a faster pace. Following these data, interest rate futures showed investors were pricing a 90% chance of two BoE quarter-point rate cuts by the end of this year, up from roughly 80% at the start of the week.
Meanwhile, the unabated demand for the US Dollar exerted downward pressure on the pair. The bets for a 25 basis points (bps) Fed rate cut next month remained unfazed despite several dovish speeches from Fed policymakers and strong US Retail Sales data, allowing the buck to build on its recovery rally. US Retail Sales rose 0.4% in September after an unrevised 0.1% gain in August, the US Census Bureau said on Thursday.
The USD’s upsurge has lately been sponsored by the market’s optimism that Republican nominee and former US President Donald Trump is set to win the 2024 US presidential elections. Trump’s fiscal and trade policies are seen as inflationary and positive for the Greenback.
Further, rife Middle East geopolitical tensions also contributed to the bullish momentum in the safe-haven US Dollar. Amongst the latest Mideast developments, the Iran-backed militant group Hezbollah said it will escalate war with Israel after Israel’s Foreign Minister confirmed the killing of Hamas leader Yahya Sinwar on Thursday.
On Friday, the GBP/USD pair staged a rebound from two-month lows of 1.2974, as US Dollar buyers resorted to profit-taking after the solid performance during the week. Stronger-than-expected Britain’s Retail Sales data also aided the Pound Sterling recovery. United Kingdom Retail Sales unexpectedly rose by 0.3% in September, compared to a 0.3% decline expected, according to the latest figures from the ONS.
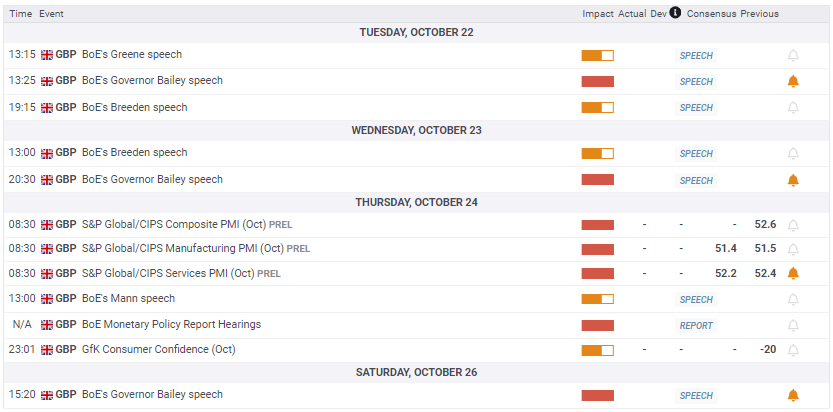
Pound Sterling traders brace for a relatively data-light week, as the first half of the week is devoid of any high-impact data releases from both sides of the Atlantic.
However, the Fed and the BoE policymakers are scheduled to make their appearances, with BoE Governor Andrew Bailey due to speak on Tuesday and late Wednesday.
Thursday will feature the S&P Global preliminary Purchasing Managers Index (PMI) data for October from the US and the UK. The US Jobless Claims data will also be published on the same day. The BoE hawk Monetary Policy Committee member Catherine Mann is due to speak after Cleveland Fed President Beth Hammack’s speech.
The mid-tier US Durable Goods Orders data for September will be released on Friday, making it a quiet calendar heading into Saturday’s speech by BoE Governor Bailey.
Apart from the data releases and the central banks’ commentaries, investors will pay close attention to the market’s pricing of the outcome of the US elections while Mid-East geopolitical developments will also be in focus.
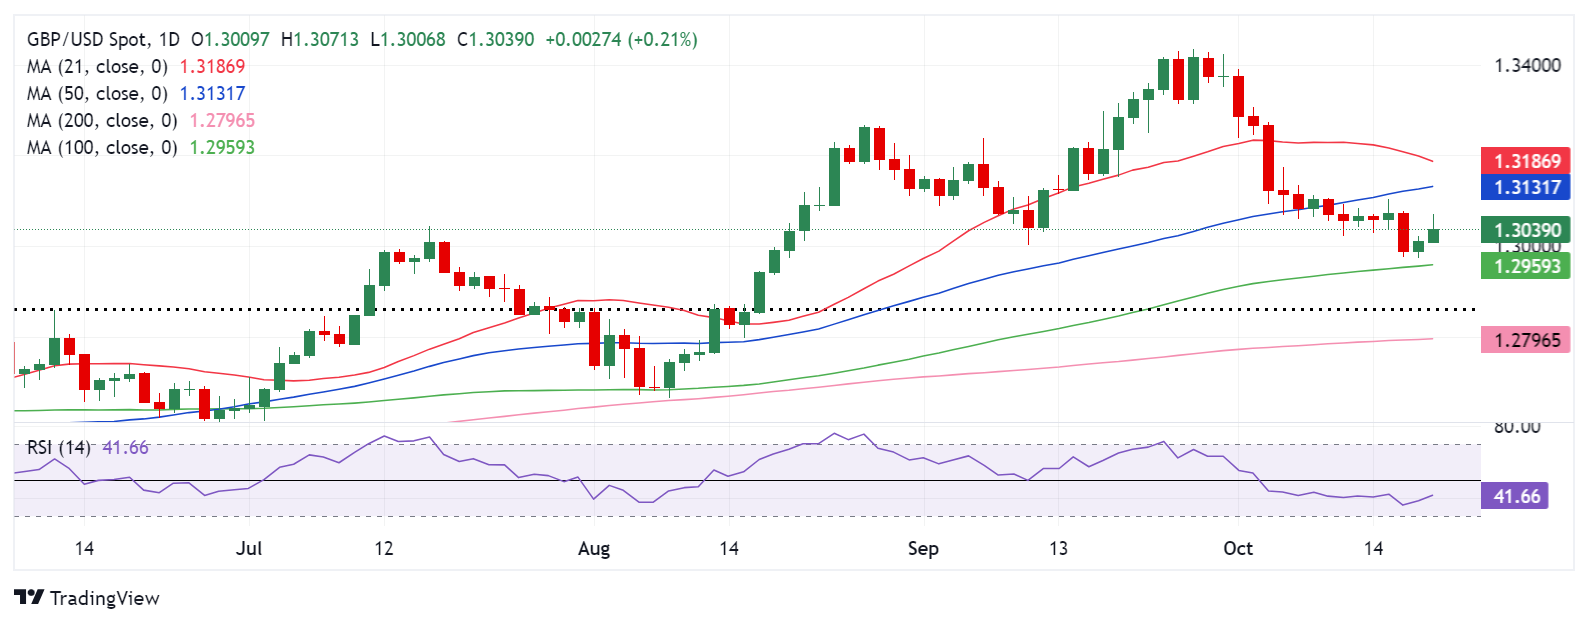
The GBP/USD pair extended the previous week’s downside break of the critical 50-day Simple Moving Average (SMA), then at 1.3101.
The extended decline tested the 100-day SMA support near 1.2960, with more downside likely on the cards, as the 14-day Relative Strength Index (RSI) holds comfortably below the 50 level, currently near 44.
Therefore, any recovery attempt in the pair is likely to be sold off unless the Pound Sterling recaptures the 50-day SMA support-turned-resistance, now at 1.3132.
The next topside barrier is seen at the 21-day SMA at 1.3188. A meaningful uptrend could unfold on a sustained move above that level, opening the door for a test of the 1.3250 psychological barrier.
Pound Sterling will then target the 1.3300 round level should the bullish momentum gain traction.
On the flip side, a daily candlestick closing below the 100-day SMA at 1.2960 could expose the 200-day SMA cap at 1.2796.
Ahead of that, the June 12 high of 1.2861 could offer temporary respite to buyers.
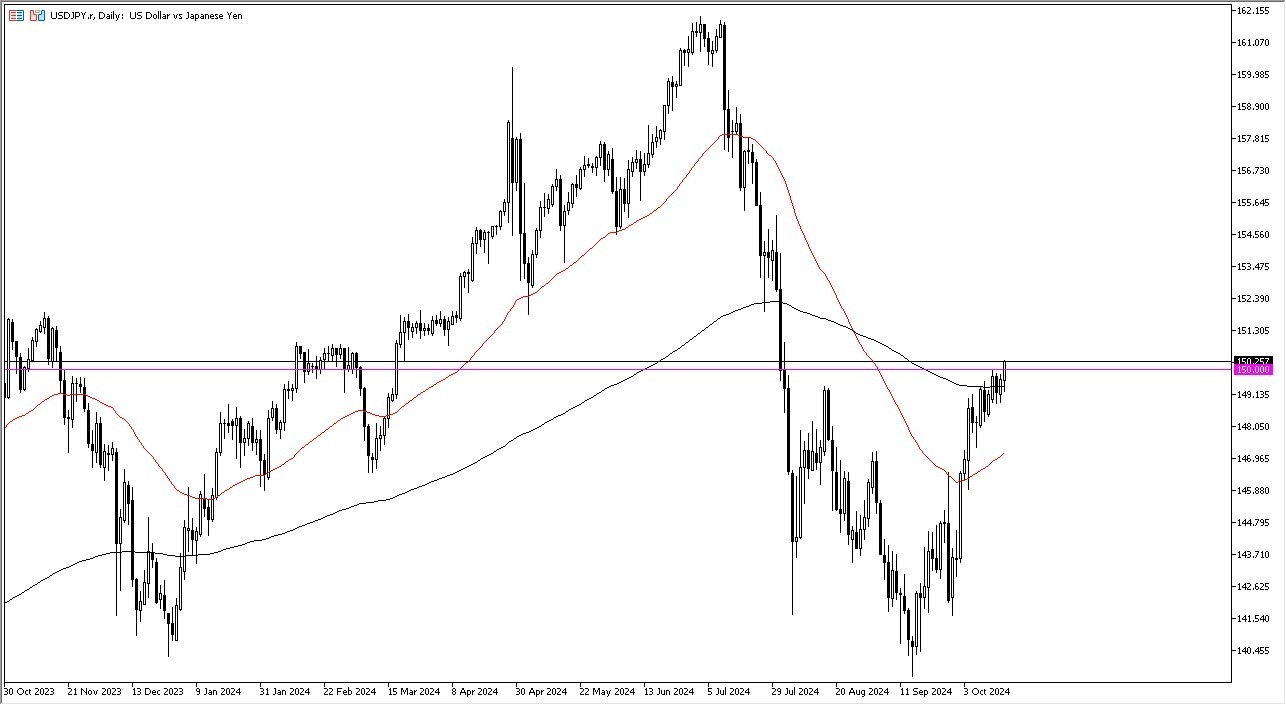
Because of this, I’ve become a little bit more aggressive in my bullishness, and I think at this point in time, we are on the precipice of another surge higher. With that being the case, I am a buyer of dips, and quite frankly, don’t have a scenario in which I’m willing to sell this pair, but truthfully, I really haven’t had that scenario for a while. The interest rate differential will continue to be a major factor in this pair, as the of the idea of tightening monetary policy. Because of this and the fact that the economic numbers in the United States just continue to show strength, after all, the retail sales numbers came out much hotter than anticipated during the Thursday session, it’s likely that we will continue to see more upward momentum.

I, at this point in time, believe that this pair could very well end up going to the 153 yen level, perhaps even higher than that. The Bank of Japan simply cannot raise interest rates much more or even any further than they have because of the massive debt problems that the Japanese economy would face. With that being said the carry trade looks very much in vogue again, and I think it’s not only the US dollar that’s going to rally against the Japanese yen, but probably most currencies. This makes a lot of sense, as the Japanese yen tends to move in the same way against all other currencies.
Ready to trade our daily USD/JPY forex forecast? Here are the best forex brokers in Japan to choose from.
The EUR/USD outlook shows increased downward pressure as European Central Bank rate cut bets surge after Thursday’s meeting. Meanwhile, the dollar held near an 11-week high against the euro amid rising bets for a Trump win and upbeat US data.
–Are you interested to learn more about ECN brokers? Check our detailed guide-
The ECB cut interest rates by 25-bps on Thursday after a similar move during the September meeting. Although markets had fully priced the move, the outcome led to a surge in bets for future rate cuts. As a result, the euro collapsed.
The Eurozone economy has performed poorly compared to the US, putting pressure on the ECB to lower borrowing costs. At the same time, inflation in the bloc has eased to 1.8%, below the central bank’s target. Consequently, traders expect another rate cut in December and more in 2025.
Meanwhile, the US dollar rallied after an upbeat retail sales report. Data revealed that sales jumped by 0.4% in September, beating estimates of 0.3%. At the same time, core retail sales rose by 0.5% compared to forecasts of 0.1%. The upbeat figures indicated robust consumer spending and a healthy economy. Moreover, it eased bets for a November Fed rate cut while increasing the likelihood of a pause.
Meanwhile, market participants are pricing a possible Trump win during next month’s presidential election. The last time he won, the dollar rallied as traders priced in higher inflation. Therefore, there is a chance another win will boost the greenback.
Market participants do not expect key events today, so the pair might end the week quietly.
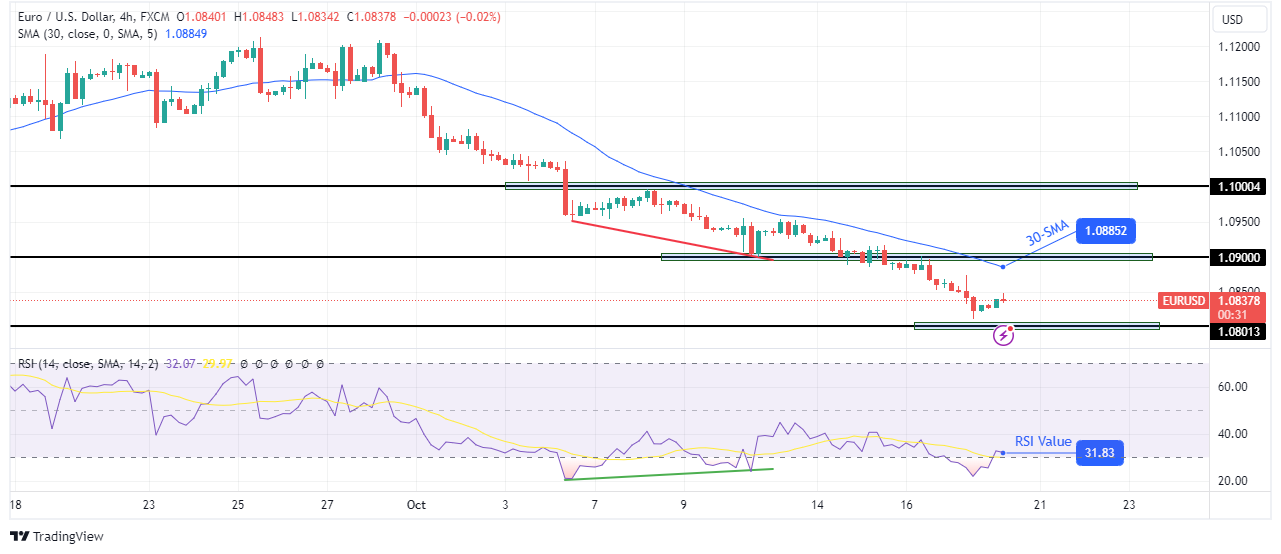
On the technical side, the EUR/USD price is wallowing near the 1.0801 support level after reaching a new low in the downtrend. The price sits below the 30-SMA, with the RSI near the oversold region.
–Are you interested to learn more about making money in forex? Check our detailed guide-
Initially, the RSI had made a bullish divergence, which failed to play out. This shows that bears regained momentum. If they keep up the pace, the pair will soon challenge the 1.0801 support level. However, it might revisit the SMA before seeking new lows.
Looking to trade forex now? Invest at eToro!
67% of retail investor accounts lose money when trading CFDs with this provider. You should consider whether you can afford to take the high risk of losing your money.
Silver (XAG/USD) regains positive traction following the previous day’s good two-way price moves and climbs to a two-week top during the first half of the European session on Friday. The white metal, however, continues with its struggle to capitalize on the move beyond the $32.00 round figure, warranting some caution for bullish traders.
Looking at the broader picture, the recent bounce from the vicinity of the $30.00 psychological mark and the subsequent move up supports prospects for a further near-term appreciating move. The constructive outlook is reinforced by the fact that oscillators on the daily chart have been gaining positive traction and are still away from being in the overbought zone.
That said, it will still be prudent to wait for some follow-through buying beyond the $32.20-$32.25 hurdle before placing fresh bullish bets. The XAG/USD might then climb to its highest level since December 2012 touched earlier this month and make a fresh attempt to conquer the $33.00 mark. A sustained strength beyond the latter will be seen as a fresh trigger for bulls.
On the flip side, the $31.65 horizontal zone now seems to protect the immediate downside ahead of the overnight swing low, around the $31.30 region. Any further decline could be seen as a buying opportunity and remain limited near the $31.00 mark. A convincing break below the said handle, however, might prompt some technical selling and make the XAG/USD vulnerable.
The downward trajectory might then drag the white metal below the $30.75 support zone, back towards last week’s swing low, around the $30.15-$30.10 region. The said area now coincides with the 50-day Simple Moving Average (SMA) and is closely followed by the $30.00 mark, which if broken decisively will shift the near-term bias in favor of bearish traders.
Silver is a precious metal highly traded among investors. It has been historically used as a store of value and a medium of exchange. Although less popular than Gold, traders may turn to Silver to diversify their investment portfolio, for its intrinsic value or as a potential hedge during high-inflation periods. Investors can buy physical Silver, in coins or in bars, or trade it through vehicles such as Exchange Traded Funds, which track its price on international markets.
Silver prices can move due to a wide range of factors. Geopolitical instability or fears of a deep recession can make Silver price escalate due to its safe-haven status, although to a lesser extent than Gold’s. As a yieldless asset, Silver tends to rise with lower interest rates. Its moves also depend on how the US Dollar (USD) behaves as the asset is priced in dollars (XAG/USD). A strong Dollar tends to keep the price of Silver at bay, whereas a weaker Dollar is likely to propel prices up. Other factors such as investment demand, mining supply – Silver is much more abundant than Gold – and recycling rates can also affect prices.
Silver is widely used in industry, particularly in sectors such as electronics or solar energy, as it has one of the highest electric conductivity of all metals – more than Copper and Gold. A surge in demand can increase prices, while a decline tends to lower them. Dynamics in the US, Chinese and Indian economies can also contribute to price swings: for the US and particularly China, their big industrial sectors use Silver in various processes; in India, consumers’ demand for the precious metal for jewellery also plays a key role in setting prices.
Silver prices tend to follow Gold’s moves. When Gold prices rise, Silver typically follows suit, as their status as safe-haven assets is similar. The Gold/Silver ratio, which shows the number of ounces of Silver needed to equal the value of one ounce of Gold, may help to determine the relative valuation between both metals. Some investors may consider a high ratio as an indicator that Silver is undervalued, or Gold is overvalued. On the contrary, a low ratio might suggest that Gold is undervalued relative to Silver.
Gold price is sitting at the highest level on record above $2,70o early Friday, with the latest uptick led by China’s stimulus optimism and a broad-based US Dollar (USD) pullback. The focus now shifts to the Middle East geopolitical updates and Fedspeak for further trading impetus.
The USD retreats from over two-month highs against its six major rivals in Asian trades on Friday, as buyers take a breather after the recent rally back by the market’s optimism that Republican nominee Donald Trump is set to win the 2024 US presidential elections. Trump’s fiscal and trade policies are seen as inflationary and positive for the Greenback.
Besides, markets witness a positive shift in risk sentiment, as the mixed Chinese growth and activity data combined with the People’s Bank of China’s statement have rekindled stimulus hopes. The renewed market optimism also diminishes the Greenback’s appeal as a safe-haven currency.
Therefore, Gold price receives a double booster shot, first from a broad USD retracement and then from expectations of further interest-rate cuts from China. Chinese central bank Governor Pan Gongsheng said that “depending on market liquidity, reserve requirement ratio (RRR) could be further reduced by 0.25 to 0.5 percentage points before the end of the year.”
He noted that “the interest rate of 7-day reverse repo operation in the open market will be lowered by 0.2 percentage points,” adding, “It is expected that the loan market prime rate (LPR) could also fall by 0.2-0.25 percentage points.”
A period of low-interest-rate regime tends to benefit the non-interest-rate bearing Gold price.
That said, the European Central Bank (ECB) lowered key policy rates for the third time this year on Thursday but did not provide any forward guidance on the rates outlook. However, four sources close to the matter told Reuters a fourth cut in December is likely unless economic or inflation data turns around in the coming weeks.
Meanwhile, US Retail Sales rose 0.4% in September after an unrevised 0.1% gain in August, the Commerce Department’s Census Bureau said on Thursday. Strong US data indicated robust economic prospects but that failed to alter the odds of a 25 basis points (bps) rate cut by the US Federal Reserve (Fed) in November. Markets are currently pricing in a 93% probability of such a move by the Fed next month.
Additionally, Gold price found fresh haven demand amidst escalating geopolitical tensions between Iran and Israel. Iran-backed militant group, Hezbollah, said it will escalate war with Israel after Israel’s Foreign Minister confirmed the killing of Hamas leader Yahya Sinwar on Thursday.
Looking ahead, all eyes remain on the speeches from several Fed policymakers and the rife tensions in the Middle East for further upside in Gold price. The end-of-the-week flows could also play its part in driving the volatility around Gold price.
Gold price technical analysis: Daily chart
Gold price tested $2,700 on Thursday and conquered the latter early Friday, extending the upside break of the key resistance at $2,670.
The 14-day Relative Strength Index (RSI), battles the overbougtht region near 70, at the moment, suggesting that there remains some more room to the upside before a correction could set in.
If Gold buyers manage to defend the $2,700 round level, a test of the $2,750 psychological barrier will be inevitable.
On the downside, the immediate support is seen at the intraday low of $2,692, below which a drop toward the previous resistance now turned support at $2,670 cannot be ruled out.
Acceptance below that level will expose sellers to the key 21-day Simple Moving Average (SMA) support at $2,653.
Gold has played a key role in human’s history as it has been widely used as a store of value and medium of exchange. Currently, apart from its shine and usage for jewelry, the precious metal is widely seen as a safe-haven asset, meaning that it is considered a good investment during turbulent times. Gold is also widely seen as a hedge against inflation and against depreciating currencies as it doesn’t rely on any specific issuer or government.
Central banks are the biggest Gold holders. In their aim to support their currencies in turbulent times, central banks tend to diversify their reserves and buy Gold to improve the perceived strength of the economy and the currency. High Gold reserves can be a source of trust for a country’s solvency. Central banks added 1,136 tonnes of Gold worth around $70 billion to their reserves in 2022, according to data from the World Gold Council. This is the highest yearly purchase since records began. Central banks from emerging economies such as China, India and Turkey are quickly increasing their Gold reserves.
Gold has an inverse correlation with the US Dollar and US Treasuries, which are both major reserve and safe-haven assets. When the Dollar depreciates, Gold tends to rise, enabling investors and central banks to diversify their assets in turbulent times. Gold is also inversely correlated with risk assets. A rally in the stock market tends to weaken Gold price, while sell-offs in riskier markets tend to favor the precious metal.
The price can move due to a wide range of factors. Geopolitical instability or fears of a deep recession can quickly make Gold price escalate due to its safe-haven status. As a yield-less asset, Gold tends to rise with lower interest rates, while higher cost of money usually weighs down on the yellow metal. Still, most moves depend on how the US Dollar (USD) behaves as the asset is priced in dollars (XAU/USD). A strong Dollar tends to keep the price of Gold controlled, whereas a weaker Dollar is likely to push Gold prices up.
Silver price (XAG/USD) extends its winning streak for the fourth consecutive day, hovering around $32.00 per troy ounce during the Asian trading session on Friday. The price of the grey metal receives support from safe-haven flows amid rising tensions in the Middle East.
Israel’s military and the Shin Bet security service confirmed on Thursday that Yahya Sinwar, the Gaza Strip Chief of the Palestinian Islamist group Hamas, was killed by Israeli forces during an operation in southern Gaza on Wednesday. Sinwar’s death has raised concerns among the families of Israeli hostages taken to Gaza by Hamas, who fear that the killing of the militant leader might increase the risk to their loved ones, according to Reuters.
The non-yielding assets like Silver gains demand due to the prevailing sentiment of interest rate reductions by major central banks. US Federal Reserve (Fed) is expected to reduce interest rates by 50 basis points by the end of 2024. According to the CME FedWatch Tool, there is a 90.8% probability of a 25 basis point rate cut in November and a 74.0% chance of another cut in December.
On Thursday, the European Central Bank (ECB) lowered its Main Refinancing Operations Rate by 25 basis points to 3.4%. Recent inflation data also indicates that both the Bank of England (BoE) and the Reserve Bank of New Zealand (RBNZ) may consider potential rate cuts next month.
Silver is a precious metal highly traded among investors. It has been historically used as a store of value and a medium of exchange. Although less popular than Gold, traders may turn to Silver to diversify their investment portfolio, for its intrinsic value or as a potential hedge during high-inflation periods. Investors can buy physical Silver, in coins or in bars, or trade it through vehicles such as Exchange Traded Funds, which track its price on international markets.
Silver prices can move due to a wide range of factors. Geopolitical instability or fears of a deep recession can make Silver price escalate due to its safe-haven status, although to a lesser extent than Gold’s. As a yieldless asset, Silver tends to rise with lower interest rates. Its moves also depend on how the US Dollar (USD) behaves as the asset is priced in dollars (XAG/USD). A strong Dollar tends to keep the price of Silver at bay, whereas a weaker Dollar is likely to propel prices up. Other factors such as investment demand, mining supply – Silver is much more abundant than Gold – and recycling rates can also affect prices.
Silver is widely used in industry, particularly in sectors such as electronics or solar energy, as it has one of the highest electric conductivity of all metals – more than Copper and Gold. A surge in demand can increase prices, while a decline tends to lower them. Dynamics in the US, Chinese and Indian economies can also contribute to price swings: for the US and particularly China, their big industrial sectors use Silver in various processes; in India, consumers’ demand for the precious metal for jewellery also plays a key role in setting prices.
Silver prices tend to follow Gold’s moves. When Gold prices rise, Silver typically follows suit, as their status as safe-haven assets is similar. The Gold/Silver ratio, which shows the number of ounces of Silver needed to equal the value of one ounce of Gold, may help to determine the relative valuation between both metals. Some investors may consider a high ratio as an indicator that Silver is undervalued, or Gold is overvalued. On the contrary, a low ratio might suggest that Gold is undervalued relative to Silver.
Since the outbreak of the conflict in Gaza last October, spikes in oil prices have been short-lived as oil production has largely been undisrupted. However, this could change if Israeli strikes target Iranian energy infrastructure, including export terminals, oil and gas fields, power plants, and storage facilities.
“This option is unlikely to gain favor with the U.S. administration, which would be wary of disrupting oil markets in the weeks leading up to the presidential election,” Kaneva noted. “Still, until the conflict is resolved, we could see a sustained geopolitical premium in crude price.”
Another key difference is that global oil inventories are much lower today. Global crude inventories currently stand at 4.4 billion barrels — the lowest on record since January 2017 and markedly below last year’s levels, when Brent was trading at $92/bbl. Meanwhile, both OECD crude and liquids inventories sit below their five-year range and five-year averages, and oil stocks at Cushing are severely depleted by the standards of the last 15 years.
“Price is a function of demand for oil inventory, which in turn depends on the willingness of users to either deplete or restock their holdings. Given the anticipation of an oversupplied market in 2025, oil consumers have so far opted to wait, causing a dislocation of the oil price from its fair value,” Kaneva explained. “However, shifting dynamics in the Middle East might create a greater urgency to replenish inventories, thereby realigning the price of oil with its fundamental level.”
A bullish breakout of a double bottom pattern triggered in September with a rally above 2.30, and it was eventually followed by an accelerated advance to the recent swing high of 3.02. That was in an area of potential resistance around the top boundary line of a large symmetrical triangle pattern. Once the top of the pattern rejects price to the downside there is the potential to eventually reach the other side, in this case the bottom boundary line that connects with the second bottom from August 27. Notice that the line is redrawn from the original lower boundary line to account for the higher swing low in August.
Now, natural gas is in the process of revisiting the neckline of the double bottom to test it as support. However, given the bearish momentum of the descent, down by at least 22.4% from the 3.02 high in nine days, it may give way to a subsequent test of support around the 200-Day MA, now at 2.25. If a test of the 200-Day line fails to find buyers, there is the potential for a drop to test support around the 78.6% retracement at 2.12. And that also opens the door to a potential test of the lower line of the triangle.
The expectation is for support to be seen at or above the 200-Day MA. Other than an initial minor test of support at the 200-Day line on September 19, this is the first real test since a bull breakout of the line triggered on September 11. It should hold and lead to an eventual bullish reversal if natural gas is to have a chance to again strengthen and eventually attempt another bullish breakout of the triangle pattern.
For a look at all of today’s economic events, check out our economic calendar.