The main category of Forex News.
You can use the search box below to find what you need.
[wd_asp id=1]
The main category of Forex News.
You can use the search box below to find what you need.
[wd_asp id=1]
Risk aversion keeps fueling Gold demand, with the bright metal flirting with record highs on Wednesday. XAU/USD peaked at $2,685.25 on Wednesday despite broad US Dollar (USD) strength against other major currencies. The latter has gained extra strength after Wall Street’s opening, resulting in XAU/USD pulling back from the mentioned high yet still holding to modest intraday gains.
A dismal market mood prevailed throughout the first half of the day, with Asian and European indexes edging lower, following softer-than-anticipated earning reports in the Old Continent. Wall Street, however, managed to revert the sentiment, as the three major indexes stand in the green.
Speculative interest keeps looking at Middle East developments and China for guidance, given the absence of first-tier macroeconomic figures this week, yet headlines are also scarce on those fronts. On the one hand, the missile barrage between Israel and Iran continues, with fears the attacks will reach nuclear or oil plants. On the other hand, the Chinese government has bluffed about stimulus measures to revive the economy but failed to provide enough details on the matter.
If something, the European Central Bank (ECB) may trigger some action on Thursday, as the central bank will announce its decision on monetary policy. The ECB is widely anticipated to deliver a third consecutive interest rate cut. The Main Refinancing Operations Rate and the Rate on Deposit Facility are foreseen down by 25 basis points (bps) each amid struggling economic progress.
From a technical point of view, the XAU/USD pair is poised to extend its advance and challenge the $2,700 mark. In the daily chart, the pair is up for a second consecutive day, with a bullish 20 Simple Moving Average (SMA) providing dynamic support at around $2,644.10. In the same chart, the longer moving averages also maintain their bullish slopes far below the shorter one, reflecting the long-term positive stance. Finally, the Momentum indicator turned flat around its 100 line, while the Relative Strength Index (RSI) indicator keeps grinding higher, currently at around 64, in line with bulls’ dominance.
In the near term, and according to the 4-hour chart, the risk skews to the upside. A bullish 20 SMA runs above its 100 SMA, while the 200 SMA grinds higher below the shorter ones, usually understood as growing momentum. At the same time, technical indicators have resumed their advances within positive levels after a modest corrective decline.
Support levels: 2,668.80 2,655.65 2,644.10
Resistance levels: 2,685.45 2,700.00 2,715.00
What is not known is how cold it gets and how much demand there will be in the short term. And that’s why this is such a volatile contract because it’s focused on the short term more than anything else. It’s also influenced by the futures markets, which is actually where natural gas is traded, not the CFD markets. So, you are currently trading the forward month, which is going to be focusing on colder weather than we have right now, which is why the price has elevated.
This lasts for a while, and then sometime in the middle of winter, they start pricing in spring, which means less demand and the market rolls over. Yet again, this is a cyclical trade, nothing more, nothing less. At this point in time, if we do pull back, there’s probably value to be had, but it’s not something you go all in on.
For a look at all of today’s economic events, check out our economic calendar.
By Mahmoud Abdallah
Reviewer Adam Lemon
Fact-checker DailyForex.com Team
To put the developments in perspective, this is the largest monthly decline in the French CPI in more than 34 years.
Faced with such data, the ECB has limited ammunition to justify keeping its key interest rates at current levels, and two more rate cuts are now likely in 2024. Overall, the early realization that the ECB can now “outperform” the US Federal Reserve, and the Bank of England explains why the euro is under pressure. Key to the euro outlook will be the tone of the ECB’s guidance on future policy decisions. “Dovish guidance (growth versus inflation, door open for December?) poses a downside risk to the euro,” says Kenneth Brooks, analyst at Société Générale.
Consistently, the ECB has stressed that its policy stance will depend on the nature of the incoming data, which conveys a sense of restraint. However, the data is clear that the battle against inflation in France has been won, especially given last week’s announcement that the new government will seek to save €60 billion next year, which would create a significant drop in French demand.
Meanwhile, the German economy has stagnated, which is why Bundesbank President Joachim Nagel said last week that he was open to considering another interest rate cut at the ECB meeting. He said that German economic growth in the second half would be weaker than expected. According to the economic calendar, the data released confirmed that the annual inflation rate in Spain fell by 0.6% month-on-month in September, and the annual rate reached 1.5%. As for the eurozone as a whole, annual inflation was reported at 1.8% in September 2024, down from 2.2% in August. The last straw for the ECB “hawks” – those who want to remain cautious when considering interest rate cuts – is that service inflation remains relatively high at 4%. There is an argument that service inflation needs to fall further before we can bring overall inflation below 2.0% sustainably. However, services inflation is often seen as a lagging indicator, and the overwhelming decline in headline inflation will eventually lead to a pullback in the coming months.

EUR/USD also fell as interest rates in the US remain higher than those in Europe. Also, It fell on growing hopes that Donald Trump will win the US election in November. In an interview with Bloomberg on Tuesday, Trump reiterated his threat to impose more tariffs, opening the door to more global tensions.
On the daily chart, EUR/USD formed a double top pattern at 1.1200, and recently moved below the neckline at 1.100. also, It broke below key support at 1.0980, the highest level since March 2024. The pair moved below the 50-day and 100-day EMAs. Meanwhile, the MACD and RSI pointed to the downside.
Ready to trade Forex daily analysis and predictions? We’ve shortlisted the best European brokers in the industry for you.
Following a consolidation phase near 1.3100 in the Asian session on Wednesday, GBP/USD turned south and touched its lowest level since August 20 below 1.3000. The pair could continue to stretch lower in the near term, with markets reassessing the Bank of England’s (BoE) policy outlook after soft inflation readings.
The UK’s Office for National Statistics (ONS) reported that annual inflation in the UK, as measured by the change in the Consumer Price Index (CPI), softened to 1.7% in September from 2.2% in August. This reading came in below the market expectation of 1.9%. Additionally, the Producer Price Index (PPI) – Input declined by 2.3% on a yearly basis. Finally, the Retail Price Index rose 2.7% (YoY), down sharply from the 3.5% increase recorded in August.
According to Reuters, markets are currently pricing in a 70% probability of the BoE opting for two consecutive 25 basis points (bps) rate cuts in November and December, compared to a less-than-50% probability ahead of the release of the UK inflation data.
The US economic calendar will not feature any data releases that could influence the US Dollar’s (USD) valuation in the second half of the day. Hence, the negative impact of the UK inflation data on Pound Sterling could continue to dominate GBP/USD’s action.
The Relative Strength Index (RSI) on the 4-hour chart edged slightly higher after testing 30 when GBP/USD dropped below 1.3000. This technical development suggests that the pair’s bearish bias remains intact while investors allow for a technical correction before the next leg lower.
Once 1.3000 (round level, static level) is confirmed as resistance, 1.2940 (static level) and 1.2900 (static level, round level) could be seen as next support levels. If the pair stabilizes above 1.3000, resistance levels could be spotted at 1.3050 (static level) and 1.3080 (50-period Simple Moving Average).
The Pound Sterling (GBP) is the oldest currency in the world (886 AD) and the official currency of the United Kingdom. It is the fourth most traded unit for foreign exchange (FX) in the world, accounting for 12% of all transactions, averaging $630 billion a day, according to 2022 data. Its key trading pairs are GBP/USD, also known as ‘Cable’, which accounts for 11% of FX, GBP/JPY, or the ‘Dragon’ as it is known by traders (3%), and EUR/GBP (2%). The Pound Sterling is issued by the Bank of England (BoE).
The single most important factor influencing the value of the Pound Sterling is monetary policy decided by the Bank of England. The BoE bases its decisions on whether it has achieved its primary goal of “price stability” – a steady inflation rate of around 2%. Its primary tool for achieving this is the adjustment of interest rates. When inflation is too high, the BoE will try to rein it in by raising interest rates, making it more expensive for people and businesses to access credit. This is generally positive for GBP, as higher interest rates make the UK a more attractive place for global investors to park their money. When inflation falls too low it is a sign economic growth is slowing. In this scenario, the BoE will consider lowering interest rates to cheapen credit so businesses will borrow more to invest in growth-generating projects.
Data releases gauge the health of the economy and can impact the value of the Pound Sterling. Indicators such as GDP, Manufacturing and Services PMIs, and employment can all influence the direction of the GBP. A strong economy is good for Sterling. Not only does it attract more foreign investment but it may encourage the BoE to put up interest rates, which will directly strengthen GBP. Otherwise, if economic data is weak, the Pound Sterling is likely to fall.
Another significant data release for the Pound Sterling is the Trade Balance. This indicator measures the difference between what a country earns from its exports and what it spends on imports over a given period. If a country produces highly sought-after exports, its currency will benefit purely from the extra demand created from foreign buyers seeking to purchase these goods. Therefore, a positive net Trade Balance strengthens a currency and vice versa for a negative balance.
By Mahmoud Abdallah
Reviewer Adam Lemon
Fact-checker DailyForex.com Team
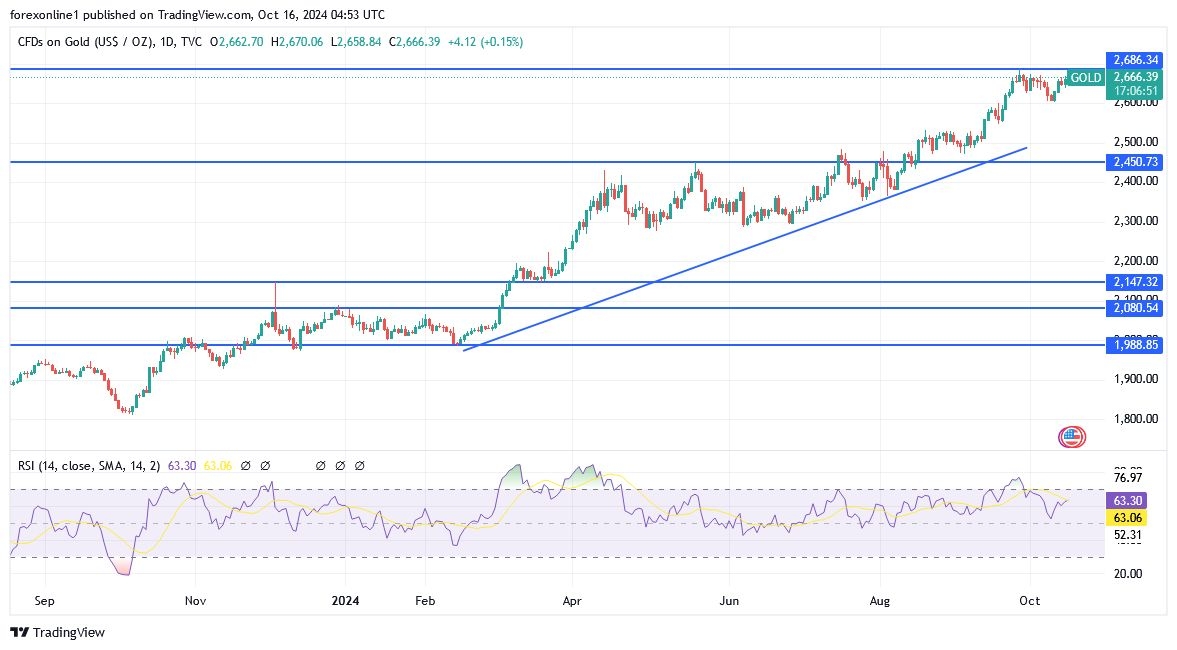
According to gold trading companies’ platforms, gold prices on the Comex exchange have been hovering around $2,600 per ounce during the past few sessions, with the upward movement pausing.
Gold prices have been struggling to surpass their September peak, when prices rose to $2,696.90 per ounce. Recently, the US dollar has risen sharply over the past few sessions as investors expect the US Federal Reserve to not cut interest rates by a larger amount like its previous meeting. In the United States, rising inflation and a resilient Labor market have reduced bets on further cuts in interest rates by the Federal Reserve.
Now, investors expect the Fed to cut US interest rates by 25 basis points at its November meeting. In September, the US central bank cut rates by 50 basis points, surprising financial and commodity markets. The US dollar extended its gains the previous week, hitting its highest level in more than two months, after Federal Reserve Governor Christopher Waller urged “more caution” about future rate cuts, citing recent economic data. Waller added: “Whatever happens in the near term, my baseline continues to call for gradual rate cuts over the next year.”
Also, gold bulls are facing some pressure from easing tensions in the Middle East as the world awaits Israel’s response to Iran after the latter attacked Tel Aviv on October 1st. As a result, gold prices are likely to face some headwinds after the Washington Post reported that Israeli Prime Minister Benjamin Netanyahu told the United States that Israel would target the Iranian military, not nuclear or oil facilities. Furthermore, the report indicates that there will be a more limited counterstrike aimed at preventing a wider war. However, there has been no escalation so far since Iran launched ballistic missiles towards Israel on October 1st. Ultimately, this has somewhat eased tensions in the region.
According to gold analysts today, gold prices enjoy support above the 21-day simple moving average (SMA) at $2,635 per ounce for the rest of this week. The 14-day Relative Strength Index (RSI) is flat, indicating that any decline in prices may be a good buying opportunity for traders.
If gold prices rebound from their current slumber, the next target could be around $2,700 per ounce. Conversely, immediate support is seen at the 21-day simple moving average at $2,632, which will test the three-week low near the $2600 threshold below. Overall, a sustained break below the latter could extend to the downside towards the September 20 low of $2585 per ounce.
Ready to trade today’s Gold Analysis? Here are the best brokers for Gold Trading to choose from.
By Mahmoud Abdallah
Reviewer Adam Lemon
Fact-checker DailyForex.com Team
In addition, September inflation slightly beat expectations, prompting traders to scale back their expectations for a significant rate cut by the Federal Reserve. Recently, the US Fed began its easing cycle with an aggressive 50 basis point cut at its September meeting. Markets are currently pricing in an 89% chance of a 25-basis point rate cut in November, with a total of 45 basis points of easing expected for the rest of the year.
According to forex trading, the US dollar index, which measures the greenback against six other currencies, was last at 103.18, just below Monday’s peak of 103.36 – its highest since August 8. The index has risen 2.5% and looks poised to end a three-month slide.
The boost for the US dollar came after comments from Federal Reserve Governor Christopher Waller on Monday, who urged a cautious approach to future interest rate cuts, citing recent economic data. Waller stated, “Whatever happens in the near term, my baseline is still for a gradual reduction in the federal funds rate over the next year.” Waller also noted that recent hurricanes and the Boeing strike could complicate job market data, potentially reducing October’s monthly job gains by more than 100,000 jobs. Moreover, the next non-farm payrolls report is scheduled for early November.
Commenting on this, Chris Weston, head of research at Pepperstone, said: “Most people were aware that the recent disruptions would mess up the US non-farm payrolls print, but Waller’s comment goes a long way in defining the type of disruption we can expect. Basically, with the next non-farm payrolls data distorted, markets won’t have the same level of pricing risk control going into the November FOMC meeting.”
Overall, the recent rise in the US dollar has been negative for the Japanese yen, especially after the dovish turn from Bank of Japan Governor Kazuo Ueda and the unexpected resistance to further interest rate hikes from new Prime Minister Shigeru Ishiba. Also, these developments have raised questions about the timing of future policy tightening by the BOJ.
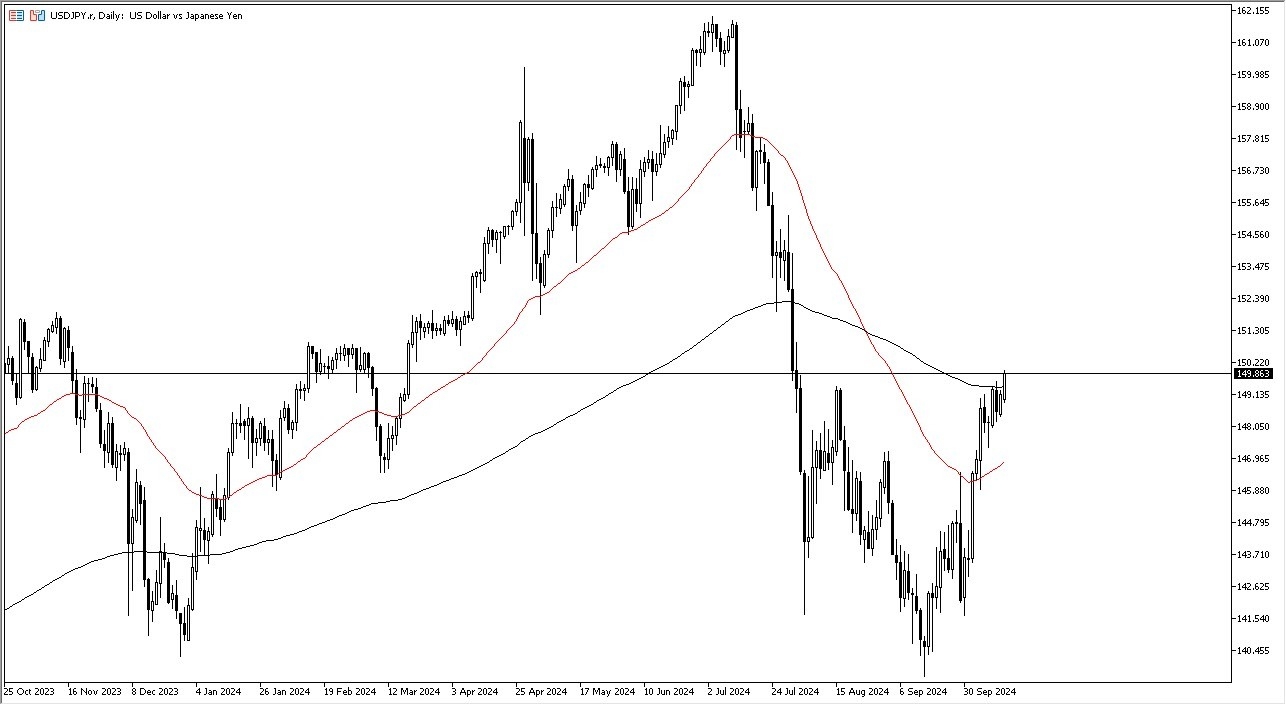
In early trade, the yen was at 149.55 yen per dollar, after hitting a two-and-a-half-month high of 149.98 yen on Monday, a day when Japan was closed for a holiday. Furthermore, the yen last touched 150 yen on Aug. 1. Meanwhile, China’s offshore yuan was little changed at 7.0935 dollars, after a report by Caixin Global suggested China could issue an additional 6 trillion yuan (about $850 billion) in treasury bonds over the next three years to stimulate its slowing economy.
Today, the upward shift in the USD/JPY price is still ongoing and breaking the psychological resistance 150.00 confirms the bulls’ strong control over the trend. After that, the technical indicators will move towards strong overbought levels if the bulls succeed in moving strongly towards the resistance levels 150.85 and 151.60 respectively. Technically, the trend will remain upward until the support 146.50 is successfully broken.
Ready to trade our USD/JPY forex forecast? Here are the best forex brokers in Japan to choose from.
A break above this level could signal a bullish breakout, pushing prices toward the next resistance at $1.30931, and potentially higher to $1.31128 or $1.31321.
However, immediate support lies at $1.30338, and a fall below could push the pair toward $1.30132.
For now, the price action remains neutral, with traders keeping an eye on a potential breakout. A bullish move above $1.30666 could shift sentiment toward the upside.
The euro remains steady as German wholesale prices declined by 0.3%, slightly better than the prior 0.8% drop. Meanwhile, French final CPI held at -1.2%, reflecting ongoing deflationary pressures.
Investors are now focusing on Germany’s ZEW Economic Sentiment report, expected at 10.2, and Eurozone Industrial Production, forecasted to rise by 1.8%. These key indicators will shape the euro’s short-term trajectory.
The EUR/USD is trading at $1.08916, with a bearish tone as it remains within a downward channel. Immediate support is seen at $1.08852, and a break below could push prices toward $1.08666.
So ultimately, I think you’ve got a scenario where this pair does eventually rise quite a bit. In fact, I would anticipate that it ends up reaching toward the 153.50 yen level, although that probably takes some time. While this pair can move quickly, there is a real concern in the buyers as we recently have seen such a wipeout.
For what it is worth, it looks like the bond market is now calling for more inflation. And as rates start to rise in the bond market, that makes the US dollar that much more attractive. I have no interest whatsoever in trying to short this pair. And I think you’ve got a scenario where traders will continue to look at this as a market that is returning to the previous carry trade. This of course will continue to see interest as the payment at the end of every day is something that a lot of people will be paying attention to.
Underneath, we have the 50-day EMA near the 147-yen level, which I think offers a bit of a floor at the moment and will continue to be something worth noting. I have no interest in shorting this pair until we break down below that indicator at the very least. It just doesn’t look very feasible. This is a situation where the market is building up a lot of momentum, and this pair often will thrive on that very momentum.
Ready to trade our USD/JPY forex forecast? Here are the best forex brokers in Japan to choose from.
Gold price is building on the previous recovery early Wednesday, challenging the static resistance level at $2,670. Gold buyers stay optimistic amid a bullish technical setup on the daily time frame and broad risk aversion.
Skepticism surrounding the Chinese fiscal stimulus grows, as investors remain expectant of details on the plans announced by China’s Finance Minister last Saturday. This coupled with a sharp slowdown in China’s exports amplifies the economic concerns, intensifying risk-off flows across the financial markets in Asia so far this Wednesday.
Risk aversion extended into Asia, following a steep sell-off in the European and Wall Street stocks after disappointing earnings from Europe’s biggest tech firm ASML dragged chip stocks around the world.
Additionally, investors remain wary, as the US Federal Reserve (Fed) is expected to adopt a modest interest-rate cut path.
Recent Fed commentary continues to suggest that a 25 basis points (bps) rate cut is likely to be the outcome in November. Atlanta Fed President Raphael Bostic said late Tuesday that “my dot was 25 basis points more in 2024 beyond the September 50 basis point cut.”
San Francisco Fed President Mary Daly noted on Tuesday that “if inflation wanes along the lines central bankers expect, I think one or two [rate cuts] this year would be a reasonable thing” for the central bank to implement.”
However, less dovish Fed commentary fails to threaten the Gold price recovery, as investors run for cover in the traditional safe haven on growing uncertainty from China. Further, the US Dollar (USD) struggles to sustain its ongoing uptrend amid recent declines in the US Treasury bond yields, helping Gold price attempt another run toward the record high of $2,686.
All eyes now turn to Thursday when China will hold a press conference to discuss promoting the “steady and healthy” development of the property sector. Also, the US Retail Sales report will go hog the limelight on Thursday, in the absence of high-impact economic data releases from the US in the first half of this week.
In the meantime, China worries will likely dominate risk trends, which could continue to impact the value of the US Dollar, eventually influencing the USD-sensitive Gold price. The bright metal could also take cues from the ongoing geopolitical escalation between Israel and Iran. Israeli Prime Minister Benjamin Netanyahu told French President Emmanuel Macron that he would not agree to a ceasefire deal that failed to stop Hezbollah from rearming and regrouping.
Gold price extends the upswing above the key 21-day Simple Moving Average (SMA) support, now at $2,640, as buyers regain control.
The 14-day Relative Strength Index (RSI), points north above the midline, suggesting that more gains remain in the offing.
Gold price needs acceptance above the key $2,670 resistance on a daily candlestick closing basis to take on the record high at $2,686.
Further up, the $2,700 round level will be tested.
On the flip side, the immediate support is seen at the 21-day SMA at $2,640, below which the three-week lows near the $2,600 threshold will be tested.
A sustained break below the latter could extend the downside toward the September 20 low of $2,585.
Gold has played a key role in human’s history as it has been widely used as a store of value and medium of exchange. Currently, apart from its shine and usage for jewelry, the precious metal is widely seen as a safe-haven asset, meaning that it is considered a good investment during turbulent times. Gold is also widely seen as a hedge against inflation and against depreciating currencies as it doesn’t rely on any specific issuer or government.
Central banks are the biggest Gold holders. In their aim to support their currencies in turbulent times, central banks tend to diversify their reserves and buy Gold to improve the perceived strength of the economy and the currency. High Gold reserves can be a source of trust for a country’s solvency. Central banks added 1,136 tonnes of Gold worth around $70 billion to their reserves in 2022, according to data from the World Gold Council. This is the highest yearly purchase since records began. Central banks from emerging economies such as China, India and Turkey are quickly increasing their Gold reserves.
Gold has an inverse correlation with the US Dollar and US Treasuries, which are both major reserve and safe-haven assets. When the Dollar depreciates, Gold tends to rise, enabling investors and central banks to diversify their assets in turbulent times. Gold is also inversely correlated with risk assets. A rally in the stock market tends to weaken Gold price, while sell-offs in riskier markets tend to favor the precious metal.
The price can move due to a wide range of factors. Geopolitical instability or fears of a deep recession can quickly make Gold price escalate due to its safe-haven status. As a yield-less asset, Gold tends to rise with lower interest rates, while higher cost of money usually weighs down on the yellow metal. Still, most moves depend on how the US Dollar (USD) behaves as the asset is priced in dollars (XAU/USD). A strong Dollar tends to keep the price of Gold controlled, whereas a weaker Dollar is likely to push Gold prices up.
Today’s low almost reached the prior trend high from September 17. That high was 2.44, close to the 50% retracement level at 2.45. Given the intraday bullish reaction, today’s low could hold and lead to a continuation of the bounce and therefore mark a possible completion of the retracement. If it does, the next sign of strength would be a rally above today’s high of 2.55.
Natural gas would then be heading up into resistance zone starting around the prior retracement low of 2.59. Further, the 20-Day MA, now at 2.68, also marks a potential key resistance area and it has converged with the internal uptrend line. It also points to the prior trend high and beginning of a gap at 2.67.
Nonetheless, a breakdown of the near-term trend was indicated yesterday as natural gas fell below the uptrend line and further below the 20-Day MA. The 20-Day line was broken and confirmed with a daily close below the line on Friday. Since the 20-Day MA was broken it opens the door to the possibility of reaching the 50-Day MA. The 50-Day line is now at 2.38.
It sits between two retracement levels. The first price level was reached today at the 50% retracement, and the next potential lower target would be the 61.8% Fibonacci retracement at 2.31. A little below the 2.31 level is the 200-Day MA at 2.52 currently.
Given the natural gas continues to trade inside a consolidation pattern in the form of a large symmetrical triangle the chance for further downside and choppy moves seems possible. The top side of the pattern was hit early this month leading to the current retracement. Therefore, a swing to the other side of the pattern, the bottom, remains a possibility.
For a look at all of today’s economic events, check out our economic calendar.