The main category of Forex News.
You can use the search box below to find what you need.
[wd_asp id=1]
The main category of Forex News.
You can use the search box below to find what you need.
[wd_asp id=1]
Gold price is marginally higher on Tuesday, pressuring the weekly high and trading not far from the record posted in September at $2,685.45 a troy ounce. The bright metal benefits from a risk-averse mood and easing US Dollar’s demand, albeit the latter is far from turning bearish.
As the United States (US) macroeconomic calendar remained scarce, speculative interest took clues from equities. Wall Street hit record highs on Monday, but the positive momentum faded in Asia, as falling oil prices undermined the energy sector, while tech shares were also on the back foot. Chinese stocks were also pressured amid disappointing local data and concerns about the economic health of the Asian giant.
As a result, European indexes closed in the red, while US ones are also down. Meanwhile, Crude Oil prices eased after Israeli Prime Minister Benjamin Netanyahu told the US that Israel would strike the Iranian military, not nuclear or oil targets, reducing the market’s concerns about the oil supply.
Multiple Federal Reserve (Fed) officials were on the wires but have provided no fresh clues about where the monetary policy is heading next. For the most, their speeches have been neutral, meaning neither dovish nor hawkish enough to hint at a change in the current view that the central bank will deliver 25 basis points (bps) interest rate cuts in the upcoming meetings.
The daily chart for XAU/USD shows buyers defended the downside at around a bullish 20 Simple Moving Average (SMA), currently at around $2,638. The 100 and 200 SMAs also head north far below the shorter one, in line with the bulls’ dominance. Finally, the Momentum indicator is hovering around its 100 line, while the Relative Strength Index (RSI) indicator turned modestly higher at around 62, also supportive of the bullish case.
The near-term picture shows a limited upward momentum, but the risk remains skewed to the upside. XAU/USD develops above a flat 100 SMA, while the 20 SMA is currently crossing above it, reflecting increased buying interest. Technical indicators, however, have lost their upward strength, holding anyways well above their midlines. Overall, chances are of fresh record highs, particularly if the $2,638.00 level holds.
Support levels: 2,654.90 2,638.00 2,625.40
Resistance levels: 2,673.10 2,685.45 2,700.00
Image © Adobe Images
The British Pound will come under pressure if UK services inflation lands below 5.2% on Wednesday.
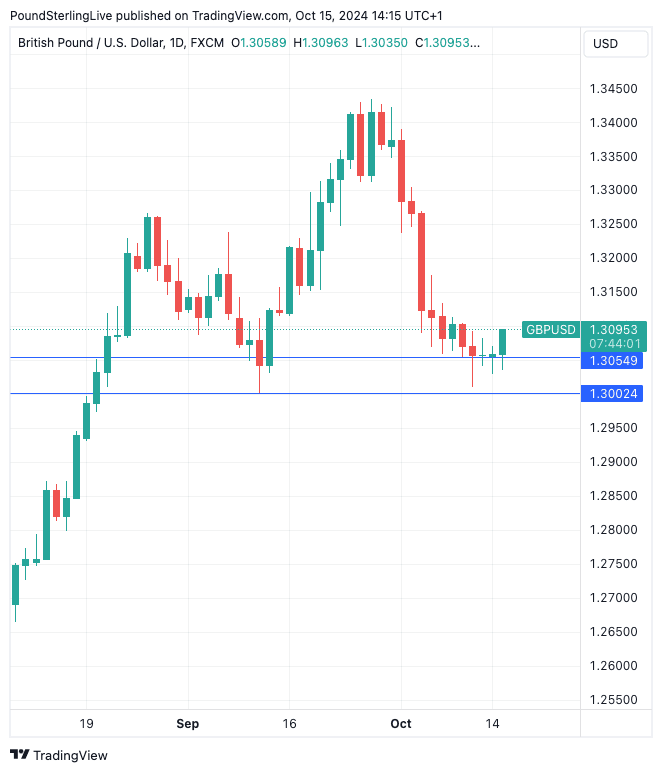
Ahead of the inflation figures, the Pound to Dollar exchange rate (GBP/USD) has found support at a key support level of 1.3054 and is putting in a decent daily bounce.
Gains come amidst a surge in U.S. stocks following some positive earnings from a number of big Wall Street names, suggesting the recent easing in expectations for Federal Reserve rate cuts is no impediment to the bulls.
The natural FX market reaction when risk ‘is on’ is to buy Dollars.

However, for now, GBP/USD’s rise is a counter-trend bounce, and the risks remain tilted to the downside as it could be too soon to call the end of the October selloff.
This is confirmed by analyst Robert Howard at Reuters, who thinks the midweek release of UK inflation is a particular risk to GBP/USD.
“Sterling might extend south towards 1.28 if UK inflation data comes in cooler than expected on Wednesday, as this would raise the risk of the Bank of England cutting interest rates twice before Christmas,” he says in a note to clients.
UK inflation is expected to dip below 2.0% again, but this will be thanks to the decline in oil prices through to September.
Instead, the key driver of any FX market reaction will be on which side of 5.2% services inflation lands.
Should inflation come in below 5.2%, the Pound could come under pressure against the Dollar.
GBP/USD investment bank consensus forecasts: The end-2024 and 2025 guide from Corpay has been released. It shows a sizeable uplift was made to the consensus forecasts for GBP/USD. Please request a copy here.
The data comes two weeks after Bank of England Governor Andrew Bailey surprised markets by saying the Bank could be more “activist” when considering interest rates cuts.
However, he qualified with the remark that any such shift would depend on the nature of the inflation data.
Markets now see a 50% chance of the Bank delivering consecutive 25 basis point rate cuts on Nov. 7 and Dec. 19. Pricing for December will rise in the event of a soft set of data, which would pressure the Pound.
“GBP/USD, which was last at 1.2800 in mid-August, plumbed a one-month low of 1.3011 last Thursday – a week after Bailey’s dovish guidance hit the pound hard,” says Howard.
In Japan, Prime Minister Shigeru Ishiba said earlier this month that current economic conditions may not warrant additional interest rate hikes. However, other senior Japanese officials later softened the prime minister’s comments, with Chief Cabinet Secretary Yoshimasa Hayashi saying that Ishiba did not make any specific request to Bank of Japan Governor Kazuo Ueda during their meeting.
According to stock trading platforms, the Nikkei index in Japan jumped to its highest level in 12 weeks.
The Nikkei 225 Japanese stock index rose 1% to around 40,000 points in post-holiday trading on Tuesday, hitting its highest level in 12 weeks, drawing strength from a strong advance in US stock markets on Wall Street overnight as the Dow Jones and S&P 500 reached new record highs. Also, the broader TOPIX index rose 0.8% to 2728, its highest level in a week.
The weakness of the Japanese yen also boosted domestic stocks, as senior Japanese officials called for caution before raising interest rates further, while the US Federal Reserve is expected to adopt a more modest approach to cutting interest rates. According to the trades, technology stocks led the charge, with strong gains in shares of SoftBank Group (5.8%), Lazertec (3.2%), Disco (1.8%), Tokyo Electron (3.2%), and Advantest (2.9%). Heavyweight financial stocks also advanced, including shares of Mitsubishi UFJ (1.8%), Sumitomo Mitsui (2.4%), and Mizuho Financial (2.6%).

Based on the performance on the daily chart below, the USD/JPY price is still on an upward trajectory and as I mentioned before, a move above the psychological resistance of 150.00 will be important for bulls to control the trend. Technically, the next most important peak for the rise will be 152.30. On the other hand, and in the same time frame, a move below the 145.90 level will be important for bears to regain control. Ultimately, the USD/JPY rate will remain subject to signals from global central bankers and investors’ risk appetite.
Ready to trade our USD/JPY forex forecast? Here are the best forex brokers in Japan to choose from.
Following a quiet start to the week, EUR/USD came under modest bearish pressure in the American session on Monday and closed the day in negative territory. The pair struggles to stage a rebound early Tuesday and trades at its lowest level since early August, slightly below 1.0900.
The table below shows the percentage change of Euro (EUR) against listed major currencies last 7 days. Euro was the weakest against the US Dollar.
| USD | EUR | GBP | JPY | CAD | AUD | NZD | CHF | |
|---|---|---|---|---|---|---|---|---|
| USD | 0.63% | 0.05% | 0.58% | 1.38% | 0.69% | 0.70% | 0.85% | |
| EUR | -0.63% | -0.56% | -0.03% | 0.75% | 0.07% | 0.06% | 0.21% | |
| GBP | -0.05% | 0.56% | 0.55% | 1.30% | 0.64% | 0.62% | 0.78% | |
| JPY | -0.58% | 0.03% | -0.55% | 0.90% | 0.11% | 0.09% | 0.26% | |
| CAD | -1.38% | -0.75% | -1.30% | -0.90% | -0.67% | -0.66% | -0.53% | |
| AUD | -0.69% | -0.07% | -0.64% | -0.11% | 0.67% | -0.02% | 0.15% | |
| NZD | -0.70% | -0.06% | -0.62% | -0.09% | 0.66% | 0.02% | 0.16% | |
| CHF | -0.85% | -0.21% | -0.78% | -0.26% | 0.53% | -0.15% | -0.16% |
The heat map shows percentage changes of major currencies against each other. The base currency is picked from the left column, while the quote currency is picked from the top row. For example, if you pick the Euro from the left column and move along the horizontal line to the US Dollar, the percentage change displayed in the box will represent EUR (base)/USD (quote).
In the absence of high-impact macroeconomic data releases, the cautious market mood helped the US Dollar (USD) stay resilient against its major rivals on Monday, causing EUR/USD to edge lower.
Early Tuesday, US stock index futures trade marginally lower on the day, suggesting that the market mood is yet to improve.
In the European session, Eurostat will publish Industrial Production data for August and Germany’s ZEW economic research institute will release October sentiment data for the Eurozone and Germany. The ZEW Survey – Economic Sentiment Index is forecast to rise both for the Eurozone and Germany. If these data surprise to the upside, the immediate reaction could help the Euro find support. Nevertheless, investors are unlikely to take large positions ahead of the European Central Bank’s (ECB) policy announcements due Thursday.
In the second half of the day, the Federal Reserve Bank of New York’s Empire State Manufacturing Index for October will be the only data release from the US, which is unlikely to trigger a noticeable market reaction.
The Relative Strength Index (RSI) indicator on the 4-hour chart edged slightly higher after dropping to 30, suggesting that EUR/USD’s near-term technical outlook remains bearish, with the possibility of a technical correction.
On the downside, 1.0870 (Fibonacci 78.6% retracement of the latest uptrend) aligns as first support before 1.0800 (round level) and 1.0780 (static level, beginning point of the uptrend). In case EUR/USD rises above 1.0900 (static level) and starts using this level as support, 1.0950 (Fibonacci 61.8% retracement) and 1.1000 (Fibonacci 50% retracement) could be seen as next resistance levels.
The Euro is the currency for the 19 European Union countries that belong to the Eurozone. It is the second most heavily traded currency in the world behind the US Dollar. In 2022, it accounted for 31% of all foreign exchange transactions, with an average daily turnover of over $2.2 trillion a day. EUR/USD is the most heavily traded currency pair in the world, accounting for an estimated 30% off all transactions, followed by EUR/JPY (4%), EUR/GBP (3%) and EUR/AUD (2%).
The European Central Bank (ECB) in Frankfurt, Germany, is the reserve bank for the Eurozone. The ECB sets interest rates and manages monetary policy. The ECB’s primary mandate is to maintain price stability, which means either controlling inflation or stimulating growth. Its primary tool is the raising or lowering of interest rates. Relatively high interest rates – or the expectation of higher rates – will usually benefit the Euro and vice versa. The ECB Governing Council makes monetary policy decisions at meetings held eight times a year. Decisions are made by heads of the Eurozone national banks and six permanent members, including the President of the ECB, Christine Lagarde.
Eurozone inflation data, measured by the Harmonized Index of Consumer Prices (HICP), is an important econometric for the Euro. If inflation rises more than expected, especially if above the ECB’s 2% target, it obliges the ECB to raise interest rates to bring it back under control. Relatively high interest rates compared to its counterparts will usually benefit the Euro, as it makes the region more attractive as a place for global investors to park their money.
Data releases gauge the health of the economy and can impact on the Euro. Indicators such as GDP, Manufacturing and Services PMIs, employment, and consumer sentiment surveys can all influence the direction of the single currency. A strong economy is good for the Euro. Not only does it attract more foreign investment but it may encourage the ECB to put up interest rates, which will directly strengthen the Euro. Otherwise, if economic data is weak, the Euro is likely to fall. Economic data for the four largest economies in the euro area (Germany, France, Italy and Spain) are especially significant, as they account for 75% of the Eurozone’s economy.
Another significant data release for the Euro is the Trade Balance. This indicator measures the difference between what a country earns from its exports and what it spends on imports over a given period. If a country produces highly sought after exports then its currency will gain in value purely from the extra demand created from foreign buyers seeking to purchase these goods. Therefore, a positive net Trade Balance strengthens a currency and vice versa for a negative balance.
GBP/USD fluctuated in a narrow range on Monday and closed the day virtually unchanged. The pair edges slightly higher in the European morning on Tuesday and trades above 1.3050.
The table below shows the percentage change of British Pound (GBP) against listed major currencies today. British Pound was the strongest against the Australian Dollar.
| USD | EUR | GBP | JPY | CAD | AUD | NZD | CHF | |
|---|---|---|---|---|---|---|---|---|
| USD | 0.00% | -0.10% | -0.48% | 0.11% | 0.22% | 0.13% | -0.21% | |
| EUR | -0.01% | -0.10% | -0.49% | 0.08% | 0.22% | 0.10% | -0.19% | |
| GBP | 0.10% | 0.10% | -0.37% | 0.21% | 0.32% | 0.21% | -0.05% | |
| JPY | 0.48% | 0.49% | 0.37% | 0.59% | 0.68% | 0.58% | 0.30% | |
| CAD | -0.11% | -0.08% | -0.21% | -0.59% | 0.11% | 0.02% | -0.26% | |
| AUD | -0.22% | -0.22% | -0.32% | -0.68% | -0.11% | -0.10% | -0.36% | |
| NZD | -0.13% | -0.10% | -0.21% | -0.58% | -0.02% | 0.10% | -0.28% | |
| CHF | 0.21% | 0.19% | 0.05% | -0.30% | 0.26% | 0.36% | 0.28% |
The heat map shows percentage changes of major currencies against each other. The base currency is picked from the left column, while the quote currency is picked from the top row. For example, if you pick the British Pound from the left column and move along the horizontal line to the US Dollar, the percentage change displayed in the box will represent GBP (base)/USD (quote).
The data published by the UK’s Office for National Statistics (ONS) showed early Tuesday that the ILO Unemployment Rate eased to 4.0% in the three months to August, following July’s 4.1% reading. Additional details of the report showed the Employment Change data for August arrived at 373K, compared to 265k reported in July. Finally, wage inflation, as measured by the changed in the Average Earnings excluding Bonus, softened to 4.9% from 5.1%. These readings seem to be helping Pound Sterling find a foothold.
The economic calendar will not offer any high-impact data releases from the US on Tuesday. Early Wednesday, the ONS will release September inflation data for the UK. Hence, investors could opt to wait until they see Consumer Price Index (CPI) figures before taking large positions.
Meanwhile, US stock index futures trade mixed in the European session. In case Wall Street’s main indexes turn south after the opening bell, the USD could benefit from safe-haven flows and make it difficult for GBP/USD to extend its recovery.
The Relative Strength Index (RSI) indicator on the 4-hour chart stays slightly above 50, reflecting a loss of bearish momentum in the near term. Looking north, first resistance could be spotted at 1.3100 (Fibonacci 78.6% retracement level of the latest uptrend) before 1.3170-1.3185 (Fibonacci 61.8% retracement, 200-period Simple Moving Average).
On the downside, 1.3050 (static level) aligns as interim support ahead of 1.3000 (round level, static level) and 1.2940 (static level).
The Pound Sterling (GBP) is the oldest currency in the world (886 AD) and the official currency of the United Kingdom. It is the fourth most traded unit for foreign exchange (FX) in the world, accounting for 12% of all transactions, averaging $630 billion a day, according to 2022 data. Its key trading pairs are GBP/USD, also known as ‘Cable’, which accounts for 11% of FX, GBP/JPY, or the ‘Dragon’ as it is known by traders (3%), and EUR/GBP (2%). The Pound Sterling is issued by the Bank of England (BoE).
The single most important factor influencing the value of the Pound Sterling is monetary policy decided by the Bank of England. The BoE bases its decisions on whether it has achieved its primary goal of “price stability” – a steady inflation rate of around 2%. Its primary tool for achieving this is the adjustment of interest rates. When inflation is too high, the BoE will try to rein it in by raising interest rates, making it more expensive for people and businesses to access credit. This is generally positive for GBP, as higher interest rates make the UK a more attractive place for global investors to park their money. When inflation falls too low it is a sign economic growth is slowing. In this scenario, the BoE will consider lowering interest rates to cheapen credit so businesses will borrow more to invest in growth-generating projects.
Data releases gauge the health of the economy and can impact the value of the Pound Sterling. Indicators such as GDP, Manufacturing and Services PMIs, and employment can all influence the direction of the GBP. A strong economy is good for Sterling. Not only does it attract more foreign investment but it may encourage the BoE to put up interest rates, which will directly strengthen GBP. Otherwise, if economic data is weak, the Pound Sterling is likely to fall.
Another significant data release for the Pound Sterling is the Trade Balance. This indicator measures the difference between what a country earns from its exports and what it spends on imports over a given period. If a country produces highly sought-after exports, its currency will benefit purely from the extra demand created from foreign buyers seeking to purchase these goods. Therefore, a positive net Trade Balance strengthens a currency and vice versa for a negative balance.
Gold price is trading modestly flat near $2,650 early Tuesday, licking its wounds after retreating from a six-day high of $2,667 set on Monday.
The tepid recovery attempt in Gold price is sponsored by a mild correction in the US Dollar (USD) against its major rivals from over two-month highs. Meanwhile, retreating US Treasury bond yields on renewed haven flows into the government bonds exert downward pressure on the USD, allowing Gold price buyers to briefly come up for air.
Amid a quiet Asian affair, China’s economic worries persist and dent risk sentiment. The latest data showed that Chinese exports grew at the slowest pace in five months in September. Further, a lack of specifics on China’s fiscal stimulus announced last Saturday remains a drag on investors’ confidence.
However, it remains to be seen if Gold price builds on the rebound, as markets continue to bet on a smaller – 25 basis points (bps) interest rate cut by the US Federal Reserve (Fed) in November, with a probability of such a move seen at about 86%, according to the CME Group’s FedWatch Tool.
The Greenback extended its previous week’s advance and hit its highest in over two months across its competitors after Fed Governor Christopher Waller said Monday urged “more caution” on rate cuts ahead, citing recent economic data. “Whatever happens in the near term, my baseline still calls for reducing the policy rate gradually over the next year,” Waller added.
Joining the chorus, Minneapolis Fed President Neel Kashkari said on Monday that the monetary policy is still in a restrictive stance, adding further “modest” rate cuts could be appropriate, per Reuters.
Also, Gold price could face headwinds from easing geopolitical tensions between Israel and Iran after the Washington Post (WaPo) cited two officials familiar with the matter, as saying that Israeli Prime Minister Benjamin Netanyahu told the US that Israel would strike Iranian military, not nuclear or oil, targets. The report suggests that there will be a more limited counterstrike aimed at preventing a full-scale war.
Attention now turns toward speeches from more Fed policymakers for fresh trading impetus in the US Dollar and the Gold price, as full markets return later in the American session on Tuesday. Gold traders could also resort to position adjustments ahead of Thursday’s US Retail Sales data release.
Gold price stays supported above the key 21-day Simple Moving Average (SMA) support, now at $2,635, so far this week.
The 14-day Relative Strength Index (RSI), however, holds firm above the midline, suggesting that any dip in Gold price could be a good buying opportunity in the near term.
If the Gold price recovers, the next bullish target is seen at the previous high of $2,667, followed by the intermittent high at $2,670.
Further up, the record high at $2,686 will come into play.
Conversely, the immediate support is seen at the 21-day SMA at $2,632, below which the three-week lows near the $2,600 threshold will be tested.
A sustained break below the latter could extend the downside toward the September 20 low of $2,585.
Gold has played a key role in human’s history as it has been widely used as a store of value and medium of exchange. Currently, apart from its shine and usage for jewelry, the precious metal is widely seen as a safe-haven asset, meaning that it is considered a good investment during turbulent times. Gold is also widely seen as a hedge against inflation and against depreciating currencies as it doesn’t rely on any specific issuer or government.
Central banks are the biggest Gold holders. In their aim to support their currencies in turbulent times, central banks tend to diversify their reserves and buy Gold to improve the perceived strength of the economy and the currency. High Gold reserves can be a source of trust for a country’s solvency. Central banks added 1,136 tonnes of Gold worth around $70 billion to their reserves in 2022, according to data from the World Gold Council. This is the highest yearly purchase since records began. Central banks from emerging economies such as China, India and Turkey are quickly increasing their Gold reserves.
Gold has an inverse correlation with the US Dollar and US Treasuries, which are both major reserve and safe-haven assets. When the Dollar depreciates, Gold tends to rise, enabling investors and central banks to diversify their assets in turbulent times. Gold is also inversely correlated with risk assets. A rally in the stock market tends to weaken Gold price, while sell-offs in riskier markets tend to favor the precious metal.
The price can move due to a wide range of factors. Geopolitical instability or fears of a deep recession can quickly make Gold price escalate due to its safe-haven status. As a yield-less asset, Gold tends to rise with lower interest rates, while higher cost of money usually weighs down on the yellow metal. Still, most moves depend on how the US Dollar (USD) behaves as the asset is priced in dollars (XAU/USD). A strong Dollar tends to keep the price of Gold controlled, whereas a weaker Dollar is likely to push Gold prices up.
USD/JPY trends will likely depend on this week’s trade and inflation data from Japan. Weaker trends could reduce expectations of a Q4 2024 BoJ rate hike. Delays to a BoJ rate hike could further impact Japanese Yen demand. However, US retail sales and jobless claims will influence sentiment toward the Fed rate path and US dollar demand.
Traders should stay alert as monetary policy chatter, Japan’s economic data, and the US economic indicators, which will affect trading USD/JPY strategies. Monitor real-time data, central bank views, and expert commentary to adjust your trading strategies accordingly. Stay ahead of the market with our expert insights.
The USD/JPY holds above the 50-day and 200-day EMAs, sending bullish price signals.
A USD/JPY return to 150 could signal a move toward the 151.685 resistance level and the trend line. Furthermore, a break above the 200-day EMA could support a move toward the trend line and the 151.685 resistance level. Selling pressure may increase at the resistance level. The trend line is confluent with the 151.685 resistance level.
Japan’s industrial production, US consumer inflation expectations, and central bank commentary require close monitoring.
Conversely, a drop below the 200-day EMA could bring the 148.529 support level into play. A fall through the 148.529 support level may signal a fall toward 147.5.
The 14-day RSI at 65.37 indicates a USD/JPY move to 151.685 resistance level before reaching overbought territory.
The USD/JPY extended its gains throughout the North American session, up 0.42%, and trading at 149.75 at the time of writing. The pair hit a two-month high of 149.98, though buyers lacked the force to crack the 150.00 figure.
The USD/JPY daily chart is neutral to upward biased after clearing key support levels.
Momentum, as measured by the Relative Strength Index (RSI), is bullish, with enough room to spare before turning overbought.
If USD/JPY clears the 150.00 figure, this could pave the way for challenging the 100 and 200-day moving averages (DMAs) each at 151.14 and 151.22. On further strength, the next stop would be the top of the Ichimoku Cloud (Kumo) at 152.00.
Conversely, if USD/JPY falls beneath the 149.50 mark, this could sponsor a test of the 149.00 mark. A breach of the latter will expose the October 8 low of 147.35, ahead of the Tenkan-Sen at 146.70.
The table below shows the percentage change of Japanese Yen (JPY) against listed major currencies today. Japanese Yen was the strongest against the Swiss Franc.
| USD | EUR | GBP | JPY | CAD | AUD | NZD | CHF | |
|---|---|---|---|---|---|---|---|---|
| USD | 0.31% | 0.10% | 0.45% | 0.17% | 0.42% | 0.27% | 0.68% | |
| EUR | -0.31% | -0.29% | 0.02% | -0.05% | 0.13% | -0.13% | 0.27% | |
| GBP | -0.10% | 0.29% | 0.31% | 0.09% | 0.45% | 0.19% | 0.53% | |
| JPY | -0.45% | -0.02% | -0.31% | -0.27% | 0.00% | -0.10% | 0.23% | |
| CAD | -0.17% | 0.05% | -0.09% | 0.27% | 0.19% | 0.13% | 0.33% | |
| AUD | -0.42% | -0.13% | -0.45% | -0.00% | -0.19% | -0.14% | 0.22% | |
| NZD | -0.27% | 0.13% | -0.19% | 0.10% | -0.13% | 0.14% | 0.34% | |
| CHF | -0.68% | -0.27% | -0.53% | -0.23% | -0.33% | -0.22% | -0.34% |
The heat map shows percentage changes of major currencies against each other. The base currency is picked from the left column, while the quote currency is picked from the top row. For example, if you pick the Japanese Yen from the left column and move along the horizontal line to the US Dollar, the percentage change displayed in the box will represent JPY (base)/USD (quote).
Spot Gold is under mild pressure on Monday, trading with modest losses after peaking at $2,666.71 earlier in the day. XAU/USD is stable at around $2,650 a troy ounce, as the positive tone of Wall Street limits the US Dollar (USD) demand. The Greenback, however, started the week with a firm footing amid persistent geopolitical tensions in the Middle East and news coming from China.
The Chinese Finance Minister Lan Fo’an offered a press conference over the weekend, but failed to provide details on additional support to the battered economy, leaving investors with a sour taste in their mouths. Additionally, Chinese data missed expectations, creating doubts about the economic future of the Asian giant.
Other than that, European equities posted modest gains as investors await clearer clues. This week, Canada and the United Kingdom (UK) will publish inflation updates, while the European Central Bank (ECB) will announce its decision on monetary policy next Thursday. In the meantime, Federal Reserve’s (Fed) officials will be on the wires and may or may not provide fresh clues on what the central bank may do next.
From a technical point of view, the daily chart for XAU/USD shows bulls may be a bit exhausted. The pair stands near its recent highs, but the Momentum indicator heads south and is currently crossing its midline into negative territory. The Relative Strength Index (RSI) indicator also turned lower but holds near overbought territory. At the same, the pair is developing above all its moving averages, which maintain moderated bullish slopes. Overall, the risk of a downward extension seems limited, yet bulls seem to have moved to the sidelines.
In the near term, and according to the 4-hour chart, the technical picture is quite similar. XAU/USD is finding intraday buyers around a flat 100 Simple Moving Average (SMA) while a mildly bullish 20 SMA advances below the longer one. Technical indicators, on the contrary, turned lower within positive levels, showing uneven bearish strength. The risk of a bearish continuation should increase on a break below the $2,636.00 region, the immediate support area.
Support levels: 2,363.00 2,325.40 2,603.90
Resistance levels: 2,661.20 2,673.10 2,685.45
In general, traders are now betting that the ECB will continue to cut costs by a quarter point at each meeting until March. Annual inflation in the Eurozone fell to 1.8% in September 2024, its lowest level since April 2021.
According to stock trading platforms, Eurozone stocks closed the week in the green. European stocks closed higher on Friday, benefiting from a positive start to the session for their North American counterparts, supported by a positive start to the US earnings season, while investors evaluated a range of economic data. The French budget for 2025, which includes spending cuts and tax increases on corporations, the wealthy, and energy, has also been under close scrutiny. The Stoxx 50 Eurozone index rose 0.7% to close at 5003, and the Stoxx 600 European index added 0.5% to close at 522. Shares of large industrial companies led the gains, with Siemens, Schneider, Airbus, and Safran adding between 4% and 1%. Bank and insurance stocks in the region also closed strongly in the green, with Munich Re and Intesa Sanpaolo adding more than 1% each. On the other hand, Stellantis shares fell by about 4% after announcing a series of changes in its leadership.
According to the economic calendar, with the ECB’s decisions awaited. In the United States, all eyes will be on retail sales, which are expected to show a 0.3% increase in September, up from a 0.1% increase in August. On the other hand, US industrial production is likely to contract by 0.1%, following a strong 0.8% increase in August.
On the other hand, US industrial production is likely to contract by 0.1%, after a strong increase of 0.8% in August. Other key economic data to follow include the Empire State Manufacturing Index in New York, the Philadelphia Fed Manufacturing Index, consumer inflation expectations, export and import prices, the National Association of Home Builders Housing Market Index, building permits and housing starts. Several US Federal Reserve officials are also scheduled to appear. In addition, the earnings season will be in full swing with several companies announcing quarterly results including UnitedHealth, J&J, Bank of America, Goldman Sachs, Citigroup, Charles Schwab, Abbott, Morgan Stanley, Netflix, Blackstone, P&G, and American Express.
This week, the European Central Bank will take centre stage as it is set to deliver another 25-basis-point cut in the main deposit rate, in line with previous cuts in September and June. Ahead of the important event, the EUR/USD pair is stabilizing downwards, and according to the daily chart, the downward channel formation is gaining strength towards the current prominent support level of 1.0880, which in turn will push technical indicators towards oversold levels. Today is a US holiday, so liquidity will be lower, and therefore the EUR/USD pair may move in narrow ranges with a downward bias until any new developments.
Conversely, for the bulls to exit the downward channel, the EUR/USD pair must move towards the resistance levels of 1.1055 and 1.1130, respectively.
Ready to trade our EUR/USD Forex analysis? We’ve made a list of the best forex demo accounts worth trading with.