The main category of Forex News.
You can use the search box below to find what you need.
[wd_asp id=1]
The main category of Forex News.
You can use the search box below to find what you need.
[wd_asp id=1]
Gold price (XAU/USD) edges lower to $2,650, snapping the two-day winning streak during the early Asian session on Monday. The downbeat Chinese economic data and firmer Greenback weigh on the precious metal. Nonetheless, the prospects of further interest rate cuts this year and safe-haven demand might cap its downside.
China’s deflation pressure increased in September. The Consumer Price Index (CPI) inflation unexpectedly eased in September, while the Producer Price Index (PPI) fell more than expected during the same period, highlighting the need for more stimulus measures. The persistent deflationary pressure in China is likely to exert some selling pressure on the yellow metal, as China is the world’s largest Gold consumer.
The US Producer Price Index (PPI) was unchanged in September, indicating a still-favorable inflation outlook and supporting the bets of the Federal Reserve (Fed) rate cut in November. “The PPI numbers leaned friendly for the precious metals market bulls and suggest the Fed remains on track for two quarter-point interest rate cuts this year,” said Jim Wyckoff, senior market analyst at Kitco Metals.
Additionally, the rising geopolitical tensions in the Middle East have triggered the fear of wider war in the region, boosting the traditional safe-haven assets like the Gold price. On Sunday, at least four Israeli soldiers were killed and more than 60 people were injured by a drone attack in north-central Israel, per CNN. The number of injuries makes the attack one of the bloodiest on Israel since the war started last October. Hezbollah has claimed responsibility for the attack.
Gold has played a key role in human’s history as it has been widely used as a store of value and medium of exchange. Currently, apart from its shine and usage for jewelry, the precious metal is widely seen as a safe-haven asset, meaning that it is considered a good investment during turbulent times. Gold is also widely seen as a hedge against inflation and against depreciating currencies as it doesn’t rely on any specific issuer or government.
Central banks are the biggest Gold holders. In their aim to support their currencies in turbulent times, central banks tend to diversify their reserves and buy Gold to improve the perceived strength of the economy and the currency. High Gold reserves can be a source of trust for a country’s solvency. Central banks added 1,136 tonnes of Gold worth around $70 billion to their reserves in 2022, according to data from the World Gold Council. This is the highest yearly purchase since records began. Central banks from emerging economies such as China, India and Turkey are quickly increasing their Gold reserves.
Gold has an inverse correlation with the US Dollar and US Treasuries, which are both major reserve and safe-haven assets. When the Dollar depreciates, Gold tends to rise, enabling investors and central banks to diversify their assets in turbulent times. Gold is also inversely correlated with risk assets. A rally in the stock market tends to weaken Gold price, while sell-offs in riskier markets tend to favor the precious metal.
The price can move due to a wide range of factors. Geopolitical instability or fears of a deep recession can quickly make Gold price escalate due to its safe-haven status. As a yield-less asset, Gold tends to rise with lower interest rates, while higher cost of money usually weighs down on the yellow metal. Still, most moves depend on how the US Dollar (USD) behaves as the asset is priced in dollars (XAU/USD). A strong Dollar tends to keep the price of Gold controlled, whereas a weaker Dollar is likely to push Gold prices up.
Gold (XAU/USD) declined sharply in the first half of the week but regained its traction after coming within a touching distance of $2,600. Investors will scrutinize macroeconomic data releases from China next week, while keeping a close eye on geopolitical developments.
Gold edged lower at the beginning of the week and closed in the red on Monday as the positive impact of the previous Friday’s upbeat September employment data continued to be felt on the USD. Meanwhile, although geopolitical tensions remain high, they haven’t escalated any further with Israel taking its time in mulling its retaliatory response to Iran. In turn, the broad-based USD strength caused XAU/USD to stay on the back foot.
The National Development & Reform Commission (NDRC), China’s state planner, said on Tuesday that the downward pressure on China’s economy is increasing, adding “China’s economy is facing more complex internal, external environments.”
Growing concerns over an economic downturn in China, the world’s biggest consumer of Gold, caused the precious metal to continue to stretch lower. Reflecting this sentiment, China’s Shanghai Composite Index fell nearly 7%, and Hong Kong’s Hang Seng Index lost over 1% on Wednesday.
The hawkish tone in the minutes of the Federal Reserve’s (Fed) September policy meeting helped the US Dollar (USD) outperform its rivals late Wednesday, not allowing XAU/USD to stage a rebound. The publication showed that even though a substantial majority of Fed officials supported the 50-basis-point (bps) rate cut, there was even a broader consensus that this initial step would not lock the Fed into any specific pace for future rate cuts. Additionally, some participants favored only a 25 bps reduction in the policy rate cut, while “a few others” mentioned they could have supported that decision as well.
The US Bureau of Labor Statistics reported on Thursday that annual inflation in the US, as measured by the change in the Consumer Price Index (CPI), softened to 2.4% in September from 2.5% in August. The core CPI, which excludes volatile food and energy prices, rose 3.3% on a yearly basis, surpassing the market expectation of 3.2%. Finally, the CPI and the core CPI increased 0.2% and 0.3%, respectively, on a monthly basis. Other data from the US showed that the number of first-time applications for unemployment benefits climbed to 258,000 in the week ending October 5 from 225,000 in the previous week. The disappointing Initial Jobless Claims reading didn’t allow the USD to benefit from the inflation report and helped XAU/USD find its footing.
In the absence of fundamental drivers, Gold continued to stretch higher on Friday but struggled to gather bullish momentum. The final data of the week from the US showed that the Producer Price Index (PPI) rose 1.8% on a yearly basis in September, arriving above the market forecast of 1.6%.
The US economic calendar will not feature any high-tier data releases in the first half of the week. On Thursday, the US Census Bureau will release Retail Sales data for September. The market reaction to this data could be straightforward, with a positive surprise supporting the USD and a negative reading having the opposite impact on the currency’s valuation. Nevertheless, this data by itself is unlikely to have a strong enough effect to alter Gold’s direction.
Meanwhile, market participants will pay close attention to macroeconomic data releases from China. In the Asian session on Monday, Trade Balance figures could set Gold’s tone at the beginning of the week. A sharp decline in the trade surplus could feed into concerns over China’s economic health and weigh on Gold. Early Friday, the third-quarter Gross Domestic Product (GDP), which is forecast to show an annualized growth of 4.6%, alongside the Industrial Production and Retail Sales data for September, will be scrutinized by investors. On a yearly basis, Industrial Production and Retail Sales are anticipated to rise by 4.6% and 2.4%, respectively. Again, disappointing data releases are likely to hurt Gold, while positive surprises could be supportive for the yellow metal.
Investors will continue to assess geopolitical developments next week as well. If Israel carries on with a retaliatory attack against Iran, a deepening crisis in the Middle East could help Gold benefit from safe-haven demand.
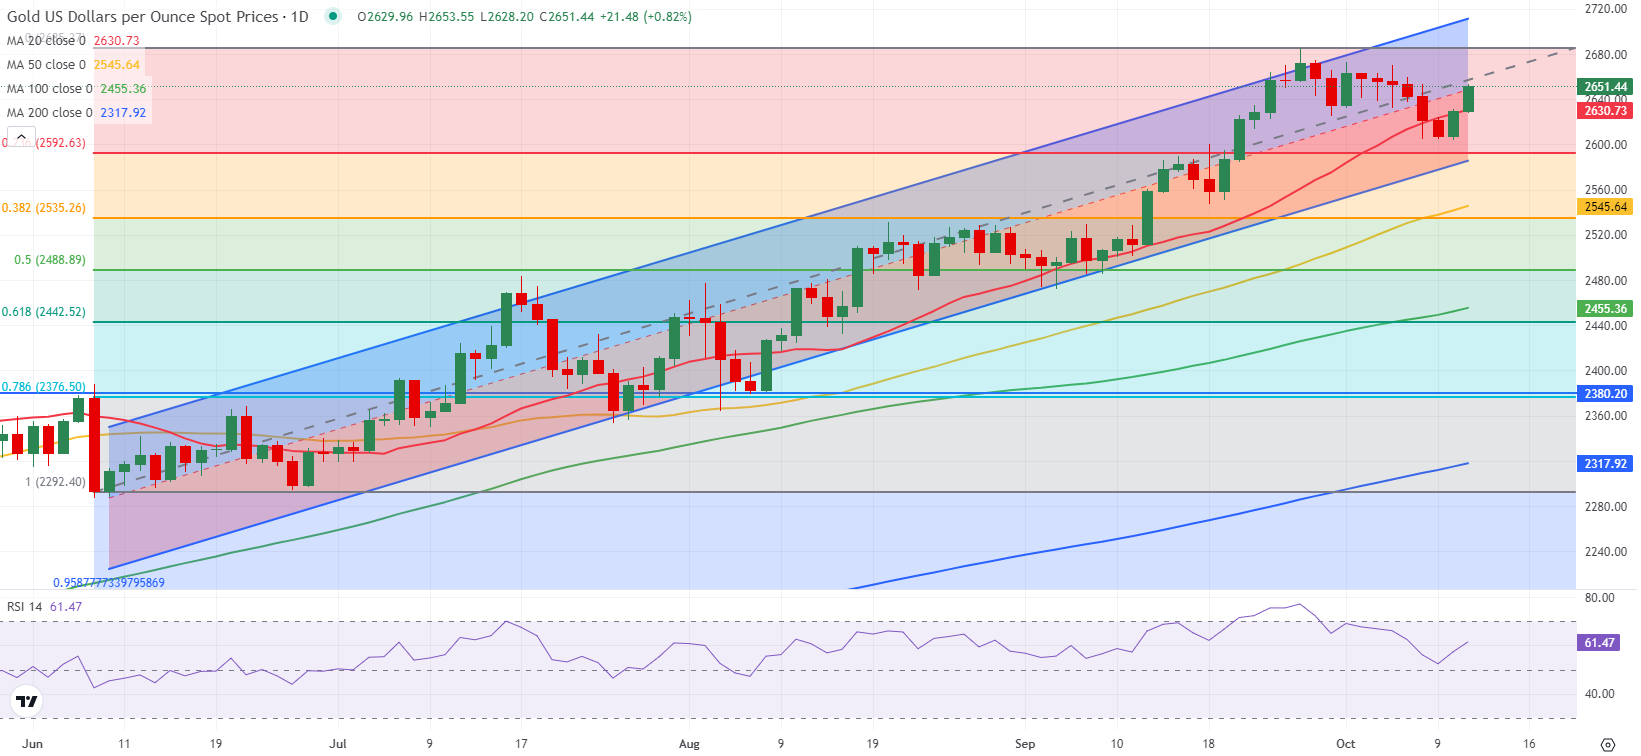
The Relative Strength Index (RSI) indicator on the daily chart rose toward 60 after falling to the neutral 50 area earlier in the week, suggesting that Gold’s bullish bias remains intact following a technical correction.
On the upside, the midpoint of the ascending regression channel coming from June aligns as immediate resistance at $2,660 before $2,675 (static level) and $2,700-$2,710 (round level, upper limit of the ascending channel).
In case XAU/USD drops below $2,600-$2,590 (lower limit of the ascending channel, Fibonacci 23.6% retracement of the June-September uptrend) and starts using this level as resistance, technical sellers could take action. In this scenario, $2,545-$2,535 (50-day Simple Moving Average, Fibonacci 38.2% retracement) could be seen as the next bearish target.
Inflation measures the rise in the price of a representative basket of goods and services. Headline inflation is usually expressed as a percentage change on a month-on-month (MoM) and year-on-year (YoY) basis. Core inflation excludes more volatile elements such as food and fuel which can fluctuate because of geopolitical and seasonal factors. Core inflation is the figure economists focus on and is the level targeted by central banks, which are mandated to keep inflation at a manageable level, usually around 2%.
The Consumer Price Index (CPI) measures the change in prices of a basket of goods and services over a period of time. It is usually expressed as a percentage change on a month-on-month (MoM) and year-on-year (YoY) basis. Core CPI is the figure targeted by central banks as it excludes volatile food and fuel inputs. When Core CPI rises above 2% it usually results in higher interest rates and vice versa when it falls below 2%. Since higher interest rates are positive for a currency, higher inflation usually results in a stronger currency. The opposite is true when inflation falls.
Although it may seem counter-intuitive, high inflation in a country pushes up the value of its currency and vice versa for lower inflation. This is because the central bank will normally raise interest rates to combat the higher inflation, which attract more global capital inflows from investors looking for a lucrative place to park their money.
Formerly, Gold was the asset investors turned to in times of high inflation because it preserved its value, and whilst investors will often still buy Gold for its safe-haven properties in times of extreme market turmoil, this is not the case most of the time. This is because when inflation is high, central banks will put up interest rates to combat it. Higher interest rates are negative for Gold because they increase the opportunity-cost of holding Gold vis-a-vis an interest-bearing asset or placing the money in a cash deposit account. On the flipside, lower inflation tends to be positive for Gold as it brings interest rates down, making the bright metal a more viable investment alternative.
The Pound Sterling recovers some ground against the greenback as a ‘hammer’ emerges on the daily chart and rises above 1.3050, registering gains of over 0.15%. Goodish economic data in the UK sponsored the GBP/USD’s recovery as the economy grew around estimates. Nevertheless, a slightly hot Producer Price Index (PPI) report in the US capped the GBP’s gains.
The GBP/USD seems to have bottomed out after retreating from yearly highs of 1.3434 to a daily low of 1.3010 on October 10. A ‘hammer’ formation preceded by a downtrend hints that a reversal is possible.
Nevertheless, the pair should clear the October 10 high of 1.3093, immediately followed by the 50-day moving average (DMA) at 1.3099, so buyers could remain hopeful of higher exchange rates.
In that outcome, the GBP/USD next resistance would be the 1.3100 figure, followed by the October 8 high at 1.3113. On further strength, the next supply zone will be the October 7 weekly high of 1.3134.
Conversely, if GBP/USD fails to clear 1.3100, sellers could step in and push prices below the psychological 1.3050 level, driving the exchange rate toward the week’s lows at 1.3010.
From a momentum standpoint, the GBP/USD is barely biased, but the Relative Strength Index (RSI) has increased upwards during the last couple of days, opening the door for a leg-up.
The table below shows the percentage change of British Pound (GBP) against listed major currencies today. British Pound was the strongest against the Japanese Yen.
| USD | EUR | GBP | JPY | CAD | AUD | NZD | CHF | |
|---|---|---|---|---|---|---|---|---|
| USD | -0.14% | -0.14% | 0.45% | 0.12% | -0.13% | -0.11% | 0.12% | |
| EUR | 0.14% | -0.05% | 0.54% | 0.21% | -0.00% | -0.03% | 0.20% | |
| GBP | 0.14% | 0.05% | 0.59% | 0.26% | 0.06% | 0.02% | 0.27% | |
| JPY | -0.45% | -0.54% | -0.59% | -0.33% | -0.55% | -0.57% | -0.40% | |
| CAD | -0.12% | -0.21% | -0.26% | 0.33% | -0.23% | -0.24% | 0.00% | |
| AUD | 0.13% | 0.00% | -0.06% | 0.55% | 0.23% | -0.04% | 0.19% | |
| NZD | 0.11% | 0.03% | -0.02% | 0.57% | 0.24% | 0.04% | 0.25% | |
| CHF | -0.12% | -0.20% | -0.27% | 0.40% | -0.01% | -0.19% | -0.25% |
The heat map shows percentage changes of major currencies against each other. The base currency is picked from the left column, while the quote currency is picked from the top row. For example, if you pick the British Pound from the left column and move along the horizontal line to the US Dollar, the percentage change displayed in the box will represent GBP (base)/USD (quote).
The USD/JPY edged higher during the North American session as US Treasury yields remained higher, particularly the 10-year T-note, which was up close to four basis points at 4.104%. The positive correlation between the US 10-year yield and the pair pushed the exchange rate to 149.13, up 0.37%.
The USD/JPY is still neutrally biased, though trading in a higher range within the 148.00-149.50 area, as traders decipher the Fed and the Bank of Japan’s next move.
From a momentum standpoint, buyers remain in charge, yet the Relative Strength Index (RSI) hasn’t reached a new peak to push USD/JPY prices higher.
If USD/JPY clears the 149.50 area, this will immediately expose the 150.00 figure. Once removed, the next resistance would be the 200 and 100-day moving averages (DMAs) confluence at 151.20/21.
Conversely, if the pair drops below 149.00, look for a pullback toward the October 8 swing low of 147.35.
The table below shows the percentage change of Japanese Yen (JPY) against listed major currencies today. Japanese Yen was the strongest against the Canadian Dollar.
| USD | EUR | GBP | JPY | CAD | AUD | NZD | CHF | |
|---|---|---|---|---|---|---|---|---|
| USD | -0.05% | -0.07% | 0.39% | 0.17% | -0.20% | -0.28% | 0.12% | |
| EUR | 0.05% | -0.05% | 0.38% | 0.17% | -0.16% | -0.28% | 0.10% | |
| GBP | 0.07% | 0.05% | 0.45% | 0.24% | -0.10% | -0.21% | 0.19% | |
| JPY | -0.39% | -0.38% | -0.45% | -0.24% | -0.56% | -0.67% | -0.36% | |
| CAD | -0.17% | -0.17% | -0.24% | 0.24% | -0.34% | -0.43% | -0.03% | |
| AUD | 0.20% | 0.16% | 0.10% | 0.56% | 0.34% | -0.13% | 0.27% | |
| NZD | 0.28% | 0.28% | 0.21% | 0.67% | 0.43% | 0.13% | 0.41% | |
| CHF | -0.12% | -0.10% | -0.19% | 0.36% | 0.03% | -0.27% | -0.41% |
The heat map shows percentage changes of major currencies against each other. The base currency is picked from the left column, while the quote currency is picked from the top row. For example, if you pick the Japanese Yen from the left column and move along the horizontal line to the US Dollar, the percentage change displayed in the box will represent JPY (base)/USD (quote).
The technical analysis for this pair does make me believe that there are buyers coming sooner rather than later, but at this point in time I think you’ve got a situation where there is some questions to be asked of the fundamental analysis. As far as the charges are concerned, it is worth noting that the market dropped toward the 200 Day EMA, but then turned around to show signs of life. Because of this, the market has the look of a market that could form a bit of a hammer. All things being equal, the market bouncing from here could open up the possibility of a move to the 1.10 level, which of course is a large, round, psychologically significant figure. Above there, we have the 1.1040 level where the 50 Day EMA comes into the picture, and it would offer a little bit of technical resistance.

If we were to break down below the 1.09 level, then I think the euro is in serious trouble, but until that actually happens on a daily close, I think we are more likely than not to see some type of bounce in this market, because quite frankly at this point, we are been oversold. I have no interest in trying to get too cute with this, but I do recognize that the short term probably favors the overall upside more than anything else, at least for a quick recovery bounce.
Ready to trade our EUR/USD Forex analysis? We’ve made a list of the best forex demo accounts worth trading with.
© 2000-2024. All rights reserved.
This site is managed by Teletrade D.J. LLC 2351 LLC 2022 (Euro House, Richmond Hill Road, Kingstown, VC0100, St. Vincent and the Grenadines).
The information on this website is for informational purposes only and does not constitute any investment advice.
The company does not serve or provide services to customers who are residents of the US, Canada, Iran, The Democratic People’s Republic of Korea, Yemen and FATF blacklisted countries.
Making transactions on financial markets with marginal financial instruments opens up wide possibilities and allows investors who are willing to take risks to earn high profits, carrying a potentially high risk of losses at the same time. Therefore you should responsibly approach the issue of choosing the appropriate investment strategy, taking the available resources into account, before starting trading.
Use of the information: full or partial use of materials from this website must always be referenced to TeleTrade as the source of information. Use of the materials on the Internet must be accompanied by a hyperlink to teletrade.org. Automatic import of materials and information from this website is prohibited.
Please contact our PR department if you have any questions or need assistance at pr@teletrade.global.
Silver price (XAG/USD) climbs to near $31.50 in Friday’s New York session. The white metal gains while the US Dollar (USD) remains steady after the release of the United States (US) Producer Price Index (PPI) data for September.
The US Dollar Index (DXY), which tracks the Greenback’s value against six major currencies, wobbles around 103.00.
The PPI report showed that the annual headline producer inflation grew by 1.8%, faster than estimates of 1.6%. However, it remained slower than 1.9% in August, upwardly revised from 1.7%. The annual core PPI – which excludes volatile food and energy prices – accelerated at a faster-than-expected pace to 2.8% from expectations of 2.7% and the former release of 2.6%, upwardly revised from 2.4%.
Meanwhile, the month-on-month headline producer inflation remained flat, strengthening the case for further interest rate cuts by the Federal Reserve (Fed). According to the CME FedWatch tool, 30-day Federal Fund Futures pricing data shows that the central bank will cut its borrowing rates by 25 basis points (bps) to 4.50%-4.75% in November.
The Fed started the policy-easing cycle with a 50-bps interest rate cut in September as Fed officials were concerned over growing job market risks, with confidence that price pressures will sustainably return to the bank’s target of 2%.
Silver price strengthens after breaking above the horizontal resistance plotted from the September 30 low of $31.30, which is expected to act as support ahead. The near-term outlook of the Silver price has become upbeat as it has climbed above the 20-period Exponential Moving Average (EMA), which trades around $31.50. The asset is expected to extend its upside toward an October high of around $33.00.
The 14-period Relative Strength Index (RSI) climbs to near 60.00. A bullish momentum would trigger if the RSI breaks above 60.00.
Silver is a precious metal highly traded among investors. It has been historically used as a store of value and a medium of exchange. Although less popular than Gold, traders may turn to Silver to diversify their investment portfolio, for its intrinsic value or as a potential hedge during high-inflation periods. Investors can buy physical Silver, in coins or in bars, or trade it through vehicles such as Exchange Traded Funds, which track its price on international markets.
Silver prices can move due to a wide range of factors. Geopolitical instability or fears of a deep recession can make Silver price escalate due to its safe-haven status, although to a lesser extent than Gold’s. As a yieldless asset, Silver tends to rise with lower interest rates. Its moves also depend on how the US Dollar (USD) behaves as the asset is priced in dollars (XAG/USD). A strong Dollar tends to keep the price of Silver at bay, whereas a weaker Dollar is likely to propel prices up. Other factors such as investment demand, mining supply – Silver is much more abundant than Gold – and recycling rates can also affect prices.
Silver is widely used in industry, particularly in sectors such as electronics or solar energy, as it has one of the highest electric conductivity of all metals – more than Copper and Gold. A surge in demand can increase prices, while a decline tends to lower them. Dynamics in the US, Chinese and Indian economies can also contribute to price swings: for the US and particularly China, their big industrial sectors use Silver in various processes; in India, consumers’ demand for the precious metal for jewellery also plays a key role in setting prices.
Silver prices tend to follow Gold’s moves. When Gold prices rise, Silver typically follows suit, as their status as safe-haven assets is similar. The Gold/Silver ratio, which shows the number of ounces of Silver needed to equal the value of one ounce of Gold, may help to determine the relative valuation between both metals. Some investors may consider a high ratio as an indicator that Silver is undervalued, or Gold is overvalued. On the contrary, a low ratio might suggest that Gold is undervalued relative to Silver.
After touching its weakest level since early August at 1.0900 on Thursday, EUR/USD staged a rebound and closed the day unchanged. The pair edges higher and trades at around 1.0950 in the European session on Friday.
The table below shows the percentage change of Euro (EUR) against listed major currencies this week. Euro was the weakest against the Swiss Franc.
| USD | EUR | GBP | JPY | CAD | AUD | NZD | CHF | |
|---|---|---|---|---|---|---|---|---|
| USD | 0.20% | 0.32% | 0.00% | 1.43% | 0.82% | 1.01% | -0.29% | |
| EUR | -0.20% | 0.18% | -0.16% | 1.28% | 0.60% | 0.80% | -0.52% | |
| GBP | -0.32% | -0.18% | -0.37% | 1.08% | 0.42% | 0.65% | -0.58% | |
| JPY | 0.00% | 0.16% | 0.37% | 1.42% | 0.79% | 0.95% | -0.27% | |
| CAD | -1.43% | -1.28% | -1.08% | -1.42% | -0.57% | -0.42% | -1.69% | |
| AUD | -0.82% | -0.60% | -0.42% | -0.79% | 0.57% | 0.25% | -1.07% | |
| NZD | -1.01% | -0.80% | -0.65% | -0.95% | 0.42% | -0.25% | -1.25% | |
| CHF | 0.29% | 0.52% | 0.58% | 0.27% | 1.69% | 1.07% | 1.25% |
The heat map shows percentage changes of major currencies against each other. The base currency is picked from the left column, while the quote currency is picked from the top row. For example, if you pick the Euro from the left column and move along the horizontal line to the US Dollar, the percentage change displayed in the box will represent EUR (base)/USD (quote).
The initial reaction to September inflation data from the US caused EUR/USD to push lower in the early American trading hours on Thursday. The disappointing labor market data, however, made it difficult for the US Dollar (USD) to preserve its strength, paving the way for a recovery in the pair.
The US Bureau of Labor Statistics announced on Thursday that inflation in the US, as measured by the change in the Consumer Price Index (CPI), declined to 2.4% on a yearly basis in September from 2.5% in August. The core CPI, which excludes volatile food and energy prices, rose 3.3% on a yearly basis, coming in above the August reading and the market forecast of 3.2%. Finally, the monthly core CPI increased 0.3%. On a negative note, weekly Initial Jobless Claims rose to 258,000 in the week ending October 5 from 225,000 in the previous week.
Later in the day, the Producer Price Index (PPI) data will be featured in the US economic calendar. Investors expect the monthly core PPI to rise 0.2% in September, following the 0.3% increase recorded in August. In case the monthly core PPI comes in above the market expectation, the USD could hold its ground heading into the weekend and cap EUR/USD’s upside.
The Relative Strength Index (RSI) indicator on the 4-hour chart rose above 40 early Friday, reflecting a loss of bearish momentum. 1.0950 (20-period Simple Moving Average (SMA), Fibonacci 61.8% retracement of the latest uptrend) aligns as a pivot level for EUR/USD. Once this level is confirmed as support, 1.1000 (Fibonacci 50% retracement) and 1.1050 (Fibonacci 38.2% retracement) could be seen as next resistance levels.
If 1.0950 continues to hold as resistance, supports could be spotted at 1.0900 (round level), 1.0870 (Fibonacci 78.6% retracement) and 1.0800 (round level).
The Euro is the currency for the 19 European Union countries that belong to the Eurozone. It is the second most heavily traded currency in the world behind the US Dollar. In 2022, it accounted for 31% of all foreign exchange transactions, with an average daily turnover of over $2.2 trillion a day. EUR/USD is the most heavily traded currency pair in the world, accounting for an estimated 30% off all transactions, followed by EUR/JPY (4%), EUR/GBP (3%) and EUR/AUD (2%).
The European Central Bank (ECB) in Frankfurt, Germany, is the reserve bank for the Eurozone. The ECB sets interest rates and manages monetary policy. The ECB’s primary mandate is to maintain price stability, which means either controlling inflation or stimulating growth. Its primary tool is the raising or lowering of interest rates. Relatively high interest rates – or the expectation of higher rates – will usually benefit the Euro and vice versa. The ECB Governing Council makes monetary policy decisions at meetings held eight times a year. Decisions are made by heads of the Eurozone national banks and six permanent members, including the President of the ECB, Christine Lagarde.
Eurozone inflation data, measured by the Harmonized Index of Consumer Prices (HICP), is an important econometric for the Euro. If inflation rises more than expected, especially if above the ECB’s 2% target, it obliges the ECB to raise interest rates to bring it back under control. Relatively high interest rates compared to its counterparts will usually benefit the Euro, as it makes the region more attractive as a place for global investors to park their money.
Data releases gauge the health of the economy and can impact on the Euro. Indicators such as GDP, Manufacturing and Services PMIs, employment, and consumer sentiment surveys can all influence the direction of the single currency. A strong economy is good for the Euro. Not only does it attract more foreign investment but it may encourage the ECB to put up interest rates, which will directly strengthen the Euro. Otherwise, if economic data is weak, the Euro is likely to fall. Economic data for the four largest economies in the euro area (Germany, France, Italy and Spain) are especially significant, as they account for 75% of the Eurozone’s economy.
Another significant data release for the Euro is the Trade Balance. This indicator measures the difference between what a country earns from its exports and what it spends on imports over a given period. If a country produces highly sought after exports then its currency will gain in value purely from the extra demand created from foreign buyers seeking to purchase these goods. Therefore, a positive net Trade Balance strengthens a currency and vice versa for a negative balance.
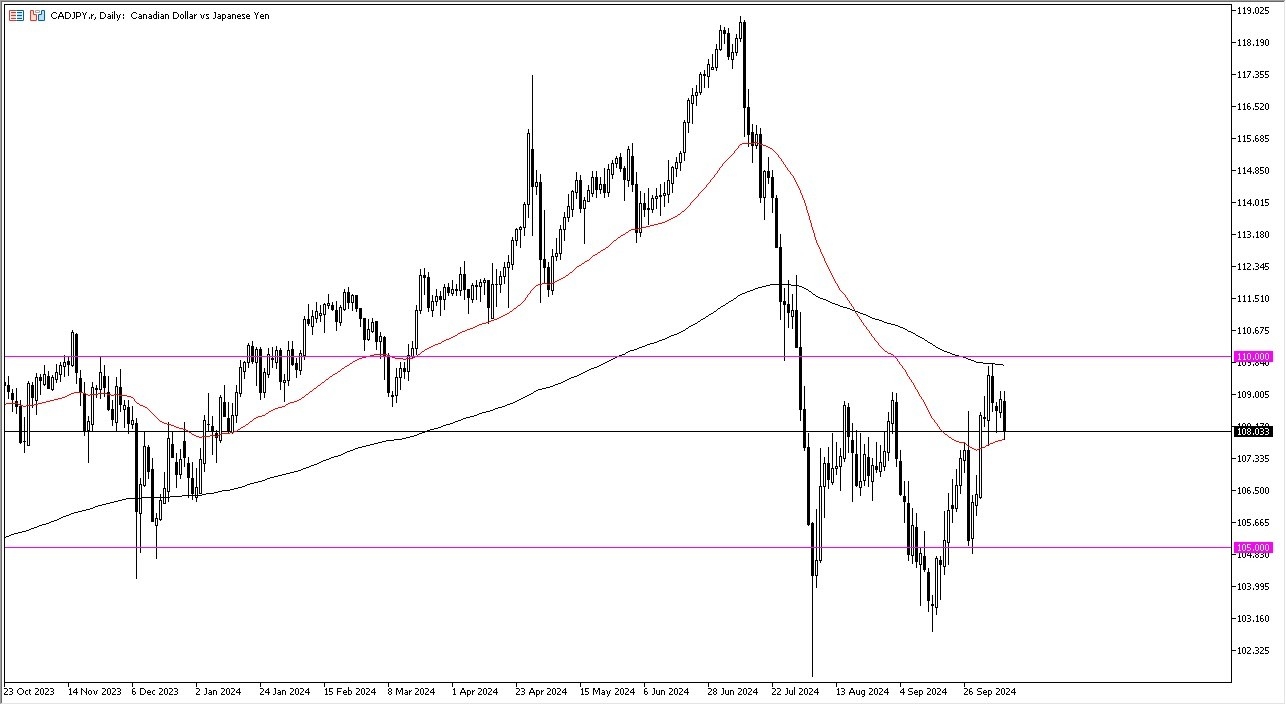
That being said, the Japanese yen strengthening could be due to a little bit of risk off, or it could just simply be due to the fact that the market had rallied so significantly against the yen over the last week or so. And when I say the market, I am referring to the currency markets in general. It’s not just the Canadian dollar that’s been positive.
It’s probably worth noting that we pulled back from the 200 day EMA, but if we can break higher from here, then I think we challenge that indicator again. Remember, the 200 day EMA is typically watched by technical traders rather closely for an eye on what happens with the trend. Above there, we have the 110 yen level, which of course is a large round psychologically significant figure, and also an area that sees a little bit of market memory. If we can get above that level, then 112 yen is your target. On a pullback below the 50-day EMA, perhaps somewhere around 107.50 yen, you could see buyers come in. Anything below there opens up a door back down to the 105 yen level, which would obviously be very negative as market participants continue to try to gauge what the risk appetite around the world is.
Furthermore, keep in mind this is almost a pure play on crude oil because Canada is an oil exporter and Japan imports 100% of its crude oil, so this might move with the oil markets as well.
Ready to trade our Forex daily forecast? We’ve shortlisted the best forex broker list for you to check out.
Copper is one of the most versatile and essential metals in today’s world. With applications ranging from electrical wiring to renewable energy infrastructure, its demand remains robust. But what does the future hold for copper prices?
We will draw on insights from our in-house experts (Boris Mikanikrezai and Andrew Cole) when exploring the current global picture. We will provide a copper price forecast for 2024 and a long-term outlook for 2025.
As we navigate through 2024, the copper market presents a complex global picture, influenced by varying economic climates in major regions such as the US, China and Europe.
In the United States, the price of copper remains stable yet subdued, largely due to the seasonal summer lull, with premiums holding steady in the Midwest. Despite challenges, long-term optimism prevails, buoyed by potential supply imbalances and increasing demand for copper in green energy projects.
China, a major player in the copper market, witnessed a mild recovery in its physical market during August 2024. The copper grade A cathode premium in Shanghai saw an uptick, reflecting improved market conditions. This recovery is driven by expectations for better import arbitrage conditions post-LME price decline, although challenges remain due to fluctuating prices.
In Europe, the copper market remains weak, particularly in Germany – Europe’s largest consumer. Despite some demand from green energy projects, overall market conditions are bearish, with ample stock levels and sluggish performance in the manufacturing, automotive and construction sectors.
For more information on our long-term price analysis of the global copper market, see Fastmarkets’ copper 10-year long-term forecast.
In Q4 2024, copper prices are expected to experience upward pressure, driven by a more favorable macroeconomic sentiment (Federal Reserve rate cuts, stimulus in China), tighter market fundamentals (on expectations for smelter production cuts, a recovery in physical demand in China), positive seasonality (the fourth quarter typically being the strongest) and speculative positioning (rapid rebuilding of long positions). Given these factors, Fastmarkets analysts view the risk-reward profile skewed to the upside for the fourth quarter.
In China, the Shanghai premium should continue its recovery in the final quarter of the year, largely due to the improved sentiment following the substantial stimulus measures implemented by the country’s authorities.
In the US, spot market activity is projected to remain stable until the year-end, although supply availability could become a little tighter. Meanwhile, Europe might also see quiet spot activity until the remainder of the year, as most consumers are adequately covered by long-term contracts.
China’s stimulus package, announced in September, represents a significant injection of liquidity totaling 3.95 trillion yuan ($560 billion), equivalent to over 3% of China’s GDP. The size of this package is substantial, nearing the level of support provided during the Covid-19 crisis. Alongside the Federal Reserve’s recent rate cuts, this should increase liquidity in the financial system in the coming months. Speculators have already begun to re-engage on the long side of the copper market in response. Given that the fourth quarter is historically the strongest for copper, we expect prices to average around $10,265 per tonne in Q4 2024, which would mark a record high.
Lower trading volumes and potential market volatility suggest caution. Despite the expected rise, the market remains sensitive to macroeconomic conditions and geopolitical events. Investors should keep an eye on these factors as they could impact short-term price movements.
The video below shows the relationship between global refined copper supply and demand, from 2022 through 2025.
Beyond the immediate future, the copper market and the price of copper is poised for a bullish long-term trajectory, driven by the energy transition’s escalating demand. For instance, by 2025 the copper grade A cathode premium in Rotterdam is projected to rise by approximately 25%, reflecting tighter regional fundamentals and a recovering European market.
Fastmarkets’ copper long-term outlook remains optimistic. As we move toward 2034, refined copper consumption is set to be driven significantly by sectors linked to the energy transition, including electric vehicles and renewable energy applications. The anticipated structural supply deficit will likely necessitate increased investments in production facilities, further underpinning a bullish outlook for copper prices.
As mentioned, refined copper consumption will be supported by demand from sectors linked to the energy transition. Some of its uses are listed below:
∙ To help connect batteries to electric vehicle (EV) powertrains
∙ For use in electric motors in the EV charging infrastructure
∙ Solar energy and wind power applications
∙ Grid connections
We expect total apparent demand for copper to rise at a compound annual growth rate (CAGR) of 2.6% in the decade to 2034. Copper consumption from energy transition sectors should grow at a CAGR of 10.7%, including 14.3% for the EV sector, 5.6% for the solar power industry and 9.3% in wind power applications. Traditional non-energy transition sectors should see a growth rate of 1.4%.
The US copper market is expected to see a modest increase in demand, driven by government infrastructure projects and a growing emphasis on renewable energy. The supply-demand balance is likely to tighten, supporting higher copper prices.
China remains a critical player in the global copper market. The country’s focus on green energy and electric vehicles will drive significant demand. We project the Shanghai premium will average approximately $27 per tonne in 2025, reflecting a 25% decline from the estimated 2024 average. However, the long-term outlook remains positive, with expected stabilization and growth.
The forecast for copper prices in the next 12 months is bullish. However, there are key risks to monitor, including a potential US economic recession and increased trade protectionism. The long-term forecast is also very constructive, driven by robust demand from the energy transition sectors and constrained supply dynamics.
Economists, analysts and investors should keep an eye on macroeconomic conditions, geopolitical events and industry-specific developments that could impact copper prices.
For more detailed insights and a comprehensive analysis, consider exploring Fastmarkets’ copper 10-year long-term forecast.