The main category of Forex News.
You can use the search box below to find what you need.
[wd_asp id=1]
The main category of Forex News.
You can use the search box below to find what you need.
[wd_asp id=1]
There are several lower price levels to keep an eye on where support may eventually be seen. The maximum for the bulls would be a test of support around the 200-Day MA, currently at 2.25. The 200-Day line was recaptured in early-September leading to an accelerated advance that culminated with the recent swing high of 3.02. This would be the first pullback towards the 200-Day line following the recent advance. Therefore, the 200-Day line has a good chance of marking the maximum low-price zone for the current retracement.
Today’s decline took natural gas below the 38.2% Fibonacci retracement at 2.58, which was near last week’s low. It most likely leads to a test of support around the 50% retracement at 2.45, at a minimum. That price level should be considered along with a prior interim trend high at 2.44. Further down from there is the 50-Day MA, now at 2.37. Moreover, consider the 50-Day line to begin a potential support zone down to the 200-Day MA. However, in between those two moving averages is the 61.8% Fibonacci retracement at 2.31. The 2.31 price zone is also indicated as a potential support area by the mid-August swing high at 2.30.
In the bigger picture, natural gas remains within a large symmetrical triangle pattern that defines a consolidation range. A failed bullish breakout attempt occurred in the most recent rally that ended at the recent high of 3.02. However, since a consolidation triangle exists, there is always the possibility of an eventual test of support at the lower boundary line of the pattern.
For a look at all of today’s economic events, check out our economic calendar.
According to reliable trading platforms, the US dollar exchange rate has fluctuated after US producer price inflation rose 1.8% year-on-year in September, exceeding expectations of a modest 1.6% increase, while the August figure was revised upwards to 1.9%. The producer price index measures inflation rates in US factories and is seen as a key indicator of core inflation, which recorded a number higher than the consensus of 2.4% year-on-year just 24 hours earlier.
Financial markets are also grappling with new communications from Fed members: Atlanta Fed President Raphael Bostic said, “I’m perfectly comfortable skipping a meeting if the data suggests that’s appropriate.” And on Wednesday, San Francisco Fed President Mary Daly also said there is room to keep US interest rates unchanged next month, saying, “It’s likely that rates will be cut once or twice this year.”
Commenting on this, Paul Ashworth, chief economist at Capital Economics, said: “Along with unexpectedly strong Labor market data, September’s price data suggests that more than one Fed official may regret starting the easing cycle with a 50-basis-point rate cut.” He added, “We expect a more modest 25-basis-point cut at the FOMC meeting in early next month. The data is not strong enough to justify leaving rates unchanged.”
Neither the economic data nor the comments by Daly and Bostic had a significant impact on the US dollar price, suggesting that the markets have already moved to price in less than two more cuts in 2024 before the comments. The market expects US interest rates to be cut by about 40 basis points for the rest of the year, meaning that less than two full 25-basis-point rate cuts are expected. This can certainly still be adjusted downwards, which would strengthen the US dollar, but it now seems that the lion’s share of the adjustment in Favor of the dollar has occurred.
According to analysts, the rise in US yields has almost ended, and what we will continue to see is a volatile, not a volatile, exchange rate market, and next month’s jobs report will be distorted by hurricanes, which may argue for a 25-basis point cut instead of a stop.
Meanwhile, the rise of the US dollar is likely to pause temporarily until US Treasury yields resume their rise. Jonas Goltermann, Deputy Chief Economist for Financial Markets at Capital Economics, says: “With financial markets now shifting towards discounting the potential halt to the Fed’s intended rate-cutting cycle – which seems unlikely in our view – we see limited further upside for the dollar from US interest rate expectations in the near term.”

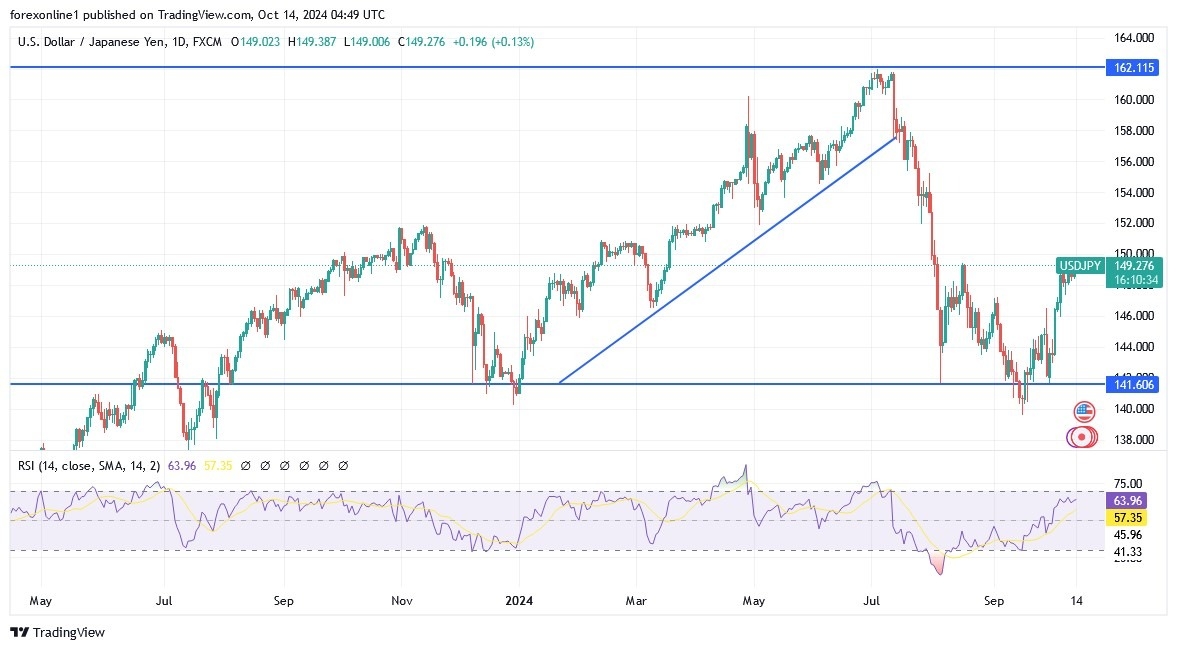
USD/JPY has now retreated to trade at its 100-hour moving average. Previously, Last Thursday’s decline had pushed the pair close to oversold levels on the 14-hour Relative Strength Index (RSI). In the near term, based on the hourly chart, USD/JPY is trading within a descending channel formation. Also, the 14-hour RSI supports a bearish bias as it approaches oversold levels. Therefore, bears will target extended declines around 148.51 or lower at 147.80. On the other hand, bulls will look to pounce on rebounds around 149.65 or higher at 150.59 resistance.
In the long term, based on the performance on the daily chart, USD/JPY is trading within an ascending channel formation. Technically, the 14-day RSI seems to support the bullish bias as it approaches overbought conditions. Therefore, bulls will look to extend the current winning streak towards 153.14 or higher to the 157.93 resistance. On the other hand, bears will look to pounce on pullbacks around 144.14 or lower at the 139.49 support.
Ready to trade our USD/JPY Forex forecast? Here are the best forex brokers in Japan to choose from.
In its latest short term energy outlook (STEO), which was released this week, the U.S. Energy Information Administration (EIA) revealed its latest Brent oil price forecast for 2024 and 2025.
According to its October STEO, the EIA now sees the Brent spot price averaging $80.89 per barrel this year and $77.59 per barrel next year. In its previous STEO, which was released in September, the EIA projected that the Brent spot price would average $82.80 per barrel in 2024 and $84.09 per barrel in 2025.
A quarterly breakdown included in the October STEO revealed that the EIA sees the Brent spot price average coming in at $75.97 per barrel in the fourth quarter of this year, $78 per barrel in the first quarter of 2025, $79 per barrel in the second quarter, $77.67 per barrel in the third quarter, and $75.72 per barrel in the fourth quarter.
In the EIA’s September STEO, the organization forecast that the Brent spot price would average $81.64 per barrel in the fourth quarter of 2024, $83.34 per barrel in the first quarter of 2025, $85 per barrel across the second and third quarters of next year, and $83 per barrel in the fourth quarter.
The EIA’s latest STEO put the 2023 Brent spot price average at $82.41 per barrel.
“The Brent crude oil spot price averaged $74 per barrel in September, down $6 per barrel from August,” the EIA noted in its October STEO.
“Prices fell in September as concerns over global oil demand growth outweighed declines in oil inventories and OPEC+ members’ decision to delay production increases until December 2024,” it added.
“However, after recent military actions involving Israel, Lebanon, and Iran, the Brent spot price rose to $79 per barrel on October 4, up 11 percent from a week earlier,” it continued.
“The potential for further escalation – such as an Israeli response to Iran’s missile attack on October 1 – have injected significant uncertainty and volatility into oil markets in recent days,” it went on to state.
“Following the September drop in prices and our expectation that oil demand growth will be lower next year than we had previously forecast, we have lowered our forecast for crude oil prices despite increasing oil prices in early October,” it noted.
In its latest STEO, the EIA highlighted that no oil supplies have been affected by increased military action in the Middle East and noted that it does not assume any disruption in its forecast.
“However, the conflict has escalated in recent weeks with no timeline for a potential resolution, increasing the possibility for supply disruptions and price volatility,” the EIA warned.
“At the same time, we assess that significant surplus crude oil production capacity is available, which could be brought online in the event of a disruption,” it added.
In its October STEO, the EIA said OPEC+ production cuts continue to mean less oil is being produced globally than is being consumed and pointed out that oil is being withdrawn from inventories.
In the STEO, the EIA estimated that global oil inventories fell by 0.8 million barrels per day in the third quarter of 2024 and revealed that it expects inventories will fall by 0.6 million barrels per day through 1Q25.
“As a result, we expect Brent prices will rise from $74 per barrel in September to average $79 per barrel in 1H25, which is about $6 per barrel lower than in last month’s STEO,” the EIA said.
“By the middle of next year, we anticipate accelerated growth in oil production as OPEC+ increases its production and as production continues to grow in the United States, Guyana, Brazil, and Canada,” it added.
“We forecast oil inventories will increase by an average of almost 0.6 million barrels per day in 2H25 as production growth globally begins to outweigh global oil demand growth,” it continued.
The EIA also warned in its October STEO that, in addition to the escalating Middle East conflict, other sources of uncertainty remain.
“We now expect production in Libya will begin increasing in the coming weeks, following recent production outages,” it said.
“But production in Libya can be volatile and returning crude oil production volumes might fall short of our expectations,” it added.
“We also assess that OPEC+ producers are likely to continue to limit production below recently announced targets in 2025. However, if OPEC+ producers stick closely to announced production levels in 2H25, it would be a downside risk to oil prices,” it went on to state.
A research note sent to Rigzone by the JPM Commodities Research team last Friday showed that J.P. Morgan expects the Brent crude oil price to average $82 per barrel this year and $75 per barrel next year.
A quarterly breakdown in that note showed that J.P. Morgan sees the commodity averaging $80 per barrel in the fourth quarter of 2024, $82 per barrel in the first quarter of 2025, $77 per barrel in the second quarter, $73 per barrel in the third quarter, and $69 per barrel in the fourth quarter.
In a report sent to Rigzone by Standard Chartered Commodities Research Head Paul Horsnell on Tuesday, Standard Chartered projected that the ICE Brent nearby future crude oil price will average $87 per barrel in the fourth quarter of 2024, $89 per barrel in the first quarter of next year, $92 per barrel in the second quarter, $95 per barrel in the third quarter, and $93 per barrel in the fourth quarter.
“A short-covering rally has taken oil prices sharply higher over the past week,” Standard Chartered analysts, including Horsnell, stated in the report.
“Brent for December delivery settled at $80.93 per barrel on 7 October, a week on week increase of $9.23 per barrel (12.9 percent) making it the strongest over the week among the major commodity contracts,” they added.
“In our view, the entire move down from $80 per barrel to $70 per barrel was an unsustainable undershooting which carried little fundamental information. We see the unwinding of that move in similar terms; while attacks on Beirut provided some initial momentum higher, the rest of the increase was simply the start of a move towards less extreme speculative positioning,” they continued.
In the report, the Standard Chartered analysts noted that, once the unwinding of the undershoot in prices is accounted for, the market response to events in the Middle East, and particularly the threats made against Iranian energy infrastructure, appears extremely limited.
“Brent’s front-month settlement on 7 October was lower than the settlement for the equivalent days in 2021, 2022 and 2023 and prompt prices have simply returned to where they were as recently as late August,” they said.
“Despite the increase in prices, we detect little sign of any change to the overwhelmingly bearish sentiment that has dominated the oil market over the past three months,” they added.
“Many traders are seemingly still prepared to short oil aggressively if the daily news flow and market momentum allows,” they warned.
To contact the author, email andreas.exarheas@rigzone.com
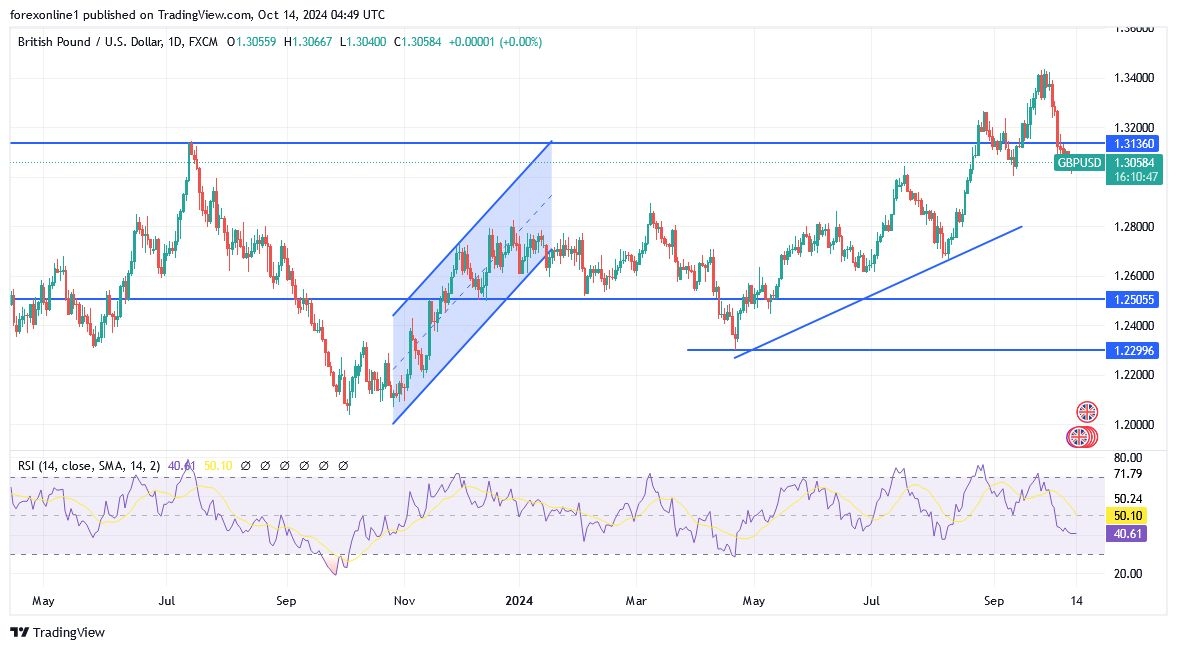
The recent strong gains of the US dollar against the rest of the major currencies in the Forex market. They were supported by the strength of the US jobs numbers and then the inflation numbers, in addition to the content of the minutes of the last meeting of the Federal Reserve Bank. Furthermore, this confirms that the bank will not be in a hurry to cut US interest rates more strongly in the remainder of 2024. Based on the daily chart, the overall trend for GBP/USD will remain bearish until the markets react to the UK economic data throughout the week. The 1.3230 resistance level will remain the most important for bulls to control the trend.
According to the Economic Calendar this week, the government must use this week’s investment summit and the upcoming budget to reverse the course of the slowing economy. The Office for National Statistics said that UK monthly gross domestic product (GDP) rose by 0.2% month-on-month in August after two months of no growth.
This puts real GDP on track to expand by 0.3% on a quarterly basis in the third quarter of 2024, in line with the Bank of England’s forecast. However, revisions to second-quarter GDP data mean that the 0.2% reading for August was below the consensus forecast of 0.5%, and the previous month was revised downward on this measure.
In August, services output – the dominant sector of the UK economy – rose by 0.1% month-on-month, while industrial production and construction output partially recovered from their declines in July. Commenting on the results, Hayley Lu, assistant economist at the National Institute of Economic and Social Research, said: “Today’s growth figures were slightly weaker than we expected.
While the economy continues to expand, there are increasing signs that momentum is fading compared to the strong performance seen in the first half of the year.” She added that the chancellor should seize the crucial opportunity in the upcoming budget to announce policies that boost higher investment levels and drive the UK towards a sustainable era of higher output growth.
Also, the Bank of England will monitor signs of slowdown and be prepared to cut interest rates. Analysts warn that a slowing economy means that growth looks set to fall short of the latest set of forecasts from the bank. Sam Hill, an analyst at Lloyds Bank, said: “There would need to be a strong performance recorded for the September monthly GDP figure to not fall below the MPC’s forecast for third-quarter GDP.”
Meanwhile, Services growth was weak at just 0.1%, with seven of the 14 subsectors contracting in August.
Pantheon Macroeconomics expects GDP growth to rise to 0.4% on a quarterly basis in the fourth quarter as consumers cut back on their savings slightly in response to lower interest rates, falling unemployment, and continued real wage growth. Barret Kupelian, chief economist at PricewaterhouseCoopers, says, “We expect the positive momentum to continue in the coming months given some of the tailwinds we see in the domestic economy.”
The upcoming UK Investment Summit should give the government a chance to reset the tone of the UK’s potential and inspire increased investment, he added. The new government has long complained about the legacy it has left behind, warning that tax cuts and tough decisions are needed to fill a “black hole” in the budget.
But Anna Leitch, chief economist at the Institute of Directors, says the government must shift the narrative from plugging the deficit today to building the economy of tomorrow. Added, “This is key to sustainable public finances and higher living standards. The Investment and Budget Summit provides an opportunity for the government to build on its election manifesto commitments to drive investment by providing more detail on the role of the National Wealth Fund in stimulating private capital and the early priorities of the industrial strategy.”
Furthermore, The UK Investment Summit is scheduled to take place on October 14 and aims to “bring together up to 300 industry leaders to stimulate investment in the UK”. However, concerns about the quality and organization of the UK Investment Summit have left some senior business figures hesitant about whether they will travel to the event on Monday.
According to the Financial Times, international and domestic executives have expressed frustration at the lack of information from the UK government about its flagship gathering in London, with some even questioning whether the event is worth the effort.
Ready to trade our GBP/USD daily forecasts? We’ve shortlisted the best regulated forex brokers UK in the industry for you.
Silver’s price dropped during the North American session on Monday, courtesy of a broad risk-on mood. China’s economy remains weak despite government efforts to stimulate consumer spending. Therefore, the XAG/USD trades at $31.25, down by over 0.88%.
After edging higher for two consecutive days, the XAG/USD has retreated somewhat, yet it remains above the $31.00 figure.
Momentum favors buyers in the near term, as shown by the Relative Strength Index (RSI), though caution is warranted, as RSI peaked below the latest two troughs.
For XAG/USD to resume its uptrend, bulls must clear the October 11 high at $31.63. If surpassed, the next stop would be the $32.00 figure, followed by the May 29 high at $32.29 and the May 20 at $32.50. Up next would be the year-to-date (YTD) high at $32.95.
Conversely, if sellers move in, the first support would be the $31.00 mark, followed by today’s low of $30.76. Once surpassed, the next stop would be the October 8 low of $30.12, followed by the confluence of the 50-100-day moving averages (DMAs) at $29.75/74.
Silver is a precious metal highly traded among investors. It has been historically used as a store of value and a medium of exchange. Although less popular than Gold, traders may turn to Silver to diversify their investment portfolio, for its intrinsic value or as a potential hedge during high-inflation periods. Investors can buy physical Silver, in coins or in bars, or trade it through vehicles such as Exchange Traded Funds, which track its price on international markets.
Silver prices can move due to a wide range of factors. Geopolitical instability or fears of a deep recession can make Silver price escalate due to its safe-haven status, although to a lesser extent than Gold’s. As a yieldless asset, Silver tends to rise with lower interest rates. Its moves also depend on how the US Dollar (USD) behaves as the asset is priced in dollars (XAG/USD). A strong Dollar tends to keep the price of Silver at bay, whereas a weaker Dollar is likely to propel prices up. Other factors such as investment demand, mining supply – Silver is much more abundant than Gold – and recycling rates can also affect prices.
Silver is widely used in industry, particularly in sectors such as electronics or solar energy, as it has one of the highest electric conductivity of all metals – more than Copper and Gold. A surge in demand can increase prices, while a decline tends to lower them. Dynamics in the US, Chinese and Indian economies can also contribute to price swings: for the US and particularly China, their big industrial sectors use Silver in various processes; in India, consumers’ demand for the precious metal for jewellery also plays a key role in setting prices.
Silver prices tend to follow Gold’s moves. When Gold prices rise, Silver typically follows suit, as their status as safe-haven assets is similar. The Gold/Silver ratio, which shows the number of ounces of Silver needed to equal the value of one ounce of Gold, may help to determine the relative valuation between both metals. Some investors may consider a high ratio as an indicator that Silver is undervalued, or Gold is overvalued. On the contrary, a low ratio might suggest that Gold is undervalued relative to Silver.
The USD/JPY outlook leans bullish, with the dollar firm after better-than-expected consumer inflation data. Meanwhile, the yen was weak despite Ishiba’s comments that he would not intervene in the BoJ’s policy adjustments.
–Are you interested to learn more about ECN brokers? Check our detailed guide-
The dollar rallied last week after consumer inflation figures increased more than expected. The CPI rose by 0.3% in September and completely dashed hopes for another massive Fed rate cut this year. Furthermore, the inflation numbers came after the NFP report, which revealed an unexpected jump in US job growth.
Initially, policymakers had taken a dovish tone due to fears that the US labor market was deteriorating. As a result, the focus shifted to preserving growth and demand. Therefore, the US central bank implemented a 50-bps rate cut, raising bets for more such cuts in 2024 and weighing on the greenback.
However, the dollar rebounded as incoming data changed this outlook. Currently, there is a 91% chance that the Fed will lower borrowing costs by 25-bps in November. Furthermore, market participants are now pricing a slight chance of a pause. The next major report will show retail sales, which might shift the outlook for rate cuts.
Elsewhere, the upcoming presidential election could cause some market turmoil. Therefore, market participants might prefer to stay on the sidelines ahead of the final result.
Meanwhile, the yen fell despite Ishiba’s comments on Saturday that he would stay out of the BoJ’s mandate for price stability. His earlier comments showed that he did not support a near-term rate hike.
It will be a slow start to the week for USD/JPY as neither the US nor Japan will release high-impact data.
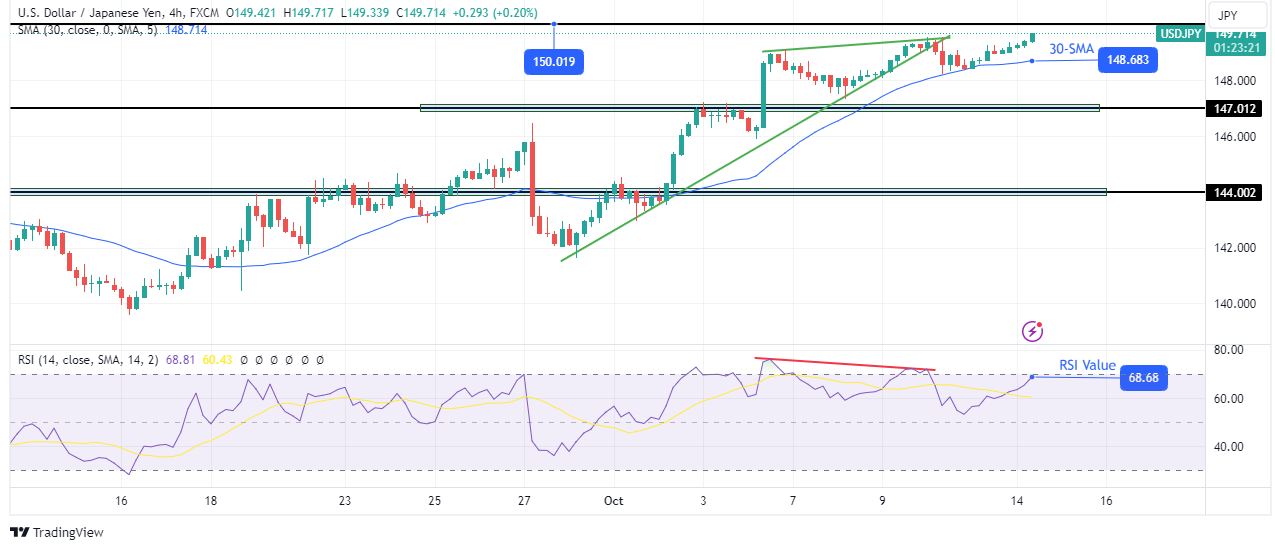
On the technical side, the USD/JPY price is climbing after retesting the 30-SMA support. The bullish bias is strong, with the price above the SMA. At the same time, the RSI trades near the overbought region. However, it showed some weakness with a slight bearish divergence.
–Are you interested to learn more about making money in forex? Check our detailed guide-
Furthermore, price action shows smaller candles that show exhaustion. Therefore, bulls might fail to breach the 150.01 resistance level. Meanwhile, a break below the SMA will show a shift in sentiment to bearish.
Looking to trade forex now? Invest at eToro!
67% of retail investor accounts lose money when trading CFDs with this provider. You should consider whether you can afford to take the high risk of losing your money.
EUR/USD moves up and down in a narrow range below 1.0950 in the European session on Monday after posting marginal losses in the previous week. The near-term technical outlook suggests that the bearish bias remains intact but the pair could have a difficult time gathering directional momentum.
The table below shows the percentage change of Euro (EUR) against listed major currencies last 7 days. Euro was the weakest against the US Dollar.
| USD | EUR | GBP | JPY | CAD | AUD | NZD | CHF | |
|---|---|---|---|---|---|---|---|---|
| USD | 0.41% | 0.41% | 0.46% | 1.59% | 0.99% | 1.21% | 0.12% | |
| EUR | -0.41% | 0.07% | 0.08% | 1.22% | 0.56% | 0.79% | -0.31% | |
| GBP | -0.41% | -0.07% | -0.02% | 1.16% | 0.49% | 0.76% | -0.26% | |
| JPY | -0.46% | -0.08% | 0.02% | 1.12% | 0.51% | 0.68% | -0.31% | |
| CAD | -1.59% | -1.22% | -1.16% | -1.12% | -0.57% | -0.38% | -1.45% | |
| AUD | -0.99% | -0.56% | -0.49% | -0.51% | 0.57% | 0.27% | -0.83% | |
| NZD | -1.21% | -0.79% | -0.76% | -0.68% | 0.38% | -0.27% | -1.04% | |
| CHF | -0.12% | 0.31% | 0.26% | 0.31% | 1.45% | 0.83% | 1.04% |
The heat map shows percentage changes of major currencies against each other. The base currency is picked from the left column, while the quote currency is picked from the top row. For example, if you pick the Euro from the left column and move along the horizontal line to the US Dollar, the percentage change displayed in the box will represent EUR (base)/USD (quote).
Mixed macroeconomic data releases from the US made it difficult for the US Dollar (USD) to preserve its bullish momentum last week, allowing EUR/USD to hold its ground. Although the Consumer Price Index and Producer Price Index figures for September arrived slightly above analysts’ estimates, the disappointing Initial Jobless Claims data revived concerns over a further softening of labor market conditions.
The economic calendar will not feature any high-tier data releases on Monday. Additionally, bond markets in the US will remain closed in observance of the Columbus Day holiday. Hence, EUR/USD is likely to extend its sideways grind in the second half of the day.
On Thursday, the European Central Bank (ECB) will announce monetary policy decisions. Investors could refrain from taking large positions ahead of this key event.
The Relative Strength Index (RSI) indicator on the 4-hour chart stays flat below 50, suggesting that the pair struggles to attract buyers, while consolidating the recent losses.
EUR/USD faces a pivot point at 1.0950, where Fibonacci 61.8% retracement of the latest uptrend is located. Once this level is confirmed as support, 1.1000 (Fibonacci 50% retracement) and 1.1050 (Fibonacci 38.2% retracement) could be seen as next resistance levels.
In case EUR/USD fails to reclaim 1.0950 and continues to use this level as resistance, supports could be spotted at 1.0900 (round level), 1.0870 (Fibonacci 78.6% retracement) and 1.0800 (round level).
The Euro is the currency for the 19 European Union countries that belong to the Eurozone. It is the second most heavily traded currency in the world behind the US Dollar. In 2022, it accounted for 31% of all foreign exchange transactions, with an average daily turnover of over $2.2 trillion a day. EUR/USD is the most heavily traded currency pair in the world, accounting for an estimated 30% off all transactions, followed by EUR/JPY (4%), EUR/GBP (3%) and EUR/AUD (2%).
The European Central Bank (ECB) in Frankfurt, Germany, is the reserve bank for the Eurozone. The ECB sets interest rates and manages monetary policy. The ECB’s primary mandate is to maintain price stability, which means either controlling inflation or stimulating growth. Its primary tool is the raising or lowering of interest rates. Relatively high interest rates – or the expectation of higher rates – will usually benefit the Euro and vice versa. The ECB Governing Council makes monetary policy decisions at meetings held eight times a year. Decisions are made by heads of the Eurozone national banks and six permanent members, including the President of the ECB, Christine Lagarde.
Eurozone inflation data, measured by the Harmonized Index of Consumer Prices (HICP), is an important econometric for the Euro. If inflation rises more than expected, especially if above the ECB’s 2% target, it obliges the ECB to raise interest rates to bring it back under control. Relatively high interest rates compared to its counterparts will usually benefit the Euro, as it makes the region more attractive as a place for global investors to park their money.
Data releases gauge the health of the economy and can impact on the Euro. Indicators such as GDP, Manufacturing and Services PMIs, employment, and consumer sentiment surveys can all influence the direction of the single currency. A strong economy is good for the Euro. Not only does it attract more foreign investment but it may encourage the ECB to put up interest rates, which will directly strengthen the Euro. Otherwise, if economic data is weak, the Euro is likely to fall. Economic data for the four largest economies in the euro area (Germany, France, Italy and Spain) are especially significant, as they account for 75% of the Eurozone’s economy.
Another significant data release for the Euro is the Trade Balance. This indicator measures the difference between what a country earns from its exports and what it spends on imports over a given period. If a country produces highly sought after exports then its currency will gain in value purely from the extra demand created from foreign buyers seeking to purchase these goods. Therefore, a positive net Trade Balance strengthens a currency and vice versa for a negative balance.
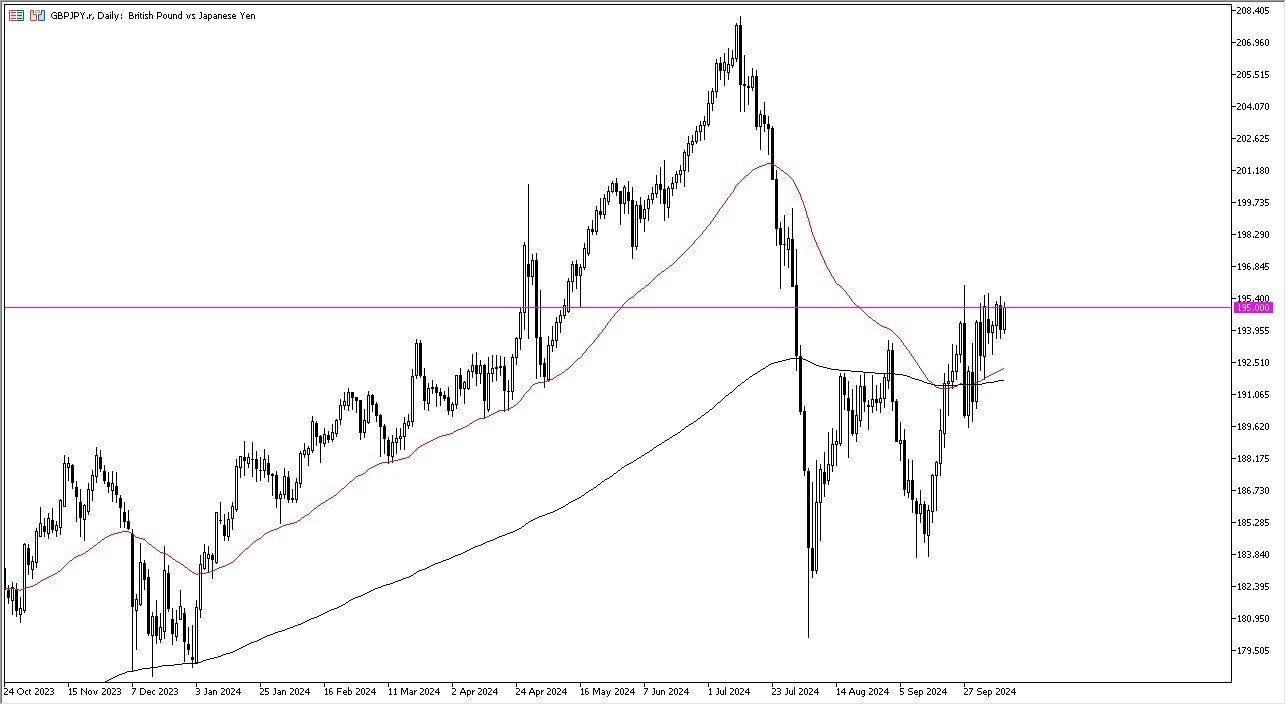
But really at this point in time, I think it is a little bit difficult to get overly aggressive at least until we clear this hurdle. That being said, if we do break above that hurdle, I think a lot of people will be paying close attention to this pair. I also believe it would have more to do with the Japanese yen than anything else as you would more likely than not see other yen related pairs skyrocketing.
If and when we do, then the market could very well run up to the 198 yen level, an area that has been important previously. With all of that being said, I think we have a situation where traders continue to see the potential for the carry trade to come back. This is especially true now that the Bank of Japan has finally come out recently and just admitted that, hey, there’s nothing we can do here as far as tightening monetary policy is concerned. So, with that being said, I think you have a situation where you’re buying dips and if we can finally get that move above 195 with a clean break to the upside, you start to chase that as well. I have no interest whatsoever in shorting this pair. The interest rate differential will continue to keep me long of this market going forward as I get paid at the end of every day.
Ready to trade our Forex daily forecast? We’ve shortlisted the best forex broker list for you to check out
Following the bearish action seen in the first half of the previous week, GBP/USD went into a consolidation phase. After closing virtually unchanged on Thursday and Friday, the pair continues to move sideways below 1.3100 to begin the new week.
The table below shows the percentage change of British Pound (GBP) against listed major currencies last 7 days. British Pound was the weakest against the US Dollar.
| USD | EUR | GBP | JPY | CAD | AUD | NZD | CHF | |
|---|---|---|---|---|---|---|---|---|
| USD | 0.39% | 0.43% | 0.46% | 1.59% | 0.97% | 1.19% | 0.12% | |
| EUR | -0.39% | 0.10% | 0.11% | 1.23% | 0.55% | 0.79% | -0.30% | |
| GBP | -0.43% | -0.10% | -0.04% | 1.14% | 0.45% | 0.72% | -0.28% | |
| JPY | -0.46% | -0.11% | 0.04% | 1.11% | 0.47% | 0.65% | -0.32% | |
| CAD | -1.59% | -1.23% | -1.14% | -1.11% | -0.59% | -0.40% | -1.45% | |
| AUD | -0.97% | -0.55% | -0.45% | -0.47% | 0.59% | 0.29% | -0.80% | |
| NZD | -1.19% | -0.79% | -0.72% | -0.65% | 0.40% | -0.29% | -1.03% | |
| CHF | -0.12% | 0.30% | 0.28% | 0.32% | 1.45% | 0.80% | 1.03% |
The heat map shows percentage changes of major currencies against each other. The base currency is picked from the left column, while the quote currency is picked from the top row. For example, if you pick the British Pound from the left column and move along the horizontal line to the US Dollar, the percentage change displayed in the box will represent GBP (base)/USD (quote).
Upbeat macroeconomic data releases from the UK helped Pound Sterling stay resilient against its rivals on Friday. The cautious market mood, however, made it difficult for GBP/USD to gather bullish momentum heading into the weekend. Meanwhile, the data from the US showed that the Producer Price Index (PPI) for final demand rose 1.8% on a yearly basis in September, coming in above the market expectation of 1.6% and supporting the USD.
Bond markets in the US will remain closed in observance of the Columbus Day holiday on Monday. As a result, thin trading conditions could limit GBP/USD’s volatility during the American trading hours on Monday.
On Tuesday, the UK’s Office for National Statistics will release labor market data, which will include wage inflation readings. On Wednesday, the UK Consumer Price Index (CPI) figures for September will be scrutinized by market participants.
GBP/USD needs to break out of the 1.3000-1.3100 trading range to gather directional momentum.
In case GBP/USD rises above 1.3100 (Fibonacci 78.6% retracement level of the latest uptrend) and starts using this level as support, 1.3170 (Fibonacci 61.8% retracement) and 1.3200 (200-period Simple Moving Average (SMA), round level) could be seen as next resistance levels.
On the downside, an extended slide toward 1.2940 (static level) could be seen if 1.3000 (round level, static level) support fails.
The Pound Sterling (GBP) is the oldest currency in the world (886 AD) and the official currency of the United Kingdom. It is the fourth most traded unit for foreign exchange (FX) in the world, accounting for 12% of all transactions, averaging $630 billion a day, according to 2022 data. Its key trading pairs are GBP/USD, also known as ‘Cable’, which accounts for 11% of FX, GBP/JPY, or the ‘Dragon’ as it is known by traders (3%), and EUR/GBP (2%). The Pound Sterling is issued by the Bank of England (BoE).
The single most important factor influencing the value of the Pound Sterling is monetary policy decided by the Bank of England. The BoE bases its decisions on whether it has achieved its primary goal of “price stability” – a steady inflation rate of around 2%. Its primary tool for achieving this is the adjustment of interest rates. When inflation is too high, the BoE will try to rein it in by raising interest rates, making it more expensive for people and businesses to access credit. This is generally positive for GBP, as higher interest rates make the UK a more attractive place for global investors to park their money. When inflation falls too low it is a sign economic growth is slowing. In this scenario, the BoE will consider lowering interest rates to cheapen credit so businesses will borrow more to invest in growth-generating projects.
Data releases gauge the health of the economy and can impact the value of the Pound Sterling. Indicators such as GDP, Manufacturing and Services PMIs, and employment can all influence the direction of the GBP. A strong economy is good for Sterling. Not only does it attract more foreign investment but it may encourage the BoE to put up interest rates, which will directly strengthen GBP. Otherwise, if economic data is weak, the Pound Sterling is likely to fall.
Another significant data release for the Pound Sterling is the Trade Balance. This indicator measures the difference between what a country earns from its exports and what it spends on imports over a given period. If a country produces highly sought-after exports, its currency will benefit purely from the extra demand created from foreign buyers seeking to purchase these goods. Therefore, a positive net Trade Balance strengthens a currency and vice versa for a negative balance.
Silver price (XAG/USD) extends its winning streak for the third consecutive day, trading around $31.30 per troy ounce during the Asian session on Monday. Silver price receives support from the safe-haven flows amid rising geopolitical tensions.
On Sunday, Hezbollah claimed responsibility for the drone attack in north-central Israel, killing at least four Israeli soldiers and over 60 people were injured, according to CNN. The number of injuries makes the attack one of the bloodiest on Israel since the war started last October.
China’s military initiated drills in the Taiwan Strait and around Taiwan on Monday. A spokesperson for the US Department of State expressed serious concern regarding the People’s Liberation Army’s (PLA) military actions. In response, Taiwan’s Defense Ministry stated, “We will not escalate conflict in our response.”
Non-yielding assets like Silver may have received support from rising expectations that the Federal Reserve (Fed) will slow the pace of interest rate cuts more than previously anticipated. Last week, data showed that US producer prices remained steady in September, alongside a surge in jobless claims, which challenged the perception of the US labor market’s resilience to restrictive interest rates.
According to the CME FedWatch Tool, markets are pricing in almost 87% chance of a 25 basis point rate cut in November, with no expectation of a 50 basis point reduction. Lower interest rates make Silver more attractive to investors seeking higher returns, as the opportunity cost of holding non-yielding assets decreases.
Silver is a precious metal highly traded among investors. It has been historically used as a store of value and a medium of exchange. Although less popular than Gold, traders may turn to Silver to diversify their investment portfolio, for its intrinsic value or as a potential hedge during high-inflation periods. Investors can buy physical Silver, in coins or in bars, or trade it through vehicles such as Exchange Traded Funds, which track its price on international markets.
Silver prices can move due to a wide range of factors. Geopolitical instability or fears of a deep recession can make Silver price escalate due to its safe-haven status, although to a lesser extent than Gold’s. As a yieldless asset, Silver tends to rise with lower interest rates. Its moves also depend on how the US Dollar (USD) behaves as the asset is priced in dollars (XAG/USD). A strong Dollar tends to keep the price of Silver at bay, whereas a weaker Dollar is likely to propel prices up. Other factors such as investment demand, mining supply – Silver is much more abundant than Gold – and recycling rates can also affect prices.
Silver is widely used in industry, particularly in sectors such as electronics or solar energy, as it has one of the highest electric conductivity of all metals – more than Copper and Gold. A surge in demand can increase prices, while a decline tends to lower them. Dynamics in the US, Chinese and Indian economies can also contribute to price swings: for the US and particularly China, their big industrial sectors use Silver in various processes; in India, consumers’ demand for the precious metal for jewellery also plays a key role in setting prices.
Silver prices tend to follow Gold’s moves. When Gold prices rise, Silver typically follows suit, as their status as safe-haven assets is similar. The Gold/Silver ratio, which shows the number of ounces of Silver needed to equal the value of one ounce of Gold, may help to determine the relative valuation between both metals. Some investors may consider a high ratio as an indicator that Silver is undervalued, or Gold is overvalued. On the contrary, a low ratio might suggest that Gold is undervalued relative to Silver.