The main category of Forex News.
You can use the search box below to find what you need.
[wd_asp id=1]
The main category of Forex News.
You can use the search box below to find what you need.
[wd_asp id=1]
At the same time, economic data showed that real wages in Japan fell by 0.6% in August after two months of increases, while household spending declined by 1.9%. recently, the yen has come under pressure after new Japanese Prime Minister Shigeru Ishiba and Economy Minister Ryusei Akizawa called for caution before raising interest rates further under current economic conditions.
Meanwhile, the US dollar received additional support from a stronger-than-expected US jobs report on Friday, which prompted markets to discount any chances of another 50-basis point rate cut by the Federal Reserve in November.
Elsewhere, Japan’s 10-year yields hover near a two-month high. According to trade, the yield on the 10-year Japanese government bond settled at around 0.92% on Tuesday, hovering near a two-month high and tracking a rise in US Treasury yields as investors recalibrated expectations for a rate cut by the Federal Reserve after the stronger-than-expected US jobs report in September. Now, financial markets see an 87% chance that the Fed will opt for a more modest 25 basis point cut in November, while discounting any chances of another half-percentage point cut.
Domestically, the Bank of Japan said in its latest quarterly report that rising prices and wages were spreading across Japan, but acknowledged concerns among small and medium-sized companies about falling margins. Meanwhile, data showed that real wages in Japan fell 0.6% in August after two months of increases, while household spending fell 1.9%.
According to the economic calendar, Japan’s services sector sentiment declined from a 5-month high. As announced, Japan’s services sector index fell to 47.8 in September 2024 from a five-month high of 49.0 in the previous month, but exceeded market expectations of 47.5. This represents the first decline in four months, driven by a decline in the services industry. In contrast, the food and beverage industry showed positive growth.
Meanwhile, the employment index rose. In addition, the business sentiment gauge accelerated, driven by an increase in the manufacturing industry. For now, the economic expectations index fell to 49.7 after hitting a five-month high of 50.3 in August, marking weakness for the first time since May, as the economy continues to show a gradual recovery amid the impact of price pressures.
According to stock trading platforms, US futures flat after market rebound. US stock futures were little changed on Wednesday after a tech-led rally on Wall Street in the previous session. In regular trading on Tuesday, the S&P 500 and the Nasdaq Composite jumped 0.97% and 1.45%, respectively, while the Dow Jones Industrial Average rose 0.3%. Nine of the 11 sectors in the S&P 500 ended higher, led by technology, telecommunications services and consumer discretionary stocks. Tech giants such as Nvidia (4.1%), Apple (1.8%) and Meta Platforms (1.4%) were notable performers. Meanwhile, energy and materials stocks, including Exxon Mobil (-2.7%), Chevron (-1.6%) and Southern Copper (-3.8%), were lower. Moreover, the moves came after a strong jobs report last week raised hopes for a soft landing by the Federal Reserve. Also, investors reacted to the sharp drop in crude oil prices, while the US 10-year yield remained above 4%.
However, investors expect more volatility in the run-up to the US presidential election. Now, financial markets are looking ahead to the latest Federal Reserve minutes and major banks’ earnings.

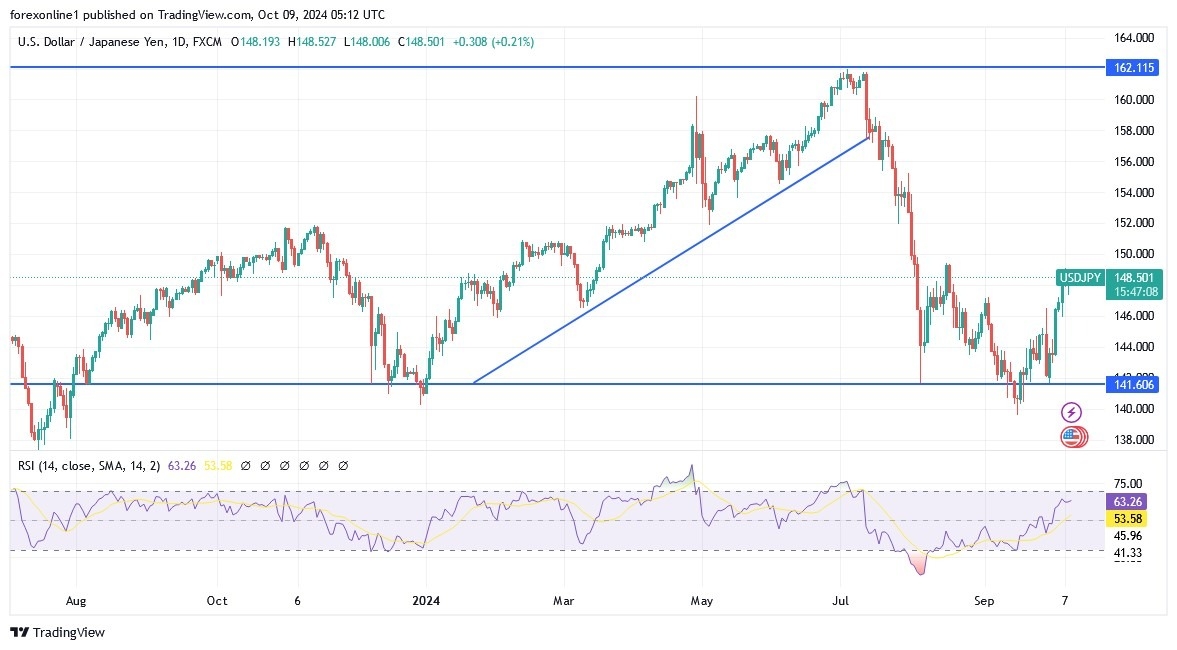
Based on the daily chart attached, the USD/JPY pair is in an upward channel that has recently formed and will strengthen if the pair moves above the psychological resistance level of 150.00. technically, there is a chance for this to happen if the minutes of the latest US Federal Reserve meeting are more hawkish and if US inflation figures come in stronger than expected. Conversely, the bears may find an opportunity to recoup recent losses. Furthermore, the support level of 145.90 is a real threat to the current upward rebound. Ultimately, we still prefer buying USD/JPY from any downward level.
Want to trade our USD/JPY forex analysis and predictions? Here’s a list of forex brokers in Japan to check out.
After posting small gains on Tuesday, EUR/USD stays on the back foot early Wednesday and trades in negative territory below 1.1000. The minutes of the Federal Reserve’s (Fed) September policy meeting could trigger the next directional move in the pair.
The table below shows the percentage change of Euro (EUR) against listed major currencies this week. Euro was the weakest against the Swiss Franc.
| USD | EUR | GBP | JPY | CAD | AUD | NZD | CHF | |
|---|---|---|---|---|---|---|---|---|
| USD | 0.11% | 0.26% | -0.01% | 0.74% | 0.92% | 1.23% | -0.12% | |
| EUR | -0.11% | 0.22% | -0.07% | 0.66% | 0.79% | 1.14% | -0.25% | |
| GBP | -0.26% | -0.22% | -0.33% | 0.46% | 0.57% | 0.95% | -0.35% | |
| JPY | 0.01% | 0.07% | 0.33% | 0.74% | 0.90% | 1.20% | -0.08% | |
| CAD | -0.74% | -0.66% | -0.46% | -0.74% | 0.20% | 0.50% | -0.86% | |
| AUD | -0.92% | -0.79% | -0.57% | -0.90% | -0.20% | 0.39% | -1.00% | |
| NZD | -1.23% | -1.14% | -0.95% | -1.20% | -0.50% | -0.39% | -1.33% | |
| CHF | 0.12% | 0.25% | 0.35% | 0.08% | 0.86% | 1.00% | 1.33% |
The heat map shows percentage changes of major currencies against each other. The base currency is picked from the left column, while the quote currency is picked from the top row. For example, if you pick the Euro from the left column and move along the horizontal line to the US Dollar, the percentage change displayed in the box will represent EUR (base)/USD (quote).
In the absence of high-tier data releases, the positive shift seen in risk mood made it difficult for the US Dollar (USD) to gather strength on Tuesday and helped EUR/USD hold its ground. The sharp decline in Asian stock indices cause investors to adopt a cautious stance early Wednesday, supporting the USD and weighing on the pair. At the time of press, US stock index futures were down between 0.25% and 0.3% on the day, pointing to a bearish opening in Wall Street.
After the September meeting, the Fed decided to lower the policy rate by 50 basis points (bps). Investors will pay close attention to discussions surrounding this decision within the minutes. In case the publication shows that policymakers keep an open mind about opting for large rate cuts in the near future, the immediate market reaction could cause the USD to weaken. According to the CME FedWatch Tool, markets are currently pricing in a 13% probability of the Fed lowering the policy rate by another 50 bps at the November meeting.
Meanwhile, European Central Bank (ECB) policymaker and Slovakian central bank Governor Peter Kazimir said on Wednesday that he is not convinced that they should decide on the policy on the basis of one good inflation figure. This comment, however, failed to support the Euro.
The Relative Strength Index (RSI) indicator on the 4-hour chart stays in the bearish territory but holds above 30, suggesting that EUR/USD has more room on the downside before turning technically oversold.
On the downside, 1.0950 (static level, Fibonacci 61.8% retracement of the latest uptrend) aligns as first support before 1.0900 (round level) and 1.0870 (Fibonacci 78.6% retracement). In case EUR/USD manages to reclaim 1.1000 (Fibonacci 50% retracement), next resistance could be seen at 1.1050 (Fibonacci 38.2% retracement) ahead of 1.1090-1.1100 (100-period Simple Moving Average (SMA), 200-period SMA, Fibonacci 23.6% retracement).
The Euro is the currency for the 19 European Union countries that belong to the Eurozone. It is the second most heavily traded currency in the world behind the US Dollar. In 2022, it accounted for 31% of all foreign exchange transactions, with an average daily turnover of over $2.2 trillion a day. EUR/USD is the most heavily traded currency pair in the world, accounting for an estimated 30% off all transactions, followed by EUR/JPY (4%), EUR/GBP (3%) and EUR/AUD (2%).
The European Central Bank (ECB) in Frankfurt, Germany, is the reserve bank for the Eurozone. The ECB sets interest rates and manages monetary policy. The ECB’s primary mandate is to maintain price stability, which means either controlling inflation or stimulating growth. Its primary tool is the raising or lowering of interest rates. Relatively high interest rates – or the expectation of higher rates – will usually benefit the Euro and vice versa. The ECB Governing Council makes monetary policy decisions at meetings held eight times a year. Decisions are made by heads of the Eurozone national banks and six permanent members, including the President of the ECB, Christine Lagarde.
Eurozone inflation data, measured by the Harmonized Index of Consumer Prices (HICP), is an important econometric for the Euro. If inflation rises more than expected, especially if above the ECB’s 2% target, it obliges the ECB to raise interest rates to bring it back under control. Relatively high interest rates compared to its counterparts will usually benefit the Euro, as it makes the region more attractive as a place for global investors to park their money.
Data releases gauge the health of the economy and can impact on the Euro. Indicators such as GDP, Manufacturing and Services PMIs, employment, and consumer sentiment surveys can all influence the direction of the single currency. A strong economy is good for the Euro. Not only does it attract more foreign investment but it may encourage the ECB to put up interest rates, which will directly strengthen the Euro. Otherwise, if economic data is weak, the Euro is likely to fall. Economic data for the four largest economies in the euro area (Germany, France, Italy and Spain) are especially significant, as they account for 75% of the Eurozone’s economy.
Another significant data release for the Euro is the Trade Balance. This indicator measures the difference between what a country earns from its exports and what it spends on imports over a given period. If a country produces highly sought after exports then its currency will gain in value purely from the extra demand created from foreign buyers seeking to purchase these goods. Therefore, a positive net Trade Balance strengthens a currency and vice versa for a negative balance.
Silver (XAG/USD) struggles to capitalize on the overnight bounce from the vicinity of the $30.00 psychological mark, or a three-week low and trades with a negative bias for the third successive day on Wednesday. The white metal is currently placed just above the mid-$30.00s and seems vulnerable to prolonging its retracement slide from the highest level since December 2012 touched last week.
From a technical perspective, the recent repeated failures to find acceptance above the $32.00 mark constitute the formation of a bearish multiple-tops pattern on the daily chart. Moreover, oscillators on the daily chart have started gaining negative traction and validate the near-term bearish outlook for the XAG/USD. Hence, a subsequent slide below the $30.00 mark, towards testing the next relevant support near the $29.75-$29.60 confluence, looks like a distinct possibility.
The latter comprises the 100-day Simple Moving Average (SMA) and the 50-day SMA, which if broken decisively should pave the way for a further near-term depreciating move. The XAG/USD might then accelerate the fall towards the $29.00 mark and eventually drop to the $28.60-$28.50 support zone.
On the flip side, any attempted recovery might now confront immediate resistance and remain capped near the $31.00 mark. That said, a sustained move beyond could trigger a short-covering move and lift the XAG/USD to the $31.55 hurdle en route to the $31.75-$31.80 region and the $32.00 mark. This is followed by the $32.25 supply zone, above which the white metal could aim to challenge the multi-year peak and make a fresh attempt to conquer the $33.00 round figure.
Silver is a precious metal highly traded among investors. It has been historically used as a store of value and a medium of exchange. Although less popular than Gold, traders may turn to Silver to diversify their investment portfolio, for its intrinsic value or as a potential hedge during high-inflation periods. Investors can buy physical Silver, in coins or in bars, or trade it through vehicles such as Exchange Traded Funds, which track its price on international markets.
Silver prices can move due to a wide range of factors. Geopolitical instability or fears of a deep recession can make Silver price escalate due to its safe-haven status, although to a lesser extent than Gold’s. As a yieldless asset, Silver tends to rise with lower interest rates. Its moves also depend on how the US Dollar (USD) behaves as the asset is priced in dollars (XAG/USD). A strong Dollar tends to keep the price of Silver at bay, whereas a weaker Dollar is likely to propel prices up. Other factors such as investment demand, mining supply – Silver is much more abundant than Gold – and recycling rates can also affect prices.
Silver is widely used in industry, particularly in sectors such as electronics or solar energy, as it has one of the highest electric conductivity of all metals – more than Copper and Gold. A surge in demand can increase prices, while a decline tends to lower them. Dynamics in the US, Chinese and Indian economies can also contribute to price swings: for the US and particularly China, their big industrial sectors use Silver in various processes; in India, consumers’ demand for the precious metal for jewellery also plays a key role in setting prices.
Silver prices tend to follow Gold’s moves. When Gold prices rise, Silver typically follows suit, as their status as safe-haven assets is similar. The Gold/Silver ratio, which shows the number of ounces of Silver needed to equal the value of one ounce of Gold, may help to determine the relative valuation between both metals. Some investors may consider a high ratio as an indicator that Silver is undervalued, or Gold is overvalued. On the contrary, a low ratio might suggest that Gold is undervalued relative to Silver.
GBP/USD managed to post small gains on Tuesday but failed to reclaim 1.3100. The pair stays relatively quiet in the European session on Wednesday as investors wait for the Federal Reserve (Fed) to publish the minutes of the September policy meeting.
The table below shows the percentage change of British Pound (GBP) against listed major currencies this week. British Pound was the weakest against the Japanese Yen.
| USD | EUR | GBP | JPY | CAD | AUD | NZD | CHF | |
|---|---|---|---|---|---|---|---|---|
| USD | 0.04% | 0.19% | -0.09% | 0.73% | 0.86% | 1.28% | -0.18% | |
| EUR | -0.04% | 0.22% | -0.11% | 0.72% | 0.80% | 1.24% | -0.25% | |
| GBP | -0.19% | -0.22% | -0.37% | 0.51% | 0.58% | 1.05% | -0.36% | |
| JPY | 0.09% | 0.11% | 0.37% | 0.81% | 0.93% | 1.32% | -0.06% | |
| CAD | -0.73% | -0.72% | -0.51% | -0.81% | 0.15% | 0.54% | -0.91% | |
| AUD | -0.86% | -0.80% | -0.58% | -0.93% | -0.15% | 0.48% | -0.98% | |
| NZD | -1.28% | -1.24% | -1.05% | -1.32% | -0.54% | -0.48% | -1.42% | |
| CHF | 0.18% | 0.25% | 0.36% | 0.06% | 0.91% | 0.98% | 1.42% |
The heat map shows percentage changes of major currencies against each other. The base currency is picked from the left column, while the quote currency is picked from the top row. For example, if you pick the British Pound from the left column and move along the horizontal line to the US Dollar, the percentage change displayed in the box will represent GBP (base)/USD (quote).
The recovery seen in Wall Street’s main indexes made it difficult for the US Dollar (USD) to gather strength during the American trading hours on Tuesday, allowing GBP/USD to cling to modest daily gains.
Early Wednesday, the souring market mood, after a nearly 7% decline recorded in China’s Shanghai Composite Index, caps GBP/USD’s upside.
The Fed cut the policy rate by 50 basis points (bps) after the September meeting. Investors will scrutinize the FOMC Minutes to see whether policymakers are willing to consider more large rate cuts in the near future.
If the publication shows that officials don’t think that they will need to continue to ease the policy aggressively moving forward, the immediate market reaction could support the USD. Nevertheless, the CME FedWatch Tool shows that markets already price in a nearly 90% probability of the Fed opting for a smaller, 25 bps, rate reduction at the November meeting. Hence, the positive impact of a hawkish FOMC Minutes on the USD could remain short-lived.
The Relative Strength Index (RSI) remains in the bearish territory, well below 50, while staying above 30, suggesting that GBP/USD could stretch lower before staging a technical correction.
Immediate support aligns at 1.3050 (static level) before 1.3000 (round level, static level) and 1.2940 (static level). In case GBP/USD manages to clear 1.3100 (Fibonacci 78.6% retracement level of the latest uptrend), it could extend its recovery toward 1.3170 (Fibonacci 61.8% retracement).
The Pound Sterling (GBP) is the oldest currency in the world (886 AD) and the official currency of the United Kingdom. It is the fourth most traded unit for foreign exchange (FX) in the world, accounting for 12% of all transactions, averaging $630 billion a day, according to 2022 data. Its key trading pairs are GBP/USD, also known as ‘Cable’, which accounts for 11% of FX, GBP/JPY, or the ‘Dragon’ as it is known by traders (3%), and EUR/GBP (2%). The Pound Sterling is issued by the Bank of England (BoE).
The single most important factor influencing the value of the Pound Sterling is monetary policy decided by the Bank of England. The BoE bases its decisions on whether it has achieved its primary goal of “price stability” – a steady inflation rate of around 2%. Its primary tool for achieving this is the adjustment of interest rates. When inflation is too high, the BoE will try to rein it in by raising interest rates, making it more expensive for people and businesses to access credit. This is generally positive for GBP, as higher interest rates make the UK a more attractive place for global investors to park their money. When inflation falls too low it is a sign economic growth is slowing. In this scenario, the BoE will consider lowering interest rates to cheapen credit so businesses will borrow more to invest in growth-generating projects.
Data releases gauge the health of the economy and can impact the value of the Pound Sterling. Indicators such as GDP, Manufacturing and Services PMIs, and employment can all influence the direction of the GBP. A strong economy is good for Sterling. Not only does it attract more foreign investment but it may encourage the BoE to put up interest rates, which will directly strengthen GBP. Otherwise, if economic data is weak, the Pound Sterling is likely to fall.
Another significant data release for the Pound Sterling is the Trade Balance. This indicator measures the difference between what a country earns from its exports and what it spends on imports over a given period. If a country produces highly sought-after exports, its currency will benefit purely from the extra demand created from foreign buyers seeking to purchase these goods. Therefore, a positive net Trade Balance strengthens a currency and vice versa for a negative balance.
Tata Coffee Share Price Target The National Stock Exchange (NSE) and the Bombay Stock Exchange (BSE) both list Tata Coffee Ltd. as a firm. We will examine the TATACOFFEE share price target for 2024, 2025, 2026, and up to 2030 in this in-depth essay. various technical analysis techniques to predict objectives through 2030 for long-term forecasts.
We will employ a machine learning technique, where the predicted data is based on historical performance, to project the price of TATACOFFEE through 2030. Over the years, Tata Coffee Ltd., which is well-known for its substantial position in the Indian share market, has demonstrated a number of patterns. This section covers the market position that TATACOFFEE now holds, its projected growth trajectory, and potential external market influences on its pricing performance through 2030. If you are a day trader, though, you can look up TATACOFFEE’s price goal for tomorrow.
In 2023, the majority of Indian stocks, including TATACOFFEE, saw an amazing bull run. The market’s optimistic outlook is expected to persist in the first quarter of 2024, despite the first months of consolidation. Technical research indicates that TATACOFFEE’s minimum share price objective for 2024 is anticipated to be ₹366.12, while the highest price target is anticipated to be ₹456.76.
| Month | Target |
|---|---|
| April 2024 target for TATACOFFEE | ₹366.12 |
| May 2024 target for TATACOFFEE | ₹377.45 |
| June 2024 target for TATACOFFEE | ₹388.78 |
| July 2024 target for TATACOFFEE | ₹400.11 |
| August 2024 target for TATACOFFEE | ₹411.44 |
| September 2024 target for TATACOFFEE | ₹422.77 |
| October 2024 target for TATACOFFEE | ₹434.1 |
| November 2024 target for TATACOFFEE | ₹445.43 |
| December 2024 target for TATACOFFEE | ₹456.76 |
By January 2025, the share price of TATACOFFEE is anticipate to have increase to Rs. 466. By December 2025, if the industry trend and macro and microeconomic factors continue to support them, the target price of Tata Coffee Ltd. might rise to Rs 523.
| Month | Target |
|---|---|
| January 2025 target for TATACOFFEE | ₹466 |
| February 2025 target for TATACOFFEE | ₹475 |
| March 2025 target for TATACOFFEE | ₹485 |
| April 2025 target for TATACOFFEE | ₹469 |
| May 2025 target for TATACOFFEE | ₹453 |
| June 2025 target for TATACOFFEE | ₹438 |
| July 2025 target for TATACOFFEE | ₹456 |
| August 2025 target for TATACOFFEE | ₹474 |
| September 2025 target for TATACOFFEE | ₹493 |
| October 2025 target for TATACOFFEE | ₹503 |
| November 2025 target for TATACOFFEE | ₹513 |
| December 2025 target for TATACOFFEE | ₹523 |
Zomato Share Price Target 2024
Adani Green Energy Share Price Target 2024
Technical analysis indicates that TATACOFFEE’s minimum share price objective is anticipated to reach Rs. 533, while the maximum value that TATACOFFEE shares can achieve is Rs. 600.
| Month | Target |
|---|---|
| January 2026 target for TATACOFFEE | ₹533 |
| February 2026 target for TATACOFFEE | ₹544 |
| March 2026 target for TATACOFFEE | ₹555 |
| April 2026 target for TATACOFFEE | ₹537 |
| May 2026 target for TATACOFFEE | ₹519 |
| June 2026 target for TATACOFFEE | ₹502 |
| July 2026 target for TATACOFFEE | ₹522 |
| August 2026 target for TATACOFFEE | ₹543 |
| September 2026 target for TATACOFFEE | ₹565 |
| October 2026 target for TATACOFFEE | ₹576 |
| November 2026 target for TATACOFFEE | ₹588 |
| December 2026 target for TATACOFFEE | ₹600 |
Based on Fibonacci estimates, Tata Coffee Ltd. (TATACOFFEE) is expect to trade between ₹612 and ₹575 in the first half of 2027. The price of a TATACOFFEE share could hit ₹686 by the second half of 2027.
| Month | Target |
|---|---|
| January 2027 target for TATACOFFEE | ₹612 |
| February 2027 target for TATACOFFEE | ₹624 |
| March 2027 target for TATACOFFEE | ₹636 |
| April 2027 target for TATACOFFEE | ₹615 |
| May 2027 target for TATACOFFEE | ₹595 |
| June 2027 target for TATACOFFEE | ₹575 |
| July 2027 target for TATACOFFEE | ₹598 |
| August 2027 target for TATACOFFEE | ₹622 |
| September 2027 target for TATACOFFEE | ₹647 |
| October 2027 target for TATACOFFEE | ₹660 |
| November 2027 target for TATACOFFEE | ₹673 |
| December 2027 target for TATACOFFEE | ₹686 |
| Month | Target |
|---|---|
| January 2028 target for TATACOFFEE | ₹700 |
| February 2028 target for TATACOFFEE | ₹714 |
| March 2028 target for TATACOFFEE | ₹728 |
| April 2028 target for TATACOFFEE | ₹704 |
| May 2028 target for TATACOFFEE | ₹681 |
| June 2028 target for TATACOFFEE | ₹658 |
| July 2028 target for TATACOFFEE | ₹684 |
| August 2028 target for TATACOFFEE | ₹711 |
| September 2028 target for TATACOFFEE | ₹739 |
| October 2028 target for TATACOFFEE | ₹754 |
| November 2028 target for TATACOFFEE | ₹769 |
| December 2028 target for TATACOFFEE | ₹784 |
| Month | Target |
|---|---|
| January 2029 target for TATACOFFEE | ₹800 |
| February 2029 target for TATACOFFEE | ₹816 |
| March 2029 target for TATACOFFEE | ₹832 |
| April 2029 target for TATACOFFEE | ₹804 |
| May 2029 target for TATACOFFEE | ₹777 |
| June 2029 target for TATACOFFEE | ₹751 |
| July 2029 target for TATACOFFEE | ₹781 |
| August 2029 target for TATACOFFEE | ₹812 |
| September 2029 target for TATACOFFEE | ₹844 |
| October 2029 target for TATACOFFEE | ₹861 |
| November 2029 target for TATACOFFEE | ₹878 |
| December 2029 target for TATACOFFEE | ₹896 |
RPOWER Share Price Target 2024
| Year | Initial Target | Mid-Year Target | Year-End Target |
|---|---|---|---|
| 2024 | ₹366.12 | ₹422.77 | ₹456.76 |
| 2025 | ₹466 | ₹438 | ₹523 |
| 2026 | ₹533 | ₹502 | ₹600 |
| 2027 | ₹612 | ₹575 | ₹686 |
| 2028 | ₹700 | ₹658 | ₹784 |
| 2029 | ₹800 | ₹751 | ₹896 |
| 2030 | ₹914 | ₹858 | ₹1024 |
Tata Power Share Price Target 2024
To sum up, using the most recent trade data and algorithms. We have produced the TATACOFFEE share price target for 2024, 2025, 2026, and up to 2030. For the upcoming years, these goals represent possible levels of support and resistance.
It’s important to remember that although technical analysis forms the basis of these price estimates. News and other market factors may also have an impact on the stock’s performance. Thus, rather than serving as financial advice. These fictitious aims should be used as guides. Make sure you do your own research before investing in anything.
When you look at the euro, the 1.12 level has offered a significant amount of resistance, and we ended up forming a large double top or M pattern. And therefore, a lot of traders will be looking at this through the prism of whether or not we can break above there. Whether or not that was actually a trend changing double top. If we break down below the 200 day EMA, which is currently just underneath the 1.09 level, then I think that confirms the downtrend. We will probably go looking to the 1.06 level.
If we can rally from here, and especially if we can take out the top of the candlestick from the Friday session, that would negate everything that happened after the jobs report in America, and more likely than not send the euro looking to the 1.12 level above, which of course has been such a headache for buyers. All things being equal, this is a pair that does tend to go back and forth between large round numbers, so pay attention to that as well. Because of this, the market is probably one that you need to look at through the prism of short-term back and forth trading or could also serve as a proxy for the US Dollar Index.
Ready to trade our EUR/USD Forex analysis? We’ve made a list of the best forex demo accounts worth trading with.
Gold price is taking a breather in the lead-up to the release of the Minutes of the US Federal Reserve (Fed) September policy meeting due later on Wednesday.
In Wednesday’s Asian trading, Gold price is attempting a tepid bounce, snapping a five-day downtrend. Gold traders eagerly await the Fed Minutes to assess the scale of the next interest rate cut, especially after Friday’s strong US Nonfarm Payrolls data took bets for a 50 basis points (bps) rate reduction off the table.
The Fed Minutes of the September meeting will likely show discussions about the labor market and inflation outlook, as well as, on the way forward on the interest rates. Lately, Fed policymakers continued to deliver dovish messages at their respective appearances, although maintaining a non-committal stance on the size of the next rate cut.
Bets for a smaller Fed rate cut have already weighed on Gold price so far this week, as buyers now seem to lack a bullish conviction due to mounting Chinese economic concerns on the lack of further stimulus announced by China. The Dragon Nation is the world’s top yellow metal consumer, and hence, rising economic worries could weigh over the physical demand for Gold from Chinese consumers.
The safe-haven Gold price, however, continues to find a ‘dip-buying’ demand, as escalating tensions between Israel and Iran raise risks of the conflict turning into a wider regional war.
Reuters reported early Wednesday, Israel Prime Minister Benjamin Netanyahu said Israeli airstrikes had killed two successors to Hezbollah’s slain leader, as Israel expanded its ground offensive against the Iran-backed group with a fourth army division deployed into south Lebanon.”
Ahead of the Fed Minutes, Gold price could find some trading incentives from speeches by Fed Vice Chair Philip Jefferson and San Francisco Fed President Mary Daly. Fed official Jerfferson said earlier on, the decision for a 50 bps rate cut in September “was timely and consistent” with the Fed’s two mandates of attaining 2% inflation and maximum employment.
Gold price outlook remains constructive from a short-term technical perspective even though sellers cracked the key static support of $2,630 on a daily closing basis.
The 14-day Relative Strength Index (RSI) is in a recovery mode while holding above the midline, currently near 56. This suggests that a Gold price rebound could be in the offing.
On the downside, the 21-day Simple Moving Average (SMA) at $2,619 must be defended to revive the upward trajectory to record highs.
A failure to do so will recall sellers, triggering a fresh sell-off in Gold price toward the $2,600 threshold. Additional downside pressure could target the September 20 low of $2,585.
On the flip side, Gold price needs a daily candlestick closing above the $2,650 psychological barrier to take on the lifetime high of $2,686 again.
Ahead of that, the strong resistance near $2,670 will come into play.
(This story was corrected on October 9 at 06:30 GMT to say that “Gold price outlook remains constructive from a short-term technical perspective even though sellers cracked the key static support,” not buyers.)
FOMC stands for The Federal Open Market Committee that organizes 8 meetings in a year and reviews economic and financial conditions, determines the appropriate stance of monetary policy and assesses the risks to its long-run goals of price stability and sustainable economic growth. FOMC Minutes are released by the Board of Governors of the Federal Reserve and are a clear guide to the future US interest rate policy.
Next release: Wed Oct 09, 2024 18:00
Frequency: Irregular
Consensus: –
Previous: –
Source: Federal Reserve
Image © Adobe Images
The big banks have raised their forecasts for the Pound against the Dollar into year-end.
An exclusive analysis of the predictions made by all the major investment banks for year-end 2024 shows the median point has risen by 200 pips since March.
The findings are contained in Corpay’s GBP/USD forecast guide, which is available to readers of Pound Sterling Live as a free discretionary download.
The mean forecast of over 40 investment bank analysts, all of which utilise their own bespoke models, has also risen by 200 pips.
Analysts at even the biggest institutions can get currency predictions wrong, and sometimes by a significant margin.
This is where a survey is useful, as it establishes a consensus forecast based on the mean and median views of all the analysts.
We think this gives the best possible projection for businesses and individuals with significant payment requirements to assess their risk/reward dynamics.
GBP/USD investment bank consensus forecasts: The end-2024 and 2025 guide from Corpay has been released. It shows a sizeable uplift was made to the consensus forecasts for GBP/USD. Please request a copy here.
The survey shows the highest forecast by any single institution remains unchanged, albeit some 700 pips above current levels in the spot.
The lowest forecast has also been lifted, and no single institution now thinks the Pound to Dollar exchange rate will fall below 1.20 in the outlook, as was the case in the second quarter.
The forecast guide also reveals what a select few well-known investment bank names are expecting.
Bank of America Merrill Lynch remains amongst the more bullish, seeing spot headed to 1.35 by the time 2024 ends.
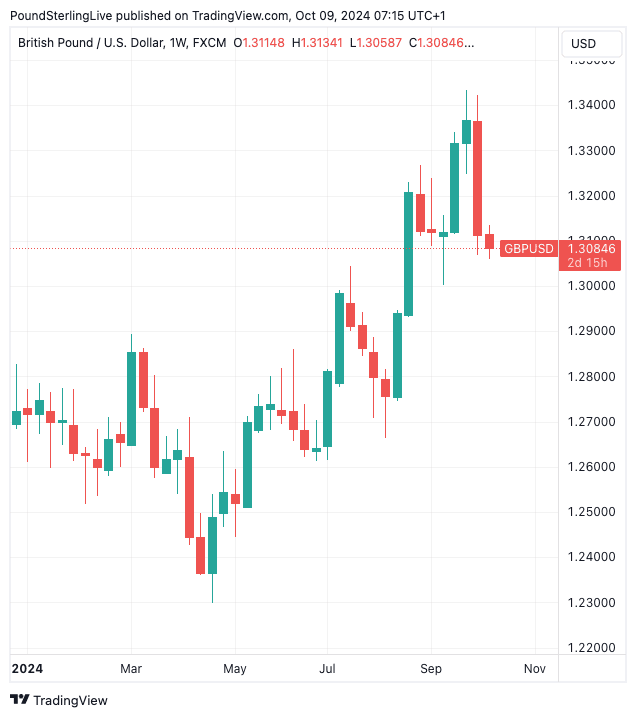
Above: GBP/USD in 2024.
Recently, Bank of America wrote the Pound will remain supported by a slow pace of interest rate cuts at the Bank of England.
“We continue to expect a slow cutting cycle with one more cut in November this year, four cuts in 2025 and two cuts in 2026 such that Bank Rate reaches a terminal rate of 3.25% by mid-2026,” says a note from Bank of America.
The Pound hit fresh 2024 highs against the Dollar in September but has since relinquished the highs, thanks to a reassessment of Federal Reserve interest rate policy.
Investors expect the Fed no longer has a window to cut rates by 50 basis points owing to a strong economy, instead it will have to opt for 25bp moves.
The Pound was meanwhile hampered by comments from the Bank of England’s Governor Andrew Bailey that the Bank could afford to be more “activist” when it comes to cutting interest rates.
“The perception that the BoE may cut interest rates more cautiously than the Fed and potentially the ECB have been a source of support for the pound. This view has been deeply shaken by comments made by BoE Governor Bailey in an interview with the Guardian newspaper,” says Jane Foley, Senior FX Strategist at Rabobank.
The next major event for the Sterling is the release of September’s inflation numbers in mid-October. This will determine whether the Bank cuts again in early November or waits until December.
Silver (XAG/USD) struggles to capitalize on the overnight bounce from the vicinity of the $30.00 psychological mark, or a three-week low and trades with a negative bias for the third successive day on Wednesday. The white metal is currently placed just above the mid-$30.00s and seems vulnerable to prolonging its retracement slide from the highest level since December 2012 touched last week.
From a technical perspective, the recent repeated failures to find acceptance above the $32.00 mark constitute the formation of a bearish multiple-tops pattern on the daily chart. Moreover, oscillators on the daily chart have started gaining negative traction and validate the near-term bearish outlook for the XAG/USD. Hence, a subsequent slide below the $30.00 mark, towards testing the next relevant support near the $29.75-$29.60 confluence, looks like a distinct possibility.
The latter comprises the 100-day Simple Moving Average (SMA) and the 50-day SMA, which if broken decisively should pave the way for a further near-term depreciating move. The XAG/USD might then accelerate the fall towards the $29.00 mark and eventually drop to the $28.60-$28.50 support zone.
On the flip side, any attempted recovery might now confront immediate resistance and remain capped near the $31.00 mark. That said, a sustained move beyond could trigger a short-covering move and lift the XAG/USD to the $31.55 hurdle en route to the $31.75-$31.80 region and the $32.00 mark. This is followed by the $32.25 supply zone, above which the white metal could aim to challenge the multi-year peak and make a fresh attempt to conquer the $33.00 round figure.
Silver is a precious metal highly traded among investors. It has been historically used as a store of value and a medium of exchange. Although less popular than Gold, traders may turn to Silver to diversify their investment portfolio, for its intrinsic value or as a potential hedge during high-inflation periods. Investors can buy physical Silver, in coins or in bars, or trade it through vehicles such as Exchange Traded Funds, which track its price on international markets.
Silver prices can move due to a wide range of factors. Geopolitical instability or fears of a deep recession can make Silver price escalate due to its safe-haven status, although to a lesser extent than Gold’s. As a yieldless asset, Silver tends to rise with lower interest rates. Its moves also depend on how the US Dollar (USD) behaves as the asset is priced in dollars (XAG/USD). A strong Dollar tends to keep the price of Silver at bay, whereas a weaker Dollar is likely to propel prices up. Other factors such as investment demand, mining supply – Silver is much more abundant than Gold – and recycling rates can also affect prices.
Silver is widely used in industry, particularly in sectors such as electronics or solar energy, as it has one of the highest electric conductivity of all metals – more than Copper and Gold. A surge in demand can increase prices, while a decline tends to lower them. Dynamics in the US, Chinese and Indian economies can also contribute to price swings: for the US and particularly China, their big industrial sectors use Silver in various processes; in India, consumers’ demand for the precious metal for jewellery also plays a key role in setting prices.
Silver prices tend to follow Gold’s moves. When Gold prices rise, Silver typically follows suit, as their status as safe-haven assets is similar. The Gold/Silver ratio, which shows the number of ounces of Silver needed to equal the value of one ounce of Gold, may help to determine the relative valuation between both metals. Some investors may consider a high ratio as an indicator that Silver is undervalued, or Gold is overvalued. On the contrary, a low ratio might suggest that Gold is undervalued relative to Silver.
Morgan Stanley has bumped its forecast for Brent crude oil in the final quarter of 2024 to $80 / Barrel
MS cite heightened geopolitical risk.
MS are wary though, saying demand is weaker than expected and supply has been robust. And thus warn of a widening surplus in the market into next year.
—
Oil update, dipped back from its recent high on Wednesday: