The main category of Forex News.
You can use the search box below to find what you need.
[wd_asp id=1]
The main category of Forex News.
You can use the search box below to find what you need.
[wd_asp id=1]
Rising consumer spending and inflation could increase expectations of a Q4 2024 Bank of Japan rate hike. A more hawkish BoJ rate path may lead to a USD/JPY drop toward 147.5.
Japan’s new prime minister, Shigeru Ishiba, recently poured cold water on expectations of a Q4 2024 BoJ rate hike, saying the country was not ready for further rate hikes. However, the BoJ’s latest regional quarterly report suggested a Q4 2024 rate hike remains possible.
The report showed improvement across all nine regions, although some reported weakness in part. Hokuriku and Tokai reported improving economic recoveries, while Kanto and Kinki, among Japan’s main regional contributors to GDP, reported moderate economic recoveries. A sustained recovery would likely boost expectations of a Q4 2024 BoJ rate hike.
Amidst shifting sentiment toward the BoJ rate path, investors should monitor BoJ Board Member speeches. Their insights could influence demand for the Yen and sentiment toward the BoJ rate path. While the Japanese government may comment on monetary policy, the BoJ remains independent.
In the US session, the Fed will be under the spotlight. The FOMC Meeting Minutes from September will draw interest. The minutes will offer insights into the economic outlook and interest rate path, though the recent US Jobs Report could limit the impact on the USD/JPY.
Investors should also monitor FOMC member speeches. FOMC members Thomas Barkin, Austan Goolsbee, Philip Jefferson, and Fed Vice Chair John Williams are on the calendar to speak. Their reactions to the US Jobs Report and views on the timeline for a Fed rate cut could impact US dollar demand. Calls to delay rate cuts may push the USD/JPY toward 150.
The USD/JPY remains virtually unchanged after dropping to a two-day low of 147.55 amid hopes of a ceasefire between Hezbollah and Israel, as stated by Hezbollah’s prominent leader, according to CNN. At the time of writing, the pair trades at 148.17, flat.
Although the USD/JPY paused its uptrend, the pair resumed its advance.
The pair hit a weekly low of 147.34, but buyers moving in pushed the exchange rate above the 148.00 psychological figure, opening the door for further upside.
The Relative Strength Index (RSI) shows bulls in charge, even though it shows momentum paused.
For USD/JPY buyers to resume the uptrend, the first resistance will be the October 7 high at 149.14. A breach of the latter will expose the August 15 high of 149.39, followed by the 150.00 figure. Once those areas are surpassed, buyers will eye the 200-day moving average (DMA) at 151.13.
On the flip side, if USD/JPY drops below the Ichimoku Cloud (Kumo) at 146.60-80, this could pave the way for further downside.
The table below shows the percentage change of Japanese Yen (JPY) against listed major currencies today. Japanese Yen was the strongest against the Swiss Franc.
| USD | EUR | GBP | JPY | CAD | AUD | NZD | CHF | |
|---|---|---|---|---|---|---|---|---|
| USD | -0.05% | -0.16% | 0.00% | 0.20% | 0.15% | -0.19% | 0.34% | |
| EUR | 0.05% | -0.11% | 0.07% | 0.25% | 0.20% | -0.16% | 0.38% | |
| GBP | 0.16% | 0.11% | 0.16% | 0.35% | 0.31% | -0.06% | 0.50% | |
| JPY | 0.00% | -0.07% | -0.16% | 0.31% | 0.14% | -0.21% | 0.34% | |
| CAD | -0.20% | -0.25% | -0.35% | -0.31% | -0.05% | -0.39% | 0.14% | |
| AUD | -0.15% | -0.20% | -0.31% | -0.14% | 0.05% | -0.36% | 0.21% | |
| NZD | 0.19% | 0.16% | 0.06% | 0.21% | 0.39% | 0.36% | 0.55% | |
| CHF | -0.34% | -0.38% | -0.50% | -0.34% | -0.14% | -0.21% | -0.55% |
The heat map shows percentage changes of major currencies against each other. The base currency is picked from the left column, while the quote currency is picked from the top row. For example, if you pick the Japanese Yen from the left column and move along the horizontal line to the US Dollar, the percentage change displayed in the box will represent JPY (base)/USD (quote).
Most Read: USD/CHF Technical Outlook: Confluence Area Hints at Bullish Breakout
Gold prices tumbled in today’s US session having enjoyed a positive European session to say the least. The precious metal rallied from a low of 2628 in the European session to trade at a high of 2652 before the US open.
The US session however brought some renewed US Dollar strength, as Gold’s appeal appears to be waning. This was also the first US trading session since the National Development and Reform commission in China provided a briefing on the recent stimulus measures. The address today however failed to deliver any new measures and concern still lingers among many market participants.
China, the largest global consumer of metals, has dampened metals demand for over two years. Despite the Peoples Bank of China buying significant amounts of Gold there have been growing concerns of a widespread economic slowdown, especially the property sector crisis, has pressured copper and other industrial metals. Despite numerous property support measures this year, they have yet to significantly boost metals demand.
This renewed concern around China could not have come at a worse time for Gold Bulls. The aggressive repricing of rate cuts over the last few days coupled with the lack of response to the Iranian missile attack has formed the perfect cocktail for a pullback in Gold prices.
The question is whether this is the end of the bullish rally?
That is a very nuanced question given the various factors at play. For one though, the Middle East crisis is far from being resolved and the chance of escalation is certainly higher following the Iranian missile attack last week. There is bound to be an Israeli response which Iran has vowed will be met by a new attack as well.
These dynamics mean the Middle East situation could still blowover reigniting the safe haven appeal of Gold. Looking even further down the line, the World Gold Council September report was released today.
According to the latest World Gold Council (WGC) report, net ETF inflows increased again in September. ETF flow levels are often seen as a strong indicator of future demand trends. Gold-backed ETFs added 18 tonnes of gold in September, bringing total holdings to 3,200 tonnes. This led to cumulative inflows of $1.4 billion for the month, marking the fifth consecutive month of inflows.
This data follows similar trends in August, when Gold ETFs saw $2.1 billion in inflows, and July, which recorded $3.7 billion—the highest since April 2022.
Source: WGC Report (click to enlarge)
This coupled with the World Gold Council survey of Central Banks earlier this year hint that Gold demand is to remain strong in the medium to longer term. This would suggest that support for Gold remains and thus the current pullback could just be another false dawn. Either way i am intrigued to see how far today’s pullback may run.
FOMC minutes will be released tomorrow in what I expect to be a non-event following the jobs data release last week. The Fed meeting on September 18 would likely have been dominated by concern around an ailing labor market which last week’s jobs report put to bed for the time being.
US CPI on Thursday is likely to be the next major market moving event, however tomorrow’s list of Fed Speakers may also contribute to some volatility.

For all market-moving economic releases and events, see the MarketPulse Economic Calendar. (click to enlarge)
From a technical analysis standpoint, Gold had been caught in a tight range of around $30 since the start of October. There were brief tests below the 2640 handle in recent days but the four-hour candle always closed back inside the range low at 2640.
The breakout today has been quite aggressive with Gold reaching a low around the 2604 handle before bouncing to trade around 2614 at the time of writing. As mentioned technically Gold is due for a deeper pullback but the fundamental risks continue to underpin prices and keep selling pressure at bay.
If the selloff continues tomorrow, immediate support rests around 2600 before the 2574 handle comes into focus. 2574 could prove a tough hurdle to clear as just below it rests the 200-day MA making this a key area of confluence that could find some buying pressure.
Alternatively, a recovery from here may face a challenge at 2624 before the 100-day MA at 2630 becomes key. Beyond that and the previous H4 range low at 2640 could be key for bulls to regain control of the narrative moving forward.
GOLD (XAU/USD) Four-Hour (H4) Chart, October 8, 2024

Source: TradingView (click to enlarge)
Support
Resistance
Follow Zain on Twitter/X for Additional Market News and Insights @zvawda
Content is for general information purposes only. It is not investment advice or a solution to buy or sell securities. Opinions are the authors; not necessarily that of OANDA Business Information & Services, Inc. or any of its affiliates, subsidiaries, officers or directors. If you would like to reproduce or redistribute any of the content found on MarketPulse, an award winning forex, commodities and global indices analysis and news site service produced by OANDA Business Information & Services, Inc., please access the RSS feed or contact us at info@marketpulse.com. Visit https://www.marketpulse.com/ to find out more about the beat of the global markets. © 2023 OANDA Business Information & Services Inc.

He has spent the last 3 years in an analyst role honing his skills across various financial domains, including technical analysis, economic data interpretation, price action strategies, and analyzing the geopolitical impacts on global markets. Currently, Zain is advancing in obtaining his Capital Markets & Security Analyst (CMSA) designation through the Corporate Finance Institute (CFI), where he has completed modules in fixed income fundamentals, portfolio management fundamentals, equity market fundamentals, introduction to capital markets, and derivative fundamentals.
He is also a regular guest on radio and television programs in South Africa, providing insight into global markets and the economy. Additionally, he has contributed to the development of a financial markets course approved by BankSeta (Banking Sector Education and Training Authority) at NQF level 6 in South Africa.

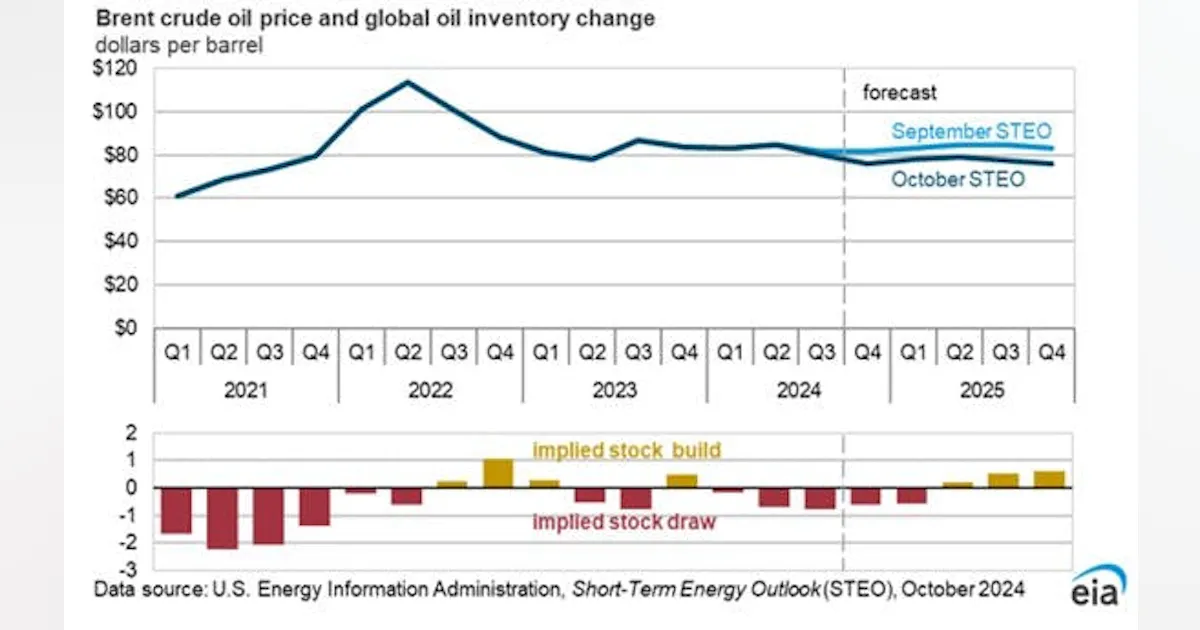
In the October Short-Term Energy Outlook (STEO), the US Energy Information Administration (EIA) lowered its Brent crude oil spot price forecast through end-2025.
The latest outlook predicts an average Brent price of $78/bbl in 2025, $7/bbl less than last month’s forecast. Lower crude oil prices largely reflect a reduction for global oil demand growth in 2025, according to EIA.
“We forecast that global consumption of liquid fuels will increase by 900,000 b/d in 2024 and 1.3 million b/d in 2025. Our 2024 forecast is down from last month due to downward revisions to demand in China and our 2025 forecast is down primarily because of downward revisions to demand in OECD countries,” EIA said.
“We reduced our forecast for China’s liquid fuels consumption in 2024 because of continued declines in the country’s crude oil imports and refinery runs in third quarter 2024. Although the Chinese government recently announced monetary stimulus measures that could result in higher economic growth and petroleum consumption in 2025, we have kept our forecast 2025 growth rate largely unchanged. We forecast China’s petroleum and liquid fuels consumption will grow by about 100,000 b/d in 2024 and 300,000 b/d in 2025,” the report continued.
“We reduced our forecast of total OECD oil consumption by 200,000 b/d in 2025 compared with last month’s STEO as a result of weaker expectations for industrial production and manufacturing growth in the US and Canada.”
Most of EIA’s expected global liquid fuels demand growth is from non-OECD countries where liquid fuels consumption increases by 1 million b/d in 2024 and 1.2 million b/d in 2025, in contrast to consumption in OECD countries, which falls by 100,000 b/d in 2024 before increasing by a similar amount in 2025.
“Although we reduced our crude oil price forecast, crude oil prices have risen in recent days because of escalating conflict in the Middle East, raising the possibility of oil supply disruptions and further crude oil price increases,” EIA noted.
The Brent crude oil spot price averaged $74/bbl in September, a decrease of $6/bbl from August. Prices dropped as concerns over global oil demand growth outweighed reductions in oil inventories and OPEC+ members’ decision to delay production increases until December 2024. However, after recent military actions involving Israel, Lebanon, and Iran, the Brent spot price increased to $79/bbl on Oct. 4, up 11% from the previous week.
“The potential for further escalation– such as an Israeli response to Iran’s missile attack on October 1– have injected significant uncertainty and volatility into oil markets in recent days. Following the September drop in prices and our expectation that oil demand growth will be lower next year than we had previously forecast, we have lowered our forecast for crude oil prices despite increasing oil prices in early October. We now expect Brent will average $78/b in 2025, $7/bbl less than our forecast from last month,” EIA said.
EIA anticipates that production growth outside of OPEC+ will remain strong over the forecast period, and as a result OPEC+ producers will likely keep production less than their recently announced targets for much of next year.
EIA expects that global production of petroleum and other liquid fuels will increase by 2 million b/d in 2025, up from growth of just 500,000 b/d this year. Countries outside of OPEC+ are expected to increase production by 1.4 million b/d next year, while OPEC+ production will increase by 700,000 b/d, after the voluntary cuts reduced OPEC+ production by 1.3 million b/d this year.
“In addition to voluntary cuts to OPEC+ production, a force majeure in Libya in August and September reduced oil production. We estimate Libya’s crude oil production fell to 400,000 b/d in September 2024 from nearly 1.2 million b/d in July 2024 before the disruptions began,” EIA said.
“As of early October, it appears the cause of the disruption has come to a resolution, with affected production potentially restarting in October. We assume Libya’s oil production will average 600,000 b/d for the rest of this year.”
EIA also revised its estimate of Iraq’s crude oil production, including historical production, up by an average of 200,000 b/d in 2024 to account for assessment that more crude oil is being used in new refining capacity in Iraq than the agency had previously determined.
“Although we raised our assessment of Iraq’s oil production, we still estimate that Iraq cut its crude oil production by 300,000 b/d from July through September 2024 to comply with OPEC+ production quotas.”
In this month’s outlook, EIA educed its 2025 forecast for US Lower 48 states (L48) crude oil production from last month by 1% to 11.3 million b/d. This reduction reflects a downward revision to EIA’s West Texas Intermediate (WTI) crude oil price forecast.
EIA now expects WTI will average $72/bbl in fourth-quarter 2024, about $6/bbl lower than last month’s forecast. Because there is about a 6-month lag between price changes and producer activity, the recent price declines will begin reducing US crude oil production in mid-2025. By December 2025, US L48 crude oil production will be 11.4 million b/d, 2% lower than EIA’s September STEO forecast.
The Arabica coffee bean prices is not merely a simple figure; it results from the complex interplay of numerous natural, economic, market, and geopolitical factors. This article delves into the analysis of the factors influencing the price of Arabica coffee beans, offering an overview of historical price fluctuations and providing forecasts for future price trends. By thoroughly understanding the drivers behind Arabica price volatility, we can better assess its impact on the coffee industry as a whole and the livelihoods of millions of people involved in the coffee value chain.
Arabica coffee accounts for about 60-70% of global coffee production and is considered the highest-quality coffee. Its price has far-reaching effects for several reasons:
Global Supply Chain: Arabica prices directly affect the income of millions of coffee farmers in developing countries such as Brazil, Colombia, Ethiopia, and Vietnam. Price fluctuations can significantly impact their livelihoods.
Market Benchmarking: Arabica prices are often used as a benchmark for pricing other coffee varieties, including Robusta. Hence, it indirectly influences the entire coffee market.
Impact on Consumers: When Arabica prices rise, roasters and retailers often have to increase the prices of their final products, directly affecting the cost for consumers enjoying their coffee.
Economic Impact: For major coffee-exporting countries, Arabica price volatility can significantly influence GDP and the trade balance.
Product Quality and Diversity: Pricing affects the ability of farmers and producers to invest in quality and innovation, which, in turn, influences the diversity and quality of coffee products in the market.
a) Climate:
b) Soil Conditions:
a) Supply and demand:
b) Production costs:
c) Government policies:
a) Futures trading:
b) Speculation:
c) Consumer trends:

Chart of Price Fluctuations for Robusta and Arabica Coffee Each Year
a) Wars and conflicts:
Conflicts in major coffee-producing countries can disrupt supply chains and drive prices higher.
b) Economic crises:
Global economic downturns can reduce coffee consumption, impacting prices.
c) Trade policies:
Trade agreements or barriers (such as tariffs) can affect the flow of coffee on the international market, influencing prices.
2000-2005: Period of low prices
2006-2011: Period of strong price growth
Supply shortages due to severe droughts in Brazil (2007-2008) and heavy rains in Colombia (2009-2010).
Strong market speculation due to the 2008 financial crisis.
Growth of the specialty coffee industry, increasing demand for high-quality Arabica.

High profits for farmers, but also creates challenges for roasters and retailers in maintaining profit margins
2012-2019: Period of price decline and relative stability
Strong production recovery, particularly in Brazil, thanks to investment in farming technologies and new coffee varieties.
Growth of Vietnam’s coffee industry, primarily Robusta, but also influencing overall supply-demand dynamics.
Depreciation of the Brazilian real against the USD, encouraging exports and lowering global coffee prices.
2020-2023: Period of extreme volatility due to pandemic and climate extremes
2020: The COVID-19 pandemic caused initial price declines due to demand concerns, followed by price increases due to supply chain disruptions.
2021: Severe frost in Brazil (July 2021) destroyed around 20% of the crop, pushing prices to a seven-year high.
2022-2023: Global inflation and ongoing supply chain disruptions continued to cause price volatility.
Impact: Rising costs across the coffee value chain, from farmers to end consumers.
Brazil’s role
Climate change
Consumption demand
Farming technology
Environmental and sustainability policies
Price increase scenario
Price decrease scenario
Stable price scenario
Extreme climate risk
Increasing likelihood of abnormal weather events (e.g., El Niño, La Niña), which could cause unexpected supply shocks, leading to significant price volatility.

Climate change is one of the top issues in the coffee industry as a whole.
Geopolitical risks
Macroeconomic risks
Pandemic risks
Conclusion:
Arabica coffee prices are complex, reflecting interactions among various natural, economic, political, and social factors. As climate change and global challenges intensify, accurately forecasting Arabica coffee price trends has become more difficult than ever. However, by thoroughly understanding the influencing factors and analyzing historical trends, we can make reasonable predictions about the future of Arabica coffee prices.
Arabica coffee is typically more expensive than Robusta for several reasons:
Fluctuations in Arabica coffee prices affect coffee shop prices in various ways:
No, Arabica coffee quality can vary significantly:
Consumers can manage rising Arabica coffee prices by:
Climate change may severely impact the future of Arabica coffee:
These challenges may lead to scarcity and higher prices for Arabica coffee in the future, driving the need for innovation in the global coffee industry.
The most important data of the month came on Friday in the form of the US Non-Farm Payrolls report, which showed an unexpected improvement in the employment situation in the United States. 254,000 jobs were created in September, beating expectations of a reading of 147,000. Any hopes of a 50bp rate cut by the US before the end of the year have been dealt a major blow by this data, with investors wondering whether they will succeed in cutting rates by 25bps twice. In fact, a 25bp rate cut by the US is not out of the realm of reality.
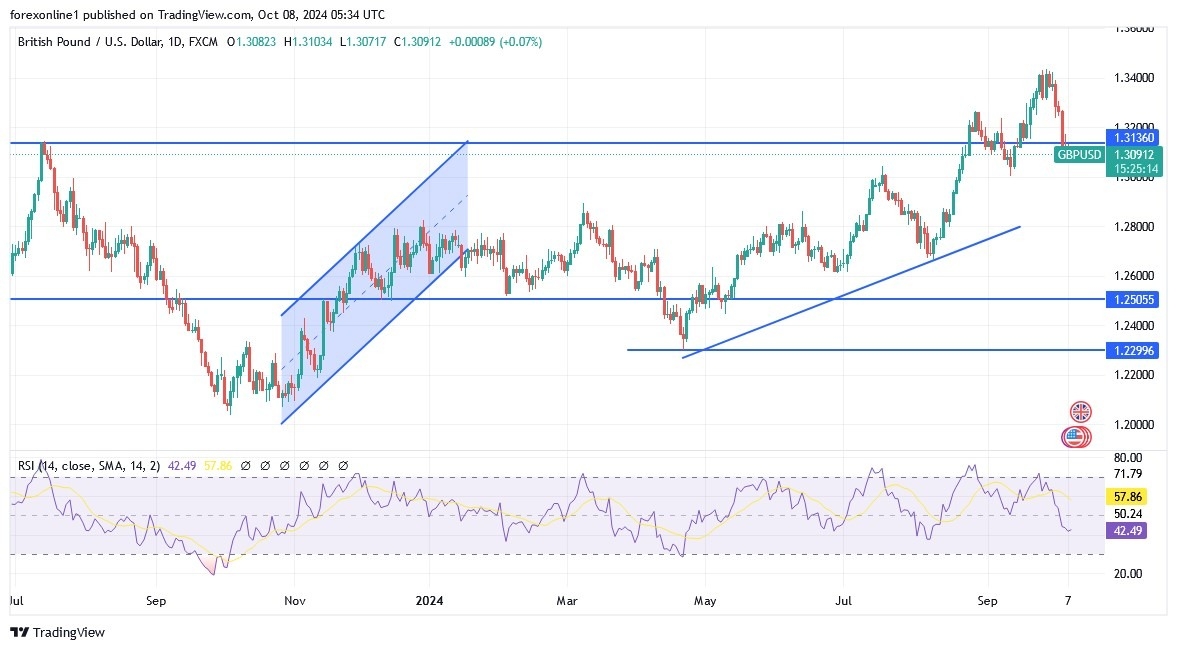
Therefore, there has been a significant adjustment in expectations, and with a weekly decline of 2.0% in the rearview mirror, it is possible to buy some dips in the GBP/USD pair. According to reliable trading platforms, the GBP/USD pair has now retreated to its 50-day moving average at 1.3078, which provided support on Friday. Concurrently, this forms a near-term support level to watch this week and some pullback from the strong selling around these levels could occur.

Technically, I would caution that any confirmed break below the 50-day moving average at any point in the coming days could represent a more determined breakdown underway that could risk turning GBP/USD from a medium-term uptrend to a downtrend. Downside risks also come in the form of ongoing geopolitical concerns cantered around the Middle East. Overall, the GBP/USD rally will be contained below the 2024 highs (1.34) and it will take signs of renewed slowdown in the US economy to drive the next phase of GBP/USD’s rally.
We will not get any chance of the data needed to drive this narrative until later. According to the economic calendar, the US inflation report on Thursday is the highlight of the week, as it will determine how market sentiment evolves in line with expectations of interest rate cuts by the Federal Reserve. Therefore, a reading below expectations would boost hopes that the Federal Reserve will cut interest rates twice more in 2024, which could strengthen the pound sterling against the euro and the US dollar.
For now, the market is looking for a reading of 2.3% on an annual basis and 0.1% monthly. Ultimately, anything higher could push back expectations of interest rate cuts further and could cause the pound sterling to suffer until the end of the week.
Ready to trade our GBP/USD Forex analysis? We’ve made this UK forex brokers list for you to check out.
Image © European Union – European Parliament, Reproduced Under CC Licensing.
The Euro to Dollar exchange rate is forecast to see further losses in the coming days and weeks, with one saying a return to 1.0780 is not impossible.
The Dollar’s resurgence brings an end to the Euro’s 2024 rally, at least in the near term, according to Tanmay Purohit, a technical analyst at Société Générale.
“EUR/USD struggled to overcome the peak of August near 1.1200 in a recent attempt to form a double top,” says Purohit.
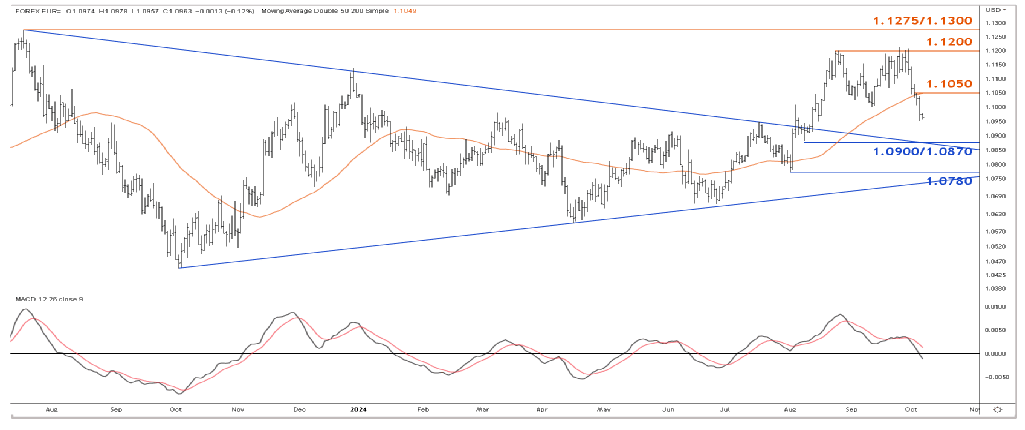
Subsequently, the Euro-Dollar gave up the 50-DMA (1.1050) and dipped below the neckline of the pattern, denoting the risk of a deeper pullback.
The developments follow a strong of better-than-forecast U.S. data points that confirm the U.S. economy is not about to fall into recession, and that there is little pressing need for further interest rates cuts from the Federal Reserve.
To be sure, more cuts are coming, but not as thick and fast as once thought.

At the same time, the European Central Bank (ECB) will be under pressure to act again given the slowdown in the Eurozone economy, with a potential consecutive rate cut coming at next week’s meeting.
The divergence in rate path expectations puts Euro-Dollar back under pressure, and technical analysts are tasked with assessing the market levels that will come into play.
“If EUR/USD fails to reclaim the MA near 1.1050, the down move is likely to extend. Next potential supports could be located at 1.0900/1.0870, the 50% retracement from April and 1.0780,” says Purohit.
Investment bank EUR/USD consensus forecasts: The end-2024 and 2025 guide from Corpay has been released. Featuring the median, mean, high and low points forecasted by over 30 investment banks. Please request a copy here.
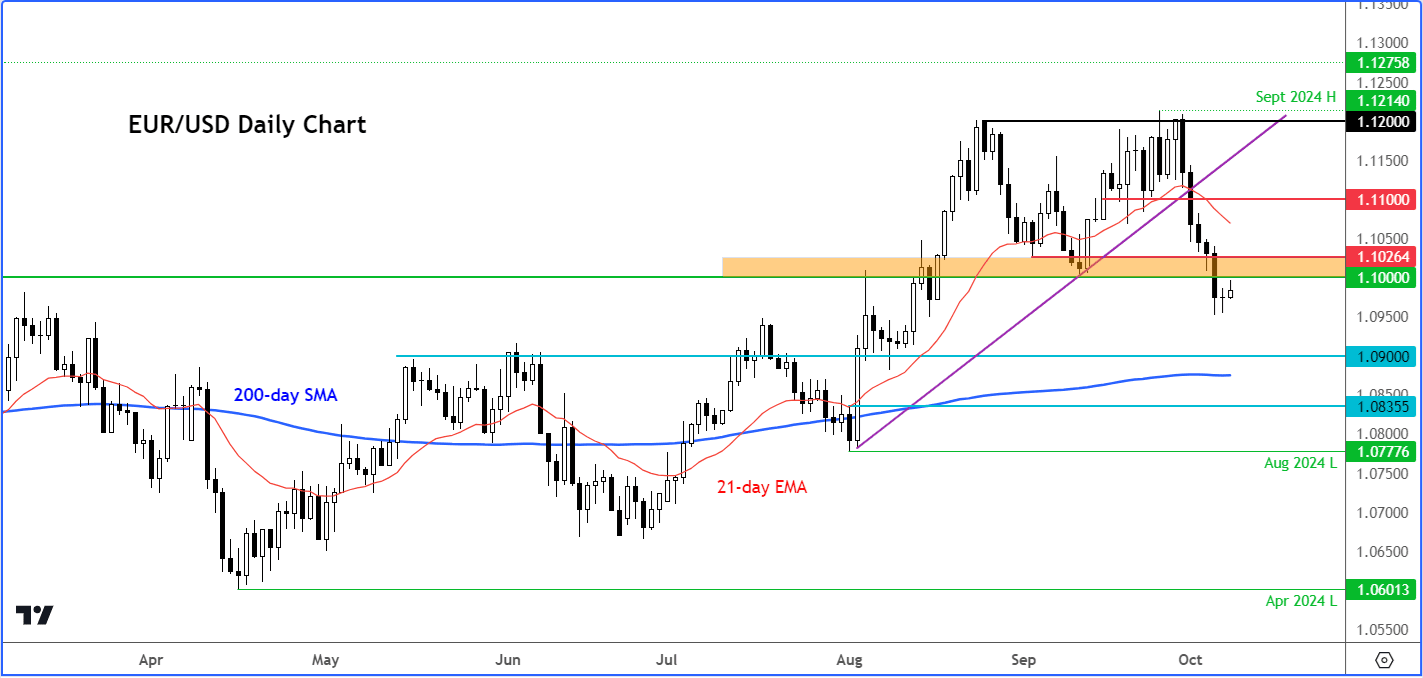
“The technical EUR/USD forecast has turned bearish,” says Fawad Razaqzada, FX analyst at City Index.
He explains that EUR/USD has now broken a support area between 1.1000 to 1.1025, meaning it has therefore created an interim lower low.
“Unless the exchange rate gets back above this area, the path of least resistance remains to the downside despite the small uptick in rates so far this week,” says Razaqzada.
The next key support level to watch is around 1.0900, followed by the 200-day average around 1.0875, he adds.
Spot Gold trades with a modest downward bias for the fifth consecutive day, hovering at around $2,645 a troy ounce after the United States (US) opening. The XAU/USD pair has been shedding some ground in the last few days, albeit still far from suggesting an interim top at the record high of $2,685.45 posted in September.
Despite the recent US Dollar upsurge, the bright metal continues to attract investors, as they face multiple different fronts. On the one hand, the USD benefits from solid US macroeconomic data and reduced bets for a Federal Reserve (Fed) massive interest rate cut. On the other hand, speculative interest weighs in mounting tensions in the Middle East. Finally, stocks turned north at the beginning of the week, with losses in the tech sector dragging all major indexes and maintaining afloat the safe-haven metal.
Data-wise, the calendar had offered little of relevance this week, with the focus on upcoming US data. The Federal Open Market Committee (FOMC) will unveil the Minutes of its September meeting on Wednesday. The document may miss the surprise factor after comments from Fed officials flooded the news post-meeting and following an outstanding Nonfarm Payrolls (NFP) report.
On Thursday, the country will release the September Consumer Price Index (CPI), which may gain relevance after solid employment-related data. Inflation in the US has retreated sharply after peaking at record highs in 2022 but remains above the Fed’s goal of around 2%. Nevertheless, officials have said they remain confident they will soon achieve such a goal. Should CPI figures come in higher than anticipated, investors may reduce bets for a November rate cut and, hence, provide the USD with an unexpected boost.
From a technical perspective, XAU/USD is in a consolidative phase, still developing above all its moving averages in the daily chart. Even further, the 20 Simple Moving Average (SMA) maintains a sharp upward slope far above the longer ones while providing dynamic support at around $2,620. At the same time, the Momentum indicator is flat well above its 100 line, while the Relative Strength Index (RSI) indicator aims marginally lower at around 61, none of them enough to support a steeper decline.
Technical readings in the 4-hour chart offer a neutral-to-bearish stance. XAU/USD pressures its intraday lows, while a mildly bearish 20 SMA contains intraday advances. At the same time, a still bullish 100 SMA provides support. Finally, technical indicators turned south within negative levels, maintaining the downward slope. A steeper near-term decline could be expected on a break below $2,624.50, the immediate support area.
Support levels: 2,624.50 2,616.00 2,603.90
Resistance levels: 2,649.45 2,663.00 2,673.20
EUR/USD continues to edge higher toward 1.1000 after posting small gains on Monday. Relatively dovish comments from European Central Bank (ECB) officials and the sour market mood, however, could cap the pair’s upside in the near term.
The table below shows the percentage change of Euro (EUR) against listed major currencies this week. Euro was the strongest against the Australian Dollar.
| USD | EUR | GBP | JPY | CAD | AUD | NZD | CHF | |
|---|---|---|---|---|---|---|---|---|
| USD | -0.18% | 0.15% | -0.75% | 0.51% | 0.90% | 0.52% | -0.55% | |
| EUR | 0.18% | 0.40% | -0.54% | 0.73% | 1.07% | 0.70% | -0.39% | |
| GBP | -0.15% | -0.40% | -0.97% | 0.31% | 0.67% | 0.34% | -0.66% | |
| JPY | 0.75% | 0.54% | 0.97% | 1.26% | 1.64% | 1.22% | 0.24% | |
| CAD | -0.51% | -0.73% | -0.31% | -1.26% | 0.41% | 0.00% | -1.05% | |
| AUD | -0.90% | -1.07% | -0.67% | -1.64% | -0.41% | -0.32% | -1.40% | |
| NZD | -0.52% | -0.70% | -0.34% | -1.22% | -0.01% | 0.32% | -1.03% | |
| CHF | 0.55% | 0.39% | 0.66% | -0.24% | 1.05% | 1.40% | 1.03% |
The heat map shows percentage changes of major currencies against each other. The base currency is picked from the left column, while the quote currency is picked from the top row. For example, if you pick the Euro from the left column and move along the horizontal line to the US Dollar, the percentage change displayed in the box will represent EUR (base)/USD (quote).
The US Dollar (USD) struggled to build on the previous week’s gains on Monday and allowed EUR/USD to hold its ground. Nevertheless, the risk-averse market atmosphere, as reflected by sharp declines seen in Wall Street’s main indexes, made it difficult for the pair to push higher.
In an interview with the Slovenian daily, Delo, on Tuesday, Frank Elderson, Vice-Chair of the Supervisory Board at the ECB, warned of economic growth risks materializing, adding that he is open-minded about the next policy action ahead of the October meeting. Meanwhile, ECB policymaker Martins Kazaks argued that inflation is not fully defeated but said that data point to an interest rate cut next week.
The US economic calendar will not offer any high-impact data releases in the second half of the day. Hence, investors are likely to pay close attention to the risk perception. In the European session, US stock index futures trade virtually unchanged. In case the safe-haven flows dominate the market action in the American session, EUR/USD could struggle to extend its rebound.
The Relative Strength Index (RSI) indicator on the 4-hour chart recovered above 40 early Tuesday, pointing to a weakening in bearish pressure. Looking north, immediate resistance could be spotted at 1.1000 (round level, Fibonacci 50% retracement of the latest uptrend) before 1.1040 (Fibonacci 38.2% retracement) and 1.1100 (Fibonacci 23.6% retracement).
On the downside, supports align at 1.0950 (Fibonacci 61.8% retracement), 1.0900 (round level) and 1.0870 (Fibonacci 78.6% retracement).
The Euro is the currency for the 19 European Union countries that belong to the Eurozone. It is the second most heavily traded currency in the world behind the US Dollar. In 2022, it accounted for 31% of all foreign exchange transactions, with an average daily turnover of over $2.2 trillion a day. EUR/USD is the most heavily traded currency pair in the world, accounting for an estimated 30% off all transactions, followed by EUR/JPY (4%), EUR/GBP (3%) and EUR/AUD (2%).
The European Central Bank (ECB) in Frankfurt, Germany, is the reserve bank for the Eurozone. The ECB sets interest rates and manages monetary policy. The ECB’s primary mandate is to maintain price stability, which means either controlling inflation or stimulating growth. Its primary tool is the raising or lowering of interest rates. Relatively high interest rates – or the expectation of higher rates – will usually benefit the Euro and vice versa. The ECB Governing Council makes monetary policy decisions at meetings held eight times a year. Decisions are made by heads of the Eurozone national banks and six permanent members, including the President of the ECB, Christine Lagarde.
Eurozone inflation data, measured by the Harmonized Index of Consumer Prices (HICP), is an important econometric for the Euro. If inflation rises more than expected, especially if above the ECB’s 2% target, it obliges the ECB to raise interest rates to bring it back under control. Relatively high interest rates compared to its counterparts will usually benefit the Euro, as it makes the region more attractive as a place for global investors to park their money.
Data releases gauge the health of the economy and can impact on the Euro. Indicators such as GDP, Manufacturing and Services PMIs, employment, and consumer sentiment surveys can all influence the direction of the single currency. A strong economy is good for the Euro. Not only does it attract more foreign investment but it may encourage the ECB to put up interest rates, which will directly strengthen the Euro. Otherwise, if economic data is weak, the Euro is likely to fall. Economic data for the four largest economies in the euro area (Germany, France, Italy and Spain) are especially significant, as they account for 75% of the Eurozone’s economy.
Another significant data release for the Euro is the Trade Balance. This indicator measures the difference between what a country earns from its exports and what it spends on imports over a given period. If a country produces highly sought after exports then its currency will gain in value purely from the extra demand created from foreign buyers seeking to purchase these goods. Therefore, a positive net Trade Balance strengthens a currency and vice versa for a negative balance.
After closing in negative territory on Monday, GBP/USD staged a modest recovery early Tuesday but lost its traction after meeting resistance near 1.3100. The pair’s technical outlook suggests that sellers look to retain control in the near term.
The table below shows the percentage change of British Pound (GBP) against listed major currencies last 7 days. British Pound was the weakest against the US Dollar.
| USD | EUR | GBP | JPY | CAD | AUD | NZD | CHF | |
|---|---|---|---|---|---|---|---|---|
| USD | 1.29% | 2.11% | 2.90% | 0.85% | 2.73% | 3.68% | 1.04% | |
| EUR | -1.29% | 0.80% | 1.58% | -0.43% | 1.42% | 2.35% | -0.27% | |
| GBP | -2.11% | -0.80% | 0.77% | -1.23% | 0.60% | 1.55% | -1.05% | |
| JPY | -2.90% | -1.58% | -0.77% | -1.97% | -0.14% | 0.77% | -1.79% | |
| CAD | -0.85% | 0.43% | 1.23% | 1.97% | 1.86% | 2.80% | 0.19% | |
| AUD | -2.73% | -1.42% | -0.60% | 0.14% | -1.86% | 0.92% | -1.67% | |
| NZD | -3.68% | -2.35% | -1.55% | -0.77% | -2.80% | -0.92% | -2.54% | |
| CHF | -1.04% | 0.27% | 1.05% | 1.79% | -0.19% | 1.67% | 2.54% |
The heat map shows percentage changes of major currencies against each other. The base currency is picked from the left column, while the quote currency is picked from the top row. For example, if you pick the British Pound from the left column and move along the horizontal line to the US Dollar, the percentage change displayed in the box will represent GBP (base)/USD (quote).
The negative shift seen in risk mood at the start of the week caused GBP/USD to edge lower. Early Tuesday, investors adopt a cautious stance amid growing concerns over an economic downturn in China.
The National Development and Reform Commission (NDRC), China’s state planner, said on Tuesday that the downward pressure on China’s economy is increasing, adding that they are facing more complex internal and external environments.
Reflecting the souring mood, the UK’s FTSE 100 Index is down more than 1% on the day. Meanwhile, US stock index futures trade virtually unchanged.
In case the market atmosphere remains risk-averse in the second half of the day, GBP/USD could come under renewed bearish pressure. NFIB Business Optimism Index for September and RealClearMarkets/TIPP Economic Optimism Index data for October will be featured in the US economic docket on Tuesday, which are unlikely to trigger a noticeable market reaction.
The Relative Strength Index (RSI) indicator on the 4-hour chart stays below 40, suggesting that sellers look to retain control. Interim support seems to have formed at 1.3070 before 1.3050 (static level) and 1.3000 (round level, static level).
If GBP/USD manages to rise above 1.3100 (Fibonacci 78.6% retracement level of the latest uptrend) and starts using this level as support, sellers could be discouraged. In this scenario, next resistance could be spotted at 1.3170 (Fibonacci 61.8% retracement).
The Pound Sterling (GBP) is the oldest currency in the world (886 AD) and the official currency of the United Kingdom. It is the fourth most traded unit for foreign exchange (FX) in the world, accounting for 12% of all transactions, averaging $630 billion a day, according to 2022 data. Its key trading pairs are GBP/USD, also known as ‘Cable’, which accounts for 11% of FX, GBP/JPY, or the ‘Dragon’ as it is known by traders (3%), and EUR/GBP (2%). The Pound Sterling is issued by the Bank of England (BoE).
The single most important factor influencing the value of the Pound Sterling is monetary policy decided by the Bank of England. The BoE bases its decisions on whether it has achieved its primary goal of “price stability” – a steady inflation rate of around 2%. Its primary tool for achieving this is the adjustment of interest rates. When inflation is too high, the BoE will try to rein it in by raising interest rates, making it more expensive for people and businesses to access credit. This is generally positive for GBP, as higher interest rates make the UK a more attractive place for global investors to park their money. When inflation falls too low it is a sign economic growth is slowing. In this scenario, the BoE will consider lowering interest rates to cheapen credit so businesses will borrow more to invest in growth-generating projects.
Data releases gauge the health of the economy and can impact the value of the Pound Sterling. Indicators such as GDP, Manufacturing and Services PMIs, and employment can all influence the direction of the GBP. A strong economy is good for Sterling. Not only does it attract more foreign investment but it may encourage the BoE to put up interest rates, which will directly strengthen GBP. Otherwise, if economic data is weak, the Pound Sterling is likely to fall.
Another significant data release for the Pound Sterling is the Trade Balance. This indicator measures the difference between what a country earns from its exports and what it spends on imports over a given period. If a country produces highly sought-after exports, its currency will benefit purely from the extra demand created from foreign buyers seeking to purchase these goods. Therefore, a positive net Trade Balance strengthens a currency and vice versa for a negative balance.