The main category of Forex News.
You can use the search box below to find what you need.
[wd_asp id=1]
The main category of Forex News.
You can use the search box below to find what you need.
[wd_asp id=1]
The GBP/USD forecast shows a solid downtrend after Friday’s upbeat US jobs report boosted the dollar. Meanwhile, the pound remained fragile after mixed rate cut signals from Bank of England policymakers.
–Are you interested to learn more about day trading brokers? Check our detailed guide-
Demand for the dollar increased last week due to geopolitical tensions and better-than-expected US economic data. Notably, the conflict in the Middle East escalated last week after Iran attacked Israel, leading to fears of retaliation.
Meanwhile, in the US, data last week showed a resilient labor market and strong business activity in the services sector. The major event was the nonfarm payrolls, which beat estimates. The US economy added 254,000 jobs, well above estimates of 140,000.
At the same time, the unemployment rate eased from 4.2% to 4.1%. Economists had expected it to hold steady at 4.2%. The US Central Bank has kept a close eye on the labor market and cut rates by 50-bps to keep it from deteriorating. Moreover, market participants were pricing another significant rate cut in November.
However, this outlook changed on Friday, with markets now pricing a 95% chance of a 25-bps cut. The prospects of a gradual Fed easing cycle will support the dollar in the near term.
Meanwhile, the pound collapsed last week after BoE governor Bailey said the central bank might cut rates aggressively if inflation eases. On the other hand, BoE chief economist Huw Pill advocated for gradual rate cuts.
Investors do not expect any key economic reports today. Therefore, the pair might extend Friday’s moves.
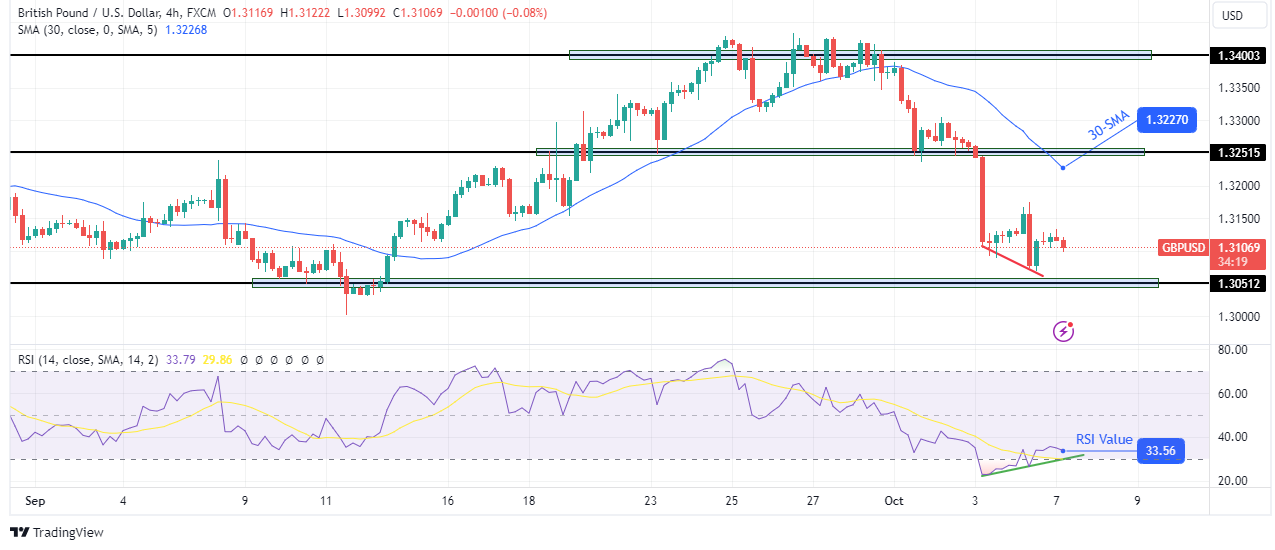
On the technical side, the GBP/USD price is approaching the 1.3051 support level after a sharp bearish move. The previous bullish trend paused near the 1.3400 resistance level. Here, bears took charge by breaking below the 30-SMA. The new bearish move was strong and impulsive, breaking below solid support levels.
-Are you looking for the best AI Trading Brokers? Check our detailed guide-
However, after the sharp decline, the RSI has made a bullish divergence with the price. This is a sign that bears are exhausted. Therefore, the price might rebound to retest the 30-SMA or the 1.3251 resistance level. Nevertheless, since the bearish bias remains strong, the price might eventually breach the 1.3051 support.
Looking to trade forex now? Invest at eToro!
67% of retail investor accounts lose money when trading CFDs with this provider. You should consider whether you can afford to take the high risk of losing your money.
On the downside, support is at $1.30688, with further levels at $1.30374 and $1.30023. The 50-day EMA at $1.31450 currently acts as a cap on gains.
A break above $1.31330 would shift the outlook to bullish, while staying below could signal continued pressure on the pair.
For now, the trend remains neutral, but a decisive move above $1.31330 would be key for any further gains.
The Euro (EUR) weakened after German Factory Orders plunged 5.8% in September, significantly below the expected -1.9%, reflecting a slowdown in industrial demand. Sentix Investor Confidence also improved slightly to -13.8 but remains in negative territory.
Markets are now eyeing Eurozone Retail Sales data and comments from German Buba President Nagel to gauge the outlook for the Euro amidst ongoing economic concerns.
The EUR/USD is trading at $1.09697, sitting just below the $1.09714 pivot point on the hourly chart. Immediate resistance is at $1.09841, followed by $1.09938 and $1.10039.
A break above these levels could indicate further bullish momentum, especially if the price holds above the 50-day EMA at $1.10017.
GBP/USD registered large losses in the previous week despite holding its ground on Friday. The pair struggles to gain traction at the beginning of the new week and trades below 1.3100.
The table below shows the percentage change of British Pound (GBP) against listed major currencies last 7 days. British Pound was the weakest against the US Dollar.
| USD | EUR | GBP | JPY | CAD | AUD | NZD | CHF | |
|---|---|---|---|---|---|---|---|---|
| USD | 1.83% | 2.31% | 4.29% | 0.62% | 1.74% | 3.19% | 1.98% | |
| EUR | -1.83% | 0.48% | 2.41% | -1.15% | -0.02% | 1.37% | 0.24% | |
| GBP | -2.31% | -0.48% | 2.04% | -1.63% | -0.50% | 0.88% | -0.24% | |
| JPY | -4.29% | -2.41% | -2.04% | -3.45% | -2.50% | -1.02% | -2.14% | |
| CAD | -0.62% | 1.15% | 1.63% | 3.45% | 1.16% | 2.55% | 1.41% | |
| AUD | -1.74% | 0.02% | 0.50% | 2.50% | -1.16% | 1.39% | 0.26% | |
| NZD | -3.19% | -1.37% | -0.88% | 1.02% | -2.55% | -1.39% | -1.14% | |
| CHF | -1.98% | -0.24% | 0.24% | 2.14% | -1.41% | -0.26% | 1.14% |
The heat map shows percentage changes of major currencies against each other. The base currency is picked from the left column, while the quote currency is picked from the top row. For example, if you pick the British Pound from the left column and move along the horizontal line to the US Dollar, the percentage change displayed in the box will represent GBP (base)/USD (quote).
GBP/USD declined sharply on Thursday, pressured by dovish comments from Bank of England (BoE) Governor Andrew Bailey. Although the pair staged a rebound in the European session on Friday after BoE Chief Economist Huw Pill adopted a more cautious tone regarding further policy easing, it failed to stretch higher as the upbeat US employment data boosted the US Dollar (USD).
Nonfarm Payrolls in the US increased by 254,000 in September, surpassing the market estimate of 140,000 by a wide margin, the US Bureau of Labor Statistics reported on Friday. Furthermore, the Unemployment Rate edged lower to 4.1% from 4.2% in the same period, while the Labor Force Participation stood unchanged at 62.7%.
In the absence of high-impact macroeconomic data releases, the negative shift seen in risk mood, as reflected by falling US stock index futures, helps the USD stay resilient against its peers and doesn’t allow the pair to start retracing the previous week’s slide.
Investors will pay close attention to comments from Federal Reserve (Fed) policymakers in the second half of the day. Currently, the CME FedWatch Tool shows that markets are nearly fully pricing in a 25 basis points (bps) rate cut at the November policy meeting. Hence, the USD could have a hard time gathering further strength even if Fed officials note that another large rate cut won’t be needed.
The Relative Strength Index (RSI) indicator on the 4-hour chart stays slightly below 30 after holding above that level on Friday, suggesting that buyers refrain from committing to an extended technical correction.
On the downside, 1.3050 (static level) aligns as immediate support before 1.3000 (round level, static level) and 1.2940 (static level). In case GBP/USD rises above 1.3100 (Fibonacci 78.6% retracement level of the latest uptrend) and starts using this level as support, 1.3170 (Fibonacci 61.8% retracement) and 1.3200 (200-period Simple Moving Average) could be seen as next resistance levels.
The Pound Sterling (GBP) is the oldest currency in the world (886 AD) and the official currency of the United Kingdom. It is the fourth most traded unit for foreign exchange (FX) in the world, accounting for 12% of all transactions, averaging $630 billion a day, according to 2022 data. Its key trading pairs are GBP/USD, also known as ‘Cable’, which accounts for 11% of FX, GBP/JPY, or the ‘Dragon’ as it is known by traders (3%), and EUR/GBP (2%). The Pound Sterling is issued by the Bank of England (BoE).
The single most important factor influencing the value of the Pound Sterling is monetary policy decided by the Bank of England. The BoE bases its decisions on whether it has achieved its primary goal of “price stability” – a steady inflation rate of around 2%. Its primary tool for achieving this is the adjustment of interest rates. When inflation is too high, the BoE will try to rein it in by raising interest rates, making it more expensive for people and businesses to access credit. This is generally positive for GBP, as higher interest rates make the UK a more attractive place for global investors to park their money. When inflation falls too low it is a sign economic growth is slowing. In this scenario, the BoE will consider lowering interest rates to cheapen credit so businesses will borrow more to invest in growth-generating projects.
Data releases gauge the health of the economy and can impact the value of the Pound Sterling. Indicators such as GDP, Manufacturing and Services PMIs, and employment can all influence the direction of the GBP. A strong economy is good for Sterling. Not only does it attract more foreign investment but it may encourage the BoE to put up interest rates, which will directly strengthen GBP. Otherwise, if economic data is weak, the Pound Sterling is likely to fall.
Another significant data release for the Pound Sterling is the Trade Balance. This indicator measures the difference between what a country earns from its exports and what it spends on imports over a given period. If a country produces highly sought-after exports, its currency will benefit purely from the extra demand created from foreign buyers seeking to purchase these goods. Therefore, a positive net Trade Balance strengthens a currency and vice versa for a negative balance.
Access proprietary mining insights, investment research, and third-party news sources from Dow Jones Newswires, and Nikkei News. Our comprehensive, real-time global mining news integrates financial and industry-specific data in our articles so you can easily turn information into actionable insights. Our mining news is accessible on web and mobile platforms, news feeds, and email alerts. Our topics range from operations and strategy, mergers and acquisitions, capital markets, ESG, and project developments in the mining industry.
So technically speaking, we are in the midst of potentially changing trends. At this point, the 200-day EMA sits right around the 1.09 level, and if we break down below there, we could see a move down to the 1.08 level. Short-term rallies could be faced with a bit of a headache in the form of 1.10. And then the 50-day EMA indicator underneath there.

Breaking above all of that could open up a move back to the 1.12 level, but keep in mind this is a pair that is trying to sort out what’s going to happen with the two central banks as the Europeans seem very balanced at the moment, perhaps even likely to keep interest rates lower due to the fact that interest rates have dropped just a bit below the 2% target.
On the other hand, the Federal Reserve is seeing a robust jobs situation. If that’s going to be the case, we may have to keep interest rates higher in America. And that would drive this pair down. Either way, to me, it looks like we’re going back and forth between big handles. I think that continues to be the case, but clearly the sellers have made their presence known this week as the dollar continues to attract attention in general, due to not only the strength of the United States economy, but also the concerns about all of the geopolitical issues around the world.
Ready to trade our daily EUR/USD Forex analysis? We’ve made a list of the best forex demo accounts worth trading with.
Platinum price seasonality has outspoken cycles and dynamics. These 5 platinum seasonality charts learn that March/April as well as December are consistently strong months. Will 2024 show a year-end really consistent with previous years? There is one concern in 2024…
RELATED – A Platinum Price Prediction For 2025
By analyzing historical data and recent performance, one can identify key months for potential gains and periods where caution is warranted.
In this article, we analyze the seasonality of platinum prices using several charts that cover different time frames, from the long-term 50-year trends to the recent years.
Additionally, we compare platinum’s seasonality with silver to provide a broader context for precious metals investors.
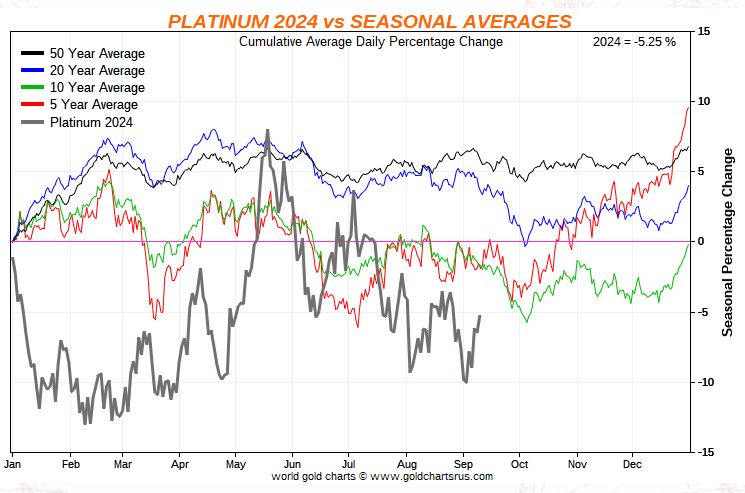
The 50-year platinum price seasonality chart provides an extensive historical perspective, highlighting average price trends throughout the year.
Revealed insights: The long-term seasonality suggests two main periods for potential gains—early in the year (January to March) and later in the year (July to September). The mid-year period often indicates caution or consolidation.
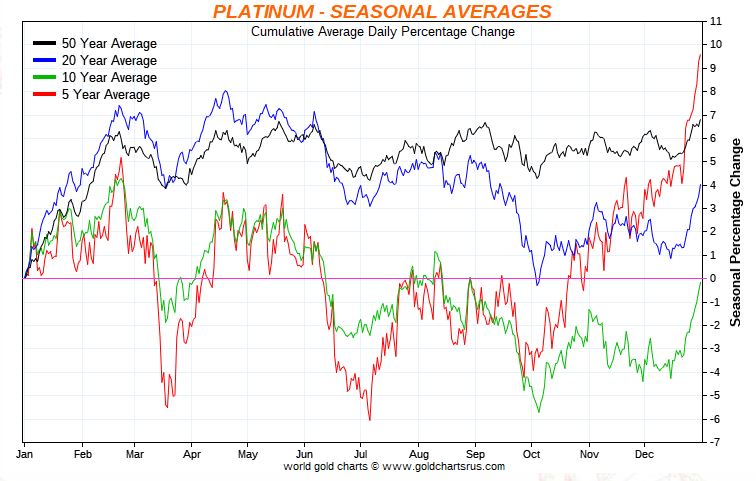
This chart compares the 50-year average seasonality with the specific performance of platinum in 2024.
Revealed Insights: The sharp divergence early in 2024 highlights potential market-specific factors affecting platinum prices, diverging from historical trends. This requires investors to be cautious about relying solely on seasonality for early 2025 predictions.
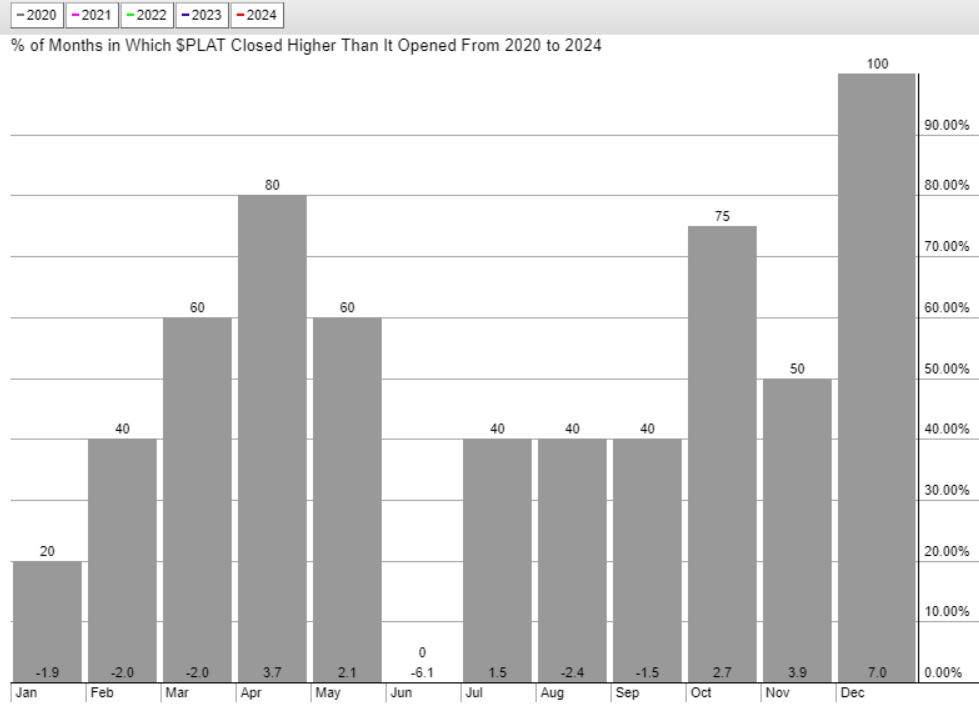
This chart illustrates platinum’s monthly performance from 2020 to 2024, showing the percentage of months when platinum closed higher than it opened.
Revealed insights: The recent 4-year period confirms strong performance in March/April and December. These months could present reliable opportunities for gains, aligning partially with the long-term trends and highlighting their importance for traders.
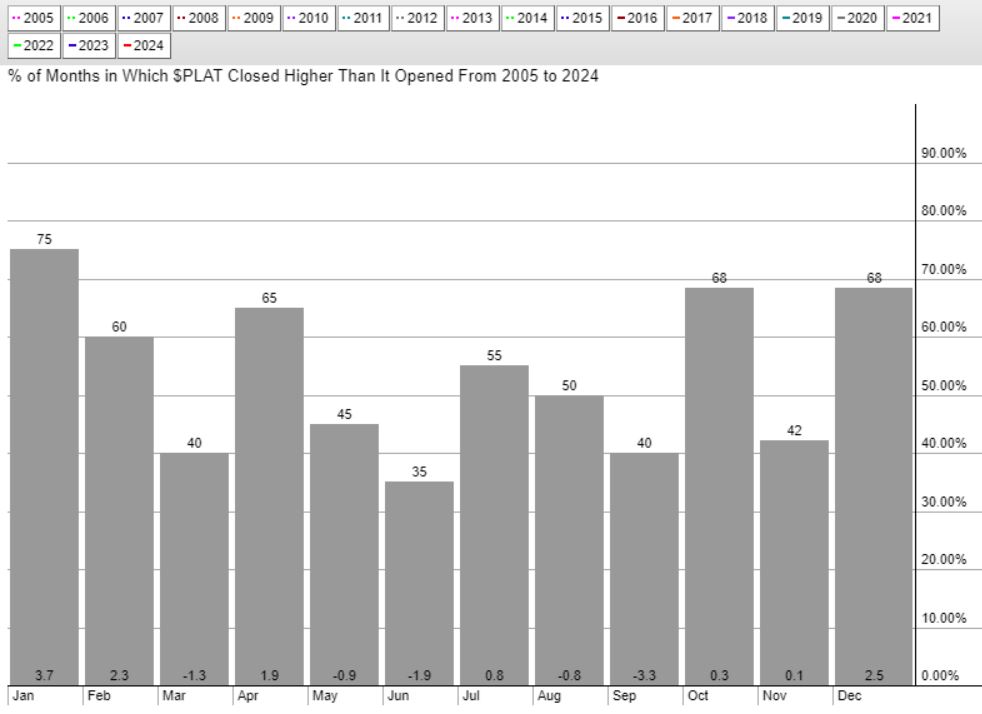
Covering the 19-year period from 2005 to 2024, this chart provides a longer-term perspective on platinum’s seasonality.
Revealed Insights: The extended period from 2005 to 2024 aligns with some of the 50-year trends but shows more variability. This underlines the importance of focusing on strong months (January, April, October, December) for potential gains while being cautious during mid-year months.
In this section, we compare the insights we derived from our silver price seasonality with the ones in this article related to platinum price seasonality.
Early and late-year strength: Both platinum and silver show strong seasonality early (January to March for platinum, January to February for silver) and late in the year (September to December). These similarities suggest both metals may be influenced by common seasonal demand factors.
Mid-year weakness: Both metals exhibit weakness mid-year (June to July for platinum, June for silver), indicating a consistent seasonal pattern.
Divergence in recent years: Platinum’s early-year weakness in 2024 contrasts with silver, which did not show a sharp divergence. This could imply that platinum is currently more sensitive to specific market conditions or economic factors compared to silver.
There are 3 conclusions that we take away from the platinum seasonality charts:
By understanding these seasonality conclusions, platinum investors can better handle the platinum market.
Gold price is in the red at the start of a new week on Monday but stays within a familiar range at around $2,650. Amidst the persistent Middle East geopolitical escalation, Gold price now shifts its attention to speeches from US Federal Reserve (Fed) policymakers on Monday, anticipating the critical US Consumer Price Index (CPI) data later in the week.
Gold price fails to benefit from a US Dollar (USD) pullback from seven-week highs against its major rivals. Risk flows remain in vogue on expectations of more stimulus coming through from China, as traders return after a week-long holiday break. The extended risk appetite into Asia weighs on the safe-haven assets such as the Gold price, the US Dollar, US government bonds etc.
Softer US Treasury bond yields also add to the weight on the Greenback, unable to motivate Gold buyers, as the People’s Bank of China (PBOC), the Chinese central bank, reported no Gold reserves purchases for the fifth straight month in September on Monday. China is the world’s top Gold consumer.
The main catalyst behind the softer undertone in Gold price so far this month is the fading expectations of a 50 basis points (bps) interest rate cut by the Fed next month. This less dovish turn in sentiment surrounding the Fed was accentuated after Friday’s blockbuster Nonfarm Payrolls data, which totally ruled out an outsized Fed rate cut probability for November.
Data published by the US Bureau of Labor Statistics (BLS) on Friday showed that Nonfarm Payrolls rose by 254,000 in September after gaining 159,000 (revised from 142,000) in August. The reading outpaced the market expectation of 140,000 by a wide margin. The annual wage inflation, as measured by the change in Average Hourly Earnings, edged a tad higher to 4% from 3.9% in August.
Markets are currently pricing in about a 94% chance that the Fed will opt for a 25 bps rate cut at its next meeting, the CME Group’s FedWatch Tool shows, with a 6% probability of a no rate change decision.
However, Gold price has managed to keep its corrective downside restricted, thanks to the persistent geopolitical risks emanating from the escalating conflict between Israel and Iran. On Sunday evening, the Israel Defense Forces (IDF) said it struck multiple Hezbollah targets in Beirut, including Hezbollah’s intelligence headquarters. In retaliation, Hezbollah said it also launched a barrage of rockets at northern Israel Sunday night.
Mounting fears of the Israel-Iran conflict turning into a wider regional war in the Middle East remain a cause for concern for global markets. Gold traders, therefore, look forward to upcoming Fedspeak for further trading impetus in the lead-up to the main event risk for this week – the US consumer inflation data for September.
Despite the sluggish Gold price action recently, buyers refuse to give up as long as the static support of $2,630 holds the fort.
The 14-day Relative Strength Index (RSI) also stays well above the midline, currently near 64, backing the bullish potential.
Gold price, however, needs a daily candlestick closing above the strong resistance near $2,670 to revive the uptrend.
The next resistance is aligned at the record high of $2,686. Further up, buyers will target the $2,700 round level.
On the flip side, acceptance below the intermittent low near $2,630 is critical to unleashing further downside toward the $2,600 threshold.
Ahead of that level, the 21-day Simple Moving Average (SMA) at $2,609 will test bullish commitments.
Gold has played a key role in human’s history as it has been widely used as a store of value and medium of exchange. Currently, apart from its shine and usage for jewelry, the precious metal is widely seen as a safe-haven asset, meaning that it is considered a good investment during turbulent times. Gold is also widely seen as a hedge against inflation and against depreciating currencies as it doesn’t rely on any specific issuer or government.
Central banks are the biggest Gold holders. In their aim to support their currencies in turbulent times, central banks tend to diversify their reserves and buy Gold to improve the perceived strength of the economy and the currency. High Gold reserves can be a source of trust for a country’s solvency. Central banks added 1,136 tonnes of Gold worth around $70 billion to their reserves in 2022, according to data from the World Gold Council. This is the highest yearly purchase since records began. Central banks from emerging economies such as China, India and Turkey are quickly increasing their Gold reserves.
Gold has an inverse correlation with the US Dollar and US Treasuries, which are both major reserve and safe-haven assets. When the Dollar depreciates, Gold tends to rise, enabling investors and central banks to diversify their assets in turbulent times. Gold is also inversely correlated with risk assets. A rally in the stock market tends to weaken Gold price, while sell-offs in riskier markets tend to favor the precious metal.
The price can move due to a wide range of factors. Geopolitical instability or fears of a deep recession can quickly make Gold price escalate due to its safe-haven status. As a yield-less asset, Gold tends to rise with lower interest rates, while higher cost of money usually weighs down on the yellow metal. Still, most moves depend on how the US Dollar (USD) behaves as the asset is priced in dollars (XAU/USD). A strong Dollar tends to keep the price of Gold controlled, whereas a weaker Dollar is likely to push Gold prices up.
Gold (XAU/USD) struggled to make a decisive move in either direction this week as the broad-based US Dollar (USD) strength offset the increasing safe-haven demand for the precious metal. Developments surrounding the conflict in the Middle East and US inflation data could drive XAU/USD’s action next week.
Gold started the new week under bearish pressure and lost nearly 1% on Monday. While speaking at the National Association for Business Economics Annual Meeting, Federal Reserve (Fed) Chairman Jerome Powell refrained from providing any fresh hints regarding the next policy step. Powell reiterated that risks are two-sided and that they will take policy decisions on a meeting-by-meeting basis. “The Fed is not in a hurry to cut rates quickly, will be guided by data,” he added. These comments allowed the USD to hold its ground and forced XAU/USD to stay on the back foot.
Although the USD preserved its strength on Tuesday after the US Bureau of Labor Statistics (BLS) reported that the JOLTS Job Openings rose to 8.04 million in August from 7.71 million in July, Gold benefited from escalating geopolitical tensions and gained over 1% to erase all of Monday’s losses. Reports of the Israeli army mounting a ground invasion of Lebanon revived fears over a deepening and widening conflict in the Middle East.
Early Wednesday, news of Iran firing about 200 ballistic missiles on Israel and Israel vowing to retaliate against the attack helped Gold find demand. Israel’s Prime Minister Benjamin Netanyahu said that Iran had made a “big mistake” and “will pay,” further escalating tensions. As the USD recovery picked up steam in the second half of the day, however, XAU/USD struggled to gather bullish momentum and closed the day little changed. The Automatic Data Processing (ADP) reported that employment in the private sector rose by 143,000 in September, surpassing the market expectation of 120,000 and supporting the USD.
The data published by the Institute for Supply Management (ISM) showed on Thursday that the business activity in the service sector continued to expand at an accelerating pace in September, with the ISM Services Purchasing Managers Index (PMI) improving to 54.9 from 51.5 in August. The USD capitalized on this report and made it difficult for Gold to rebound.
On Friday, the BLS announced that Nonfarm Payrolls (NFP) rose by 254,000 in September, surpassing the market expectation of 140,000 by a wide margin. Additionally, August’s NFP growth of 142,000 was revised higher to 159,000. Other details of the employment report showed that the Unemployment Rate edged lower to 4.1%, while the annual wage inflation, as measured by the change in the Average Hourly Earnings, ticked up to 4% from 3.9% in August. Gold failed to stage a rebound after upbeat US labor market data.
The US economic calendar will not offer any high-tier macroeconomic data releases in the first half of next week. On Wednesday, The Fed will release the minutes of the September policy meeting.
Investors will scrutinize the discussions surrounding the decision to lower the policy rate by 50 basis points (bps). In case the publication reveals that policymakers preferred a large reduction in the interest rate as a first step to a gradual policy-easing, rather than as a response to growing signs of cooling conditions in the labor market, the immediate reaction could boost the USD. The CME Group FedWatch Tool shows that markets are still pricing in a more than 30% probability that the Fed will opt for one more 50 bps cut at the next policy meeting in November, suggesting that the USD has more room on the upside if investors lean toward a 25 bps cut.
On the flip side, the USD could come under pressure and allow Gold to turn north if the minutes reflect that policymakers will keep an open mind about additional big rate cuts in case data points to an economic downturn or a worsening labor market outlook.
On Thursday, the BLS will release the Consumer Price Index (CPI) data for September. The monthly core CPI reading, which excludes prices of volatile items and is not distorted by base effect, could trigger a reaction in Gold. Markets expect the core CPI to rise 0.2% in September, following the 0.3% increase recorded in August. A reading of 0.2%, or smaller, could weigh on the USD. While an increase of 0.5% or more could cause investors to doubt the disinflation process and lift the USD, causing XAU/USD to turn south.
Market participants will also pay close attention to headlines coming out of the Middle East. If the crisis deepens with Israel retaliating against Iran and Iran not taking a step back, Gold could continue to take advantage of the safe-haven demand.
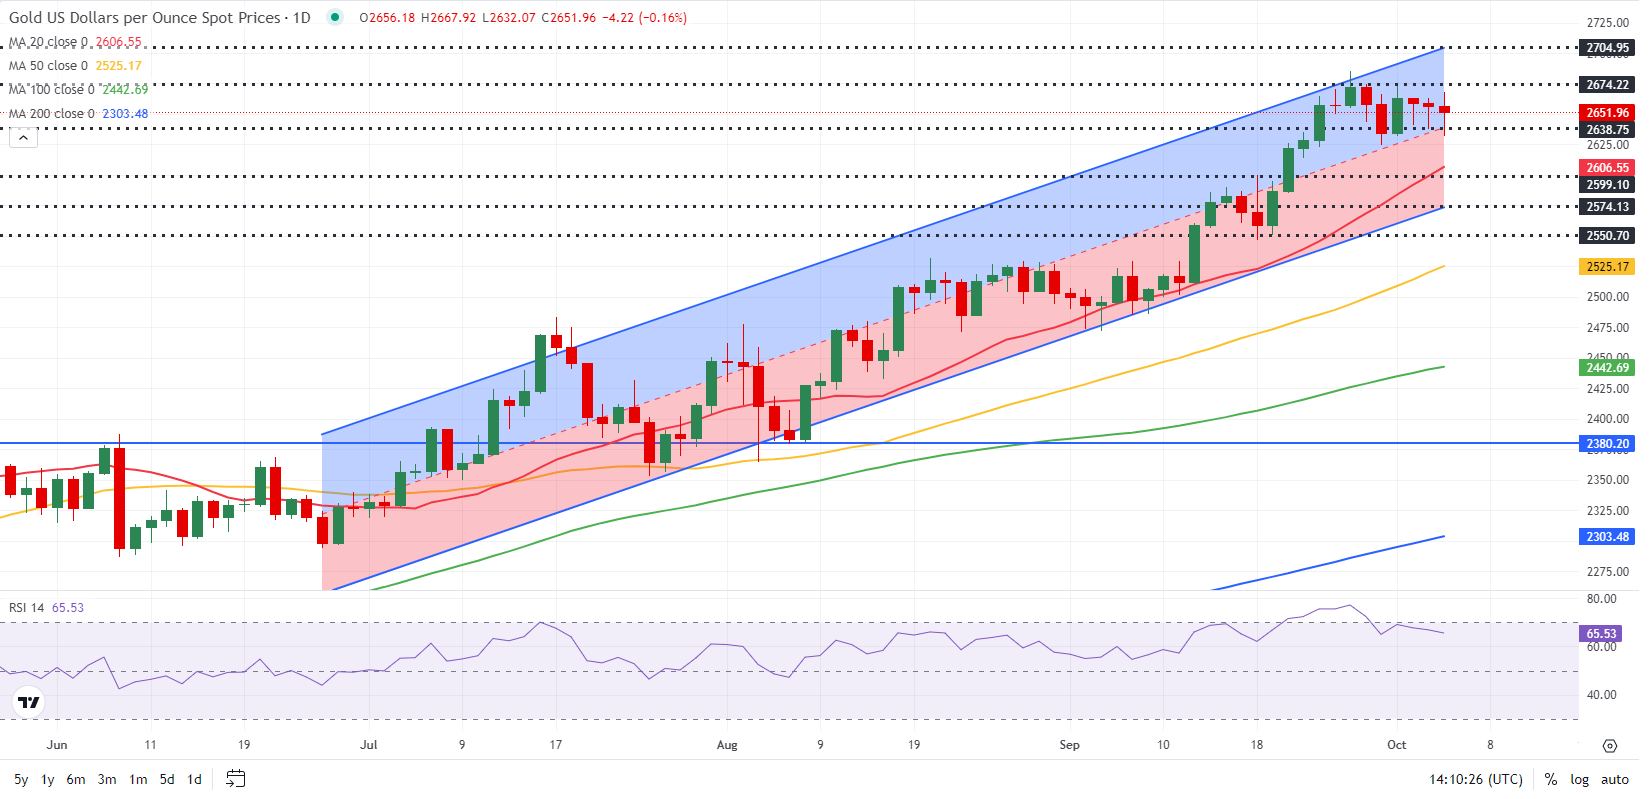
The Relative Strength Index (RSI) indicator on the daily chart retreated slightly below 70, reflecting sellers’ reluctance to bet on an extended decline. On the downside, the mid-point of the ascending regression channel coming from late June forms first support at $2,640. In case this level fails, the next support could be seen at $2,605-$2,600 (20-day Simple Moving Average (SMA), static level) before $2,575 (lower limit of the ascending channel).
Looking north, interim resistance seems to have formed at $2,675 (static level) ahead of $2,700-$2,705 (round level, upper limit of the ascending channel).
Gold has played a key role in human’s history as it has been widely used as a store of value and medium of exchange. Currently, apart from its shine and usage for jewelry, the precious metal is widely seen as a safe-haven asset, meaning that it is considered a good investment during turbulent times. Gold is also widely seen as a hedge against inflation and against depreciating currencies as it doesn’t rely on any specific issuer or government.
Central banks are the biggest Gold holders. In their aim to support their currencies in turbulent times, central banks tend to diversify their reserves and buy Gold to improve the perceived strength of the economy and the currency. High Gold reserves can be a source of trust for a country’s solvency. Central banks added 1,136 tonnes of Gold worth around $70 billion to their reserves in 2022, according to data from the World Gold Council. This is the highest yearly purchase since records began. Central banks from emerging economies such as China, India and Turkey are quickly increasing their Gold reserves.
Gold has an inverse correlation with the US Dollar and US Treasuries, which are both major reserve and safe-haven assets. When the Dollar depreciates, Gold tends to rise, enabling investors and central banks to diversify their assets in turbulent times. Gold is also inversely correlated with risk assets. A rally in the stock market tends to weaken Gold price, while sell-offs in riskier markets tend to favor the precious metal.
The price can move due to a wide range of factors. Geopolitical instability or fears of a deep recession can quickly make Gold price escalate due to its safe-haven status. As a yield-less asset, Gold tends to rise with lower interest rates, while higher cost of money usually weighs down on the yellow metal. Still, most moves depend on how the US Dollar (USD) behaves as the asset is priced in dollars (XAU/USD). A strong Dollar tends to keep the price of Gold controlled, whereas a weaker Dollar is likely to push Gold prices up.
Tighter labor market conditions crashed investor expectations of a 50-basis point November Fed rate cut. FOMC Members’ support for a 50-basis point November rate cut could send the USD/JPY toward 147.5. Conversely, if members call for a delay to Fed rate cuts, the USD/JPY could approach 150.
A delay in Fed rate cuts may lower expectations of a narrowing in the interest rate differential between the US and Japan.
USD/JPY trends will likely hinge on crucial economic indicators from Japan, including household spending (Tues) and wage growth trends (Tues). Upward trends in wages and household spending could fuel demand-driven inflation, boosting bets on a Q4 2024 BoJ rate hike.
However, FOMC member commentary and Thursday’s US CPI Report will likely influence the Fed rate path. A softer-than-expected US inflation rate may retrigger bets on aggressive Fed rate cuts. Conversely, a hotter-than-expected CPI print could reduce bets on multiple 2024 Fed rate cuts, possibly pushing the USD/JPY through 150.
Traders should stay vigilant as monetary policy chatter and Japan’s economic data could affect trading USD/JPY strategies. Monitor real-time data, central bank views, and expert commentary to adjust your trading strategies accordingly. Stay ahead of the market with our expert insights.
The USD/JPY holds above the 50-day EMA while remaining below the 200-day EMA, confirming bullish near-term but bearish longer-term price trends.
A USD/JPY break above the 200-day EMA would support a return to 150. Furthermore, a breakout from 150 could give the bulls a run at the trend line and the 151.685 resistance level.
Japan’s LEI Index trends and monetary policy commentary require consideration.
Conversely, a break below the 148.529 support level could bring the 50-day EMA and the 145.891 support level into play.
The 14-day RSI at 65.41 suggests a USD/JPY climb to the 200-day EMA before entering overbought territory.
The US dollar tested critical resistance on Friday, but can dollar bulls force a reclaim next week, or will the USD weaken once more?
Find out in today’s forecast video and see how I’m trading the DXY, EURUSD, GBPUSD, USDJPY, and AUDUSD next week.
The DXY is testing the 102.60 resistance level today, an area and target I’ve discussed for weeks.
It’s the bottom of the 2023 channel that the DXY lost on August 19th.
This is a pivotal area for the US dollar, making it a significant factor for the major currency pairs next week.
As long as the DXY is below 102.60 on the higher time frames, it’s resistance, so buying the USD is ill-advised.
However, a reclaim of this area next week would turn the US dollar bullish toward areas like 103.60 and 104.15.
Key support next week for the DXY is 101.80 to 102.00.
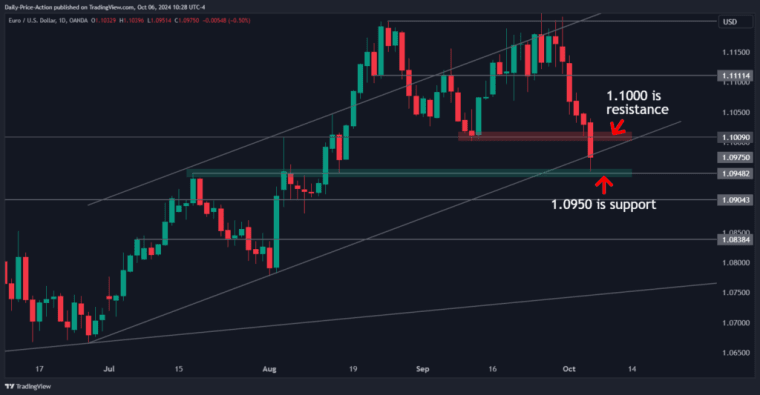
EURUSD is breaking down today following a dollar-positive non-farm payroll.
I’ve discussed the fakeout above the July channel resistance since August 29th.
Following a prolonged period of sideways action, we’re finally seeing the EURUSD follow through on that failed breakout.
As mentioned earlier in the week, the 1.1110 break opened up the 1.1000 range low.
If EURUSD closes below its 2024 trend line at 1.0985, that area will flip to resistance next week, exposing 1.0950 and 1.0900.
Alternatively, a close above 1.0985 would keep the level intact as support next week with resistance at 1.1000.
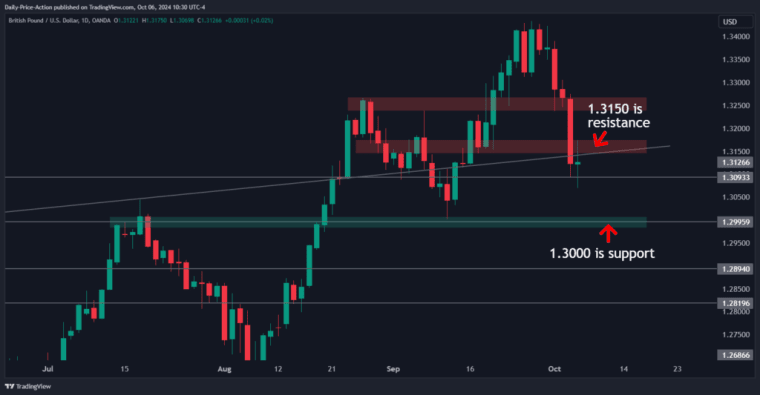
GBPUSD played out nicely last week following a breakdown from the rising wedge I discussed in last weekend’s forecast.
That trade idea was good for over 200 pips.
As mentioned on Thursday, a GBPUSD weekly close below the 1.3140 area will make things incredibly difficult for bulls next week.
That would confirm a fakeout above the December 2023 channel top, exposing levels like 1.3000 and 1.2890.
On the other hand, a close above 1.3140 would keep the area intact as support with resistance at 1.3250 next week.
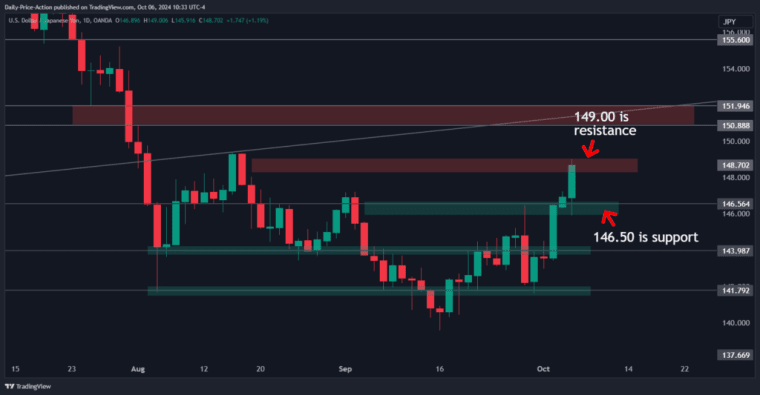
USDJPY has played out nicely for us since the September 25th close above 144.00.
That break targeted the 146.00 imbalance, which we saw on the 27th.
Last weekend, I discussed how USDJPY could range between 141.80 and 144.00 early this week, which we also got.
Going into next week, I would expect the 146.50 area to attract buyers if tested.
However, USDJPY bulls need to remember that the pair remains below its February 2022 trend line at 151.00-152.00.
That will be a critical resistance for USDJPY next week.
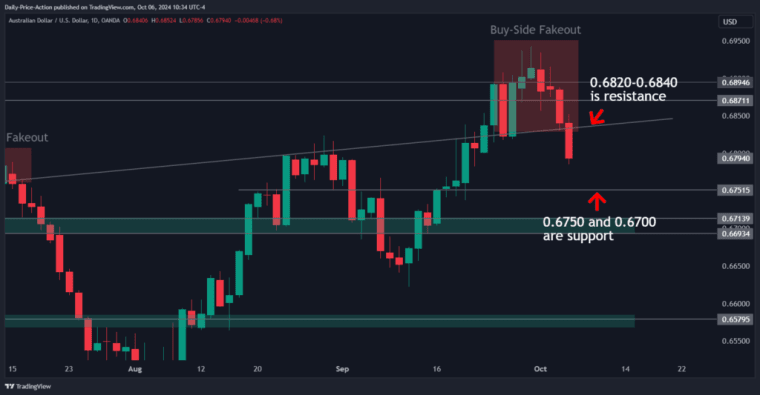
AUDUSD lost a critical level on Friday at 0.6835.
That’s the January trend line, a level that gave us a short setup back in July on the failed breakout above it.
The Australian dollar also lost the December 2023 high last week following the late September close above.
So, we have two failed breakouts for AUDUSD that could send the pair lower next week.
However, remember that the DXY must clear 102.60 for the US dollar to turn constructive again.
Until that time, I think longing the USD is risky.