The main category of Forex News.
You can use the search box below to find what you need.
[wd_asp id=1]
The main category of Forex News.
You can use the search box below to find what you need.
[wd_asp id=1]
This week, the appetite of policymakers at the Federal Reserve to cut US interest rates may become clearer as the bank’s Governor Jerome Powell addresses economists and the government releases new employment figures. The Fed Chairman will discuss the US economic outlook at the National Association for Business Economics conference on Monday. At the end of the week, the US jobs report for September is expected to show a healthy and moderate labor market.
According to the results of the economic calendar, Payrolls in the world’s largest economy are expected to rise by 146,000, based on the median estimate in a Bloomberg survey of economists. That’s similar to the increase in August and would leave the three-month average of job growth near its weakest since mid-2019. The unemployment rate is likely to remain at 4.2%, while average hourly earnings are expected to rise 3.8% from a year earlier.
Meanwhile, the recent labor unrest suggests Friday’s jobs report could be the last clean reading on the U.S. labor market before the Federal Reserve meets in early November. Boeing Co. workers walked off the job in mid-September, and dock workers on the Atlantic and Gulf coasts are threatening to strike starting Oct. 1. In addition to the heavyweight monthly payrolls report, Tuesday’s job openings data is expected to show that job openings in August remained near their lowest level since the start of 2021. Also, economists will be looking at the rate of resignations and layoffs to gauge the extent of the slowdown in demand for labor.
In this regard, Deutsche Bank says the EUR/USD exchange rate will undergo a “soft landing” in the United States. According to a new research note from Deutsche Bank’s currency analysis team, this means the euro exchange rate will return below $1.10. “The US has succeeded in securing a perfect soft landing – that is the dominant theme in our foreign exchange chart. There are many trade implications from this,” explains George Saravelos, a forex expert at Deutsche Bank.

The “perfect soft landing” is a scenario in which the Federal Reserve succeeds in reducing inflation by raising interest rates but does not exhaust the economy’s energy and cause a recession. The analyst believes the Fed will likely continue to cut rates, but not as much as has been priced in and the dollar will remain high yielding. The dollar has been on a downward trajectory recently as markets have priced in the start of a rate-cutting cycle, which began in September with a massive 50 basis point rate cut. But “so the dollar is not about to enter a new bear market, and we like to see the recent dollar sell-off fade across the EUR/USD,” the analyst said. Then there’s Germany. “In Europe, the German economy is going through a negative competitive shock and the euro has historically been unable to rally when the German economy is very weak,” the analyst said.
The German economy appears to be in recession, according to survey data for September, and analysts say that will put pressure on the European Central Bank to cut rates again before too long. Among this group is the Deutsche Bank economics research team, which believes the European Central Bank could cut interest rates by 50 basis points before the end of the year.
Also, the team believes the ECB could step up the pace of cuts in 2025 from quarterly to consecutive.
In the near term, the US election will become a more important issue for forex markets. According to the analyst, “The US election looms as the big event on the horizon. This has a lot of potential to shake the market out of its current order, and the outcome will play a major role in adjusting our views going into 2025.
Ready to start trading the EUR/USD daily analysis? Get our top rated Forex brokers list here.
Gold price is down for a second consecutive day, trading at around $2,635 in the mid-American session. The bright metal eased despite a mixed market mood. Generally speaking, financial markets are optimistic amid easing interest rates among major economies. Investors also welcomed Chinese stimulus measures announced last week aimed at reviving the battered economy.
Nevertheless, stock markets are struggling at the beginning of the new week. Most Asian indexes closed in the green, although Japanese ones edged lower following news that former Defense Chief Shigeru Ishiba won the Liberal Democratic Party’s (LDP) presidential election. The upcoming Prime Minister is expected to favor interest rate hikes by the Bank of Japan (BoJ), hurting stocks demand.
Meanwhile, European indexes edged lower amid tepid news from the automakers´ sector, as big names paint a gloomy earnings picture ahead. As a result, United States (US) indexes trade with losses, supporting US Dollar’s advance against most major rivals.
In the upcoming days, however, the focus will move away from stocks and centre around US employment data. The country will publish the JOLTS Job Opening report and the ADP National Employment Report on private job creation ahead of the Nonfarm Payrolls (NFP) release on Friday. The labor market situation in the US may become less of a concern after the Federal Reserve (Fed) delivered a 50 basis points (bps) rate cut when it met in September.
Finally, it’s worth remembering that China celebrates the Golden Week starting on Tuesday, October 1, which means local markets will remain closed for the rest of the week, limiting price action after Wall Street closes.
From a technical point of view, the daily chart for the XAU/USD pair shows the recent decline could be categorised as corrective, yet with scope to keep declining in the next few days. Technical indicators have abandoned overbought territory and head firmly south, although well into positive territory. At the same time, moving averages maintain their firm bullish slopes far below the current level, limiting the mid-term bearish potential of Gold. The 20 Simple Moving Average (SMA) currently stands at around $2,575, and an approach to it should attract buyers.
In the near term, and according to the 4-hour chart, the risk also skews to the downside. XAU/USD has broken below a now mildly bearish 20 SMA while holding above bullish 100 and 200 SMAs. Technical indicators, in the meantime, have fallen well into negative territory, maintaining uneven bearish strength. The daily low at $2,628.66 offers immediate support.
Support levels: 2,628.60 2,611.90 2,598.70
Resistance levels: 2,653.70 2,665.95 2,685.45
Image © Adobe Images
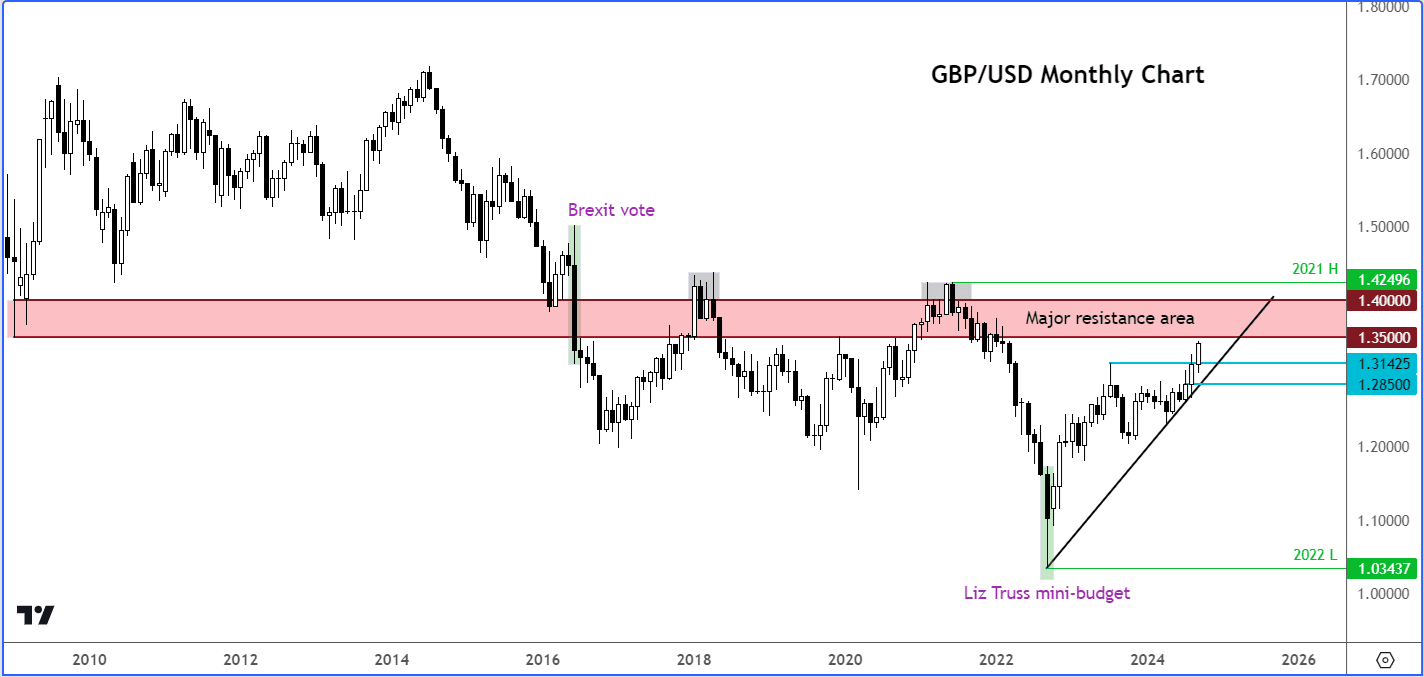
Year-to-date, the GBP/USD is up about 5.3%. While the potential to extend these gains is there, the cable is now less than 70 pips away from testing a key long-term resistance zone between 1.3500 and 1.4000.
Since the 2016 Brexit vote, this range has acted as a ceiling, repeatedly rejecting the pair’s attempts to break higher, even if we have had a couple of temporary breaks above this zone.
As rates approach the key 1.35-1.40 long-term resistance range, the upside could be limited moving forward.
The GBP/USD has been steady in the last few trading sessions, holding onto the decent gains it has made in Q3.
Unless we see a surprise 2% drop today, the cable is on track to close higher for the third consecutive month.
A slew of important US data—including the monthly jobs report—is on the horizon this week, and the cable’s near-term direction hinges on these economic releases.
While the broader US dollar trend remains bearish, the GBP/USD outlook is not so certain.
With much of the dollar weakness already factored in, a pullback in the cable could be on the horizon as we approach this week’s US employment data.
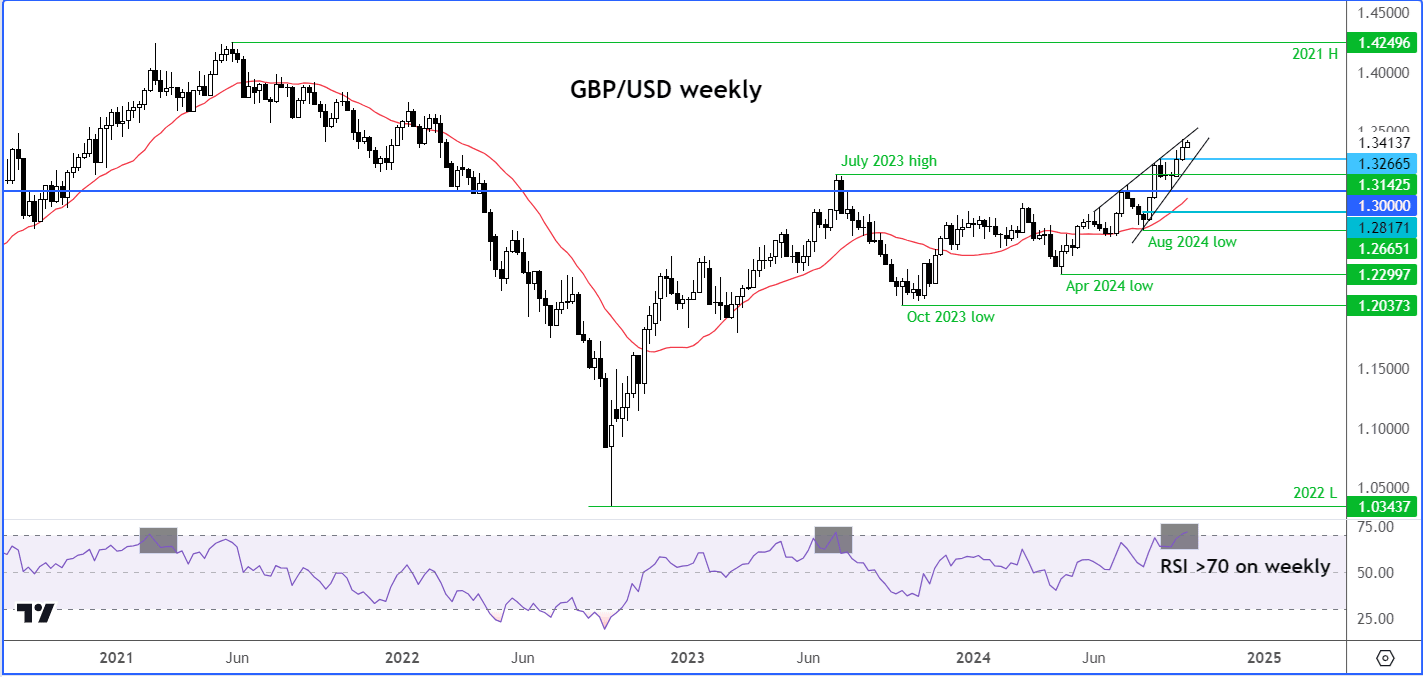
The weekly chart (see above) shows that price is approaching overbought levels. Momentum indicators like the Relative Strength Index (RSI) suggest caution as it climbs above the 70.0 threshold.
The last couple of times that the weekly RSI has climbed above 70, we have seen significant drops in subsequent months.
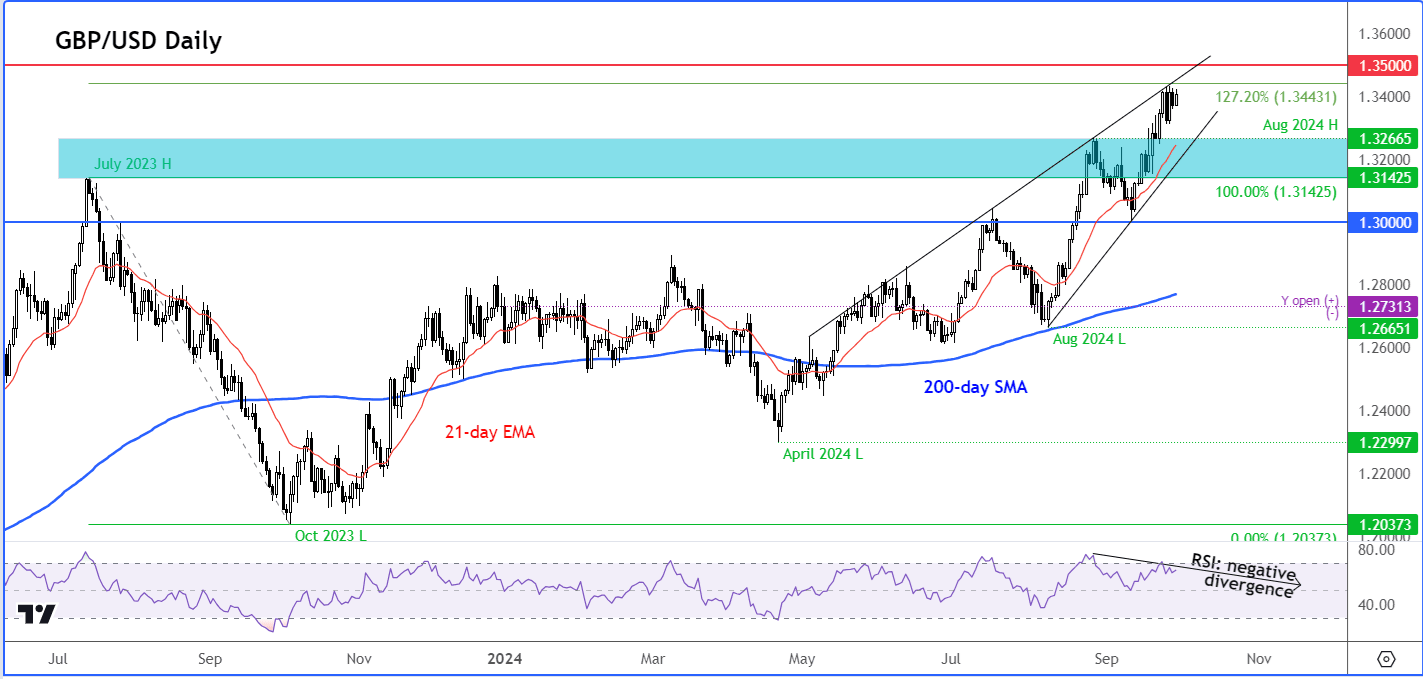
On the daily time frame, the RSI is in a state of negative divergence – i.e., it is forming a lower high relative to the underlying price making a higher high. This is considerable to be a sign of waning bullish momentum.
While the momentum indicators are signalling overbought conditions, what is missing so far is the bearish reversal signal on what matters the most: price. The GBP/USD has not yet created a bearish price pattern to encourage the bears to short it.
The series of higher highs and higher lows must end before the GBP/USD outlook turns bearish. Therefore, the overbought conditions, at this stage, should be viewed as a warning for the bulls that we could see some profit-taking or some short-term weakness. The bears will need to remain patient until a clear reversal signal emerges.
Key short-term support comes in around 1.3265, a level that had marked the high in August.
Below this level, 1.3200 is the next support to watch followed by the Jul 2023 high of 1.3142 – once resistance, this level may now offer support on a pullback.
But given those RSI overbought conditions on higher time frames, it is possible we could see a deeper drop than these levels before the GBP/USD becomes attractive again.
According to licensed trading platforms, the end of the quarter and month is approaching, which will require global portfolio managers to adjust recent developments in the foreign exchange market. The rebalancing could lead to significant volatility in the near term. Brad Bechtel, an analyst at Jefferies said, “We’re approaching the end of the quarter this week and that’s likely to start driving the FX market more strongly tomorrow morning in London and New York,”
The US dollar had declined against most of its G10 peers in September, but the bigger and more important story for end-of-month flows is the significant rally in global equity markets. Commenting on this, Robert Vollem, a market analyst at Reuters, says, “The turbulent third quarter for asset prices opens the door for significant rebalancing at the end of the quarter.” Bechtel believes that the end of September and the third quarter of 2024 could be characterized by US dollar strength given the weakness seen in recent weeks. He stated, “I would be surprised if we ended up selling enough dollars at the end of the quarter to push us below the 100 level on the US Dollar Index, and generally, quarter-ends have been positive for the US dollar, so we’re likely to return to above 101 towards 102.”
The recovery in the US Dollar Index (DXY) – a measure of the overall performance of the US dollar – means that the USD/JPY pair may extend its current six-day appreciation trend. Looking ahead to October, the yen’s recovery against the US dollar is not necessarily over. Also, the analyst believes that a move in the USD/JPY below 141.75 would put its lowest level since the beginning of the year at 139.58 into consideration, while a close above 145.55 would target September’s high of 147.20.
The Japanese yen fell at the end of last week after the Bank of Japan appeared to waver in its commitment to further interest rate hikes and end its ultra-easy monetary policy. For its part, the Bank of Japan left its benchmark interest rate unchanged at 0.25%, and the guidance showed an upbeat outlook for the economy and a commitment to further rate hikes. However, “what is striking is the lack of explicit guidance in today’s statement. In July, it stated that the BOJ would continue to raise rates if inflation develops as expected. While the statement can still be read in this way, it is no longer explicit.” Added, “This confirms our view that the situation in Japan is not as clear-cut as the BOJ sometimes wants us to believe.”
The market reaction suggests that investors agree, believing that the BOJ may be softening its commitment to raising rates, which could deprive the yen of a major source of support. As a result, the Japanese currency fell against all of its G10 peers.
Despite the recent gains of the USD/JPY pair, the pair is still at the beginning of an upward trend-breaking phase. Moreover, this could succeed if it moves towards the resistance levels of 147.60 and 150.00, respectively. Conversely, and on the same timeframe, a move below the support level of 141.80 will be important for the continued strength of the bears’ control over the trend. The USD/JPY price today will be influenced by the announcement of a package of important US economic releases as well as statements by a number of US Federal Reserve policymakers, led by Governor Jerome Powell.
Ready to trade our daily USD/JPY forex forecast? Here are the best forex brokers in Japan to choose from.
After ending the previous week virtually unchanged, EUR/USD gains traction in the European session and rises toward 1.1200.
The table below shows the percentage change of Euro (EUR) against listed major currencies today. Euro was the strongest against the Swiss Franc.
| USD | EUR | GBP | JPY | CAD | AUD | NZD | CHF | |
|---|---|---|---|---|---|---|---|---|
| USD | -0.30% | -0.34% | 0.10% | 0.04% | -0.35% | -0.34% | 0.13% | |
| EUR | 0.30% | -0.03% | 0.40% | 0.36% | 0.00% | -0.01% | 0.51% | |
| GBP | 0.34% | 0.03% | 0.55% | 0.39% | 0.03% | 0.00% | 0.53% | |
| JPY | -0.10% | -0.40% | -0.55% | 0.00% | -0.50% | -0.40% | 0.10% | |
| CAD | -0.04% | -0.36% | -0.39% | -0.01% | -0.34% | -0.38% | 0.15% | |
| AUD | 0.35% | -0.01% | -0.03% | 0.50% | 0.34% | -0.02% | 0.52% | |
| NZD | 0.34% | 0.01% | -0.01% | 0.40% | 0.38% | 0.02% | 0.50% | |
| CHF | -0.13% | -0.51% | -0.53% | -0.10% | -0.15% | -0.52% | -0.50% |
The heat map shows percentage changes of major currencies against each other. The base currency is picked from the left column, while the quote currency is picked from the top row. For example, if you pick the Euro from the left column and move along the horizontal line to the US Dollar, the percentage change displayed in the box will represent EUR (base)/USD (quote).
The Euro seems to be gathering strength following the regional inflation data from Germany. In September, the Consumer Price Index (CPI) in Saxony rose 0.2% on a monthly basis after declining 0.2% in August, while the CPI in Bavaria increased 0.1% in the same period. Later in the session, Germany’s Destatis will publish the nationwide CPI data.
In the early American trading hours, European Central Bank (ECB) President Christine Lagarde will testify before the European Parliament. In case Lagarde leaves the door open to a rate cut at the next policy meeting, the immediate market reaction could cause the Euro to come under pressure. On the other hand, the currency could preserve its strength if Lagarde refrains from committing to further policy-easing at least until the last meeting of the year.
In the second half of the day, the US economic calendar will feature the Chicago Purchasing Managers’ Index and Dallas Fed Manufacturing Business Index data for September. Investors are likely to ignore these releases and stay focused on Federal Reserve (Fed) Chairman Jerome Powell’s speech later in the day.
Powell will speak on the economic outlook while participating in a moderated discussion titled “A View from the Federal Reserve Board” at the National Association for Business Economics Annual Meeting, in Nashville, starting at 17:00 GMT. The CME FedWatch Tool shows that markets are pricing in a nearly 50% probability of another 50 basis points rate cut at the next meeting in November. If Powell pushes back the market positioning by voicing their willingness to continue to ease the policy in a gradual way, the US Dollar (USD) could find a foothold and limit EUR/USD’s upside.
EUR/USD trades within a touching distance of 1.1200 (static level). In case the pair rises above this level and starts using it as support, it could continue to stretch higher. In this scenario, 1.1275 (July 18, 2023, high) could be seen as next resistance before 1.1300 (round level). In the meantime, the Relative Strength Index (RSI) recently rose above 60, pointing to a buildup of a bullish momentum and suggesting that the pair has more room on the upside before turning technically overbought.
On the downside, 1.1160 (50-period Simple Moving Average (SMA) on the 4-hour chart, static level) aligns as first support before 1.1110-1.1100 (100-period SMA, 200-period SMA).
The Euro is the currency for the 19 European Union countries that belong to the Eurozone. It is the second most heavily traded currency in the world behind the US Dollar. In 2022, it accounted for 31% of all foreign exchange transactions, with an average daily turnover of over $2.2 trillion a day. EUR/USD is the most heavily traded currency pair in the world, accounting for an estimated 30% off all transactions, followed by EUR/JPY (4%), EUR/GBP (3%) and EUR/AUD (2%).
The European Central Bank (ECB) in Frankfurt, Germany, is the reserve bank for the Eurozone. The ECB sets interest rates and manages monetary policy. The ECB’s primary mandate is to maintain price stability, which means either controlling inflation or stimulating growth. Its primary tool is the raising or lowering of interest rates. Relatively high interest rates – or the expectation of higher rates – will usually benefit the Euro and vice versa. The ECB Governing Council makes monetary policy decisions at meetings held eight times a year. Decisions are made by heads of the Eurozone national banks and six permanent members, including the President of the ECB, Christine Lagarde.
Eurozone inflation data, measured by the Harmonized Index of Consumer Prices (HICP), is an important econometric for the Euro. If inflation rises more than expected, especially if above the ECB’s 2% target, it obliges the ECB to raise interest rates to bring it back under control. Relatively high interest rates compared to its counterparts will usually benefit the Euro, as it makes the region more attractive as a place for global investors to park their money.
Data releases gauge the health of the economy and can impact on the Euro. Indicators such as GDP, Manufacturing and Services PMIs, employment, and consumer sentiment surveys can all influence the direction of the single currency. A strong economy is good for the Euro. Not only does it attract more foreign investment but it may encourage the ECB to put up interest rates, which will directly strengthen the Euro. Otherwise, if economic data is weak, the Euro is likely to fall. Economic data for the four largest economies in the euro area (Germany, France, Italy and Spain) are especially significant, as they account for 75% of the Eurozone’s economy.
Another significant data release for the Euro is the Trade Balance. This indicator measures the difference between what a country earns from its exports and what it spends on imports over a given period. If a country produces highly sought after exports then its currency will gain in value purely from the extra demand created from foreign buyers seeking to purchase these goods. Therefore, a positive net Trade Balance strengthens a currency and vice versa for a negative balance.
The Bank of England recently chose to sit Pat with its monetary policy, and therefore it does make a certain amount of sense that we have seen the British pound truly take off. Because of this, the market is likely to continue to see a lot of volatility, but I think given enough time we can open up the possibility of a move to the ¥197 level. The ¥197 level is an area where we have seen a significant amount of noise in the past, so I think that makes a reasonable target. Nonetheless, I think short-term pullbacks will continue to offer quite a bit of support, so a short-term pullback offers the possibility of a “buy on the dip” scenario.
The Bank of Japan has also decided not to raise rates again, so that means that the Japanese yen will probably continue to get sold off, and therefore I think we will eventually see the trading public in general continue to look at this as a market that you have to be a buyer of. I have no interest in shorting this market, at least not until we break significantly below the 50 Day EMA, and the 200 Day EMA indicators. Underneath there, we have the ¥190 level which I suspect is a major floor in this market overall. The market continues to see plenty of momentum, and therefore I think we continue to go higher.
Ready to trade our Forex daily forecast? We’ve shortlisted the best regulated forex brokers UK in the industry for you.
Image © Adobe Images
The Pound to Dollar exchange rate can continue to advance in the coming days according to our Week Ahead Model. Fedspeak and U.S. payrolls are the fundamental risks to the positive setup.
Pound Sterling has risen for three months in sucession against the Dollar and holds positive upside momentum that can extend in the coming days.
The Pound to Dollar exchange rate (GBP/USD) peaked at 1.3433 last week and has since pulled back to 1.3385, where we find it at the time of writing. It looks like the rally is consolidating around these levels ahead of a busy week.
This consolidation is needed, given the exchange rate had risen to overbought territory last week; the Relative Strength Index (RSI) broke above the 70 level, which signals overbought, requiring a pullback or consolidation to unwind.

The RSI has since fallen back to 63.69, confirming the pair is no longer overbought on the daily timeframe. Our suite of technical indicators are all flashing green and advocating for gains; for now, any weakness is viewed as likely being temporary.
The next graphical upside target is around 1.3510, representing a cluster of support and resistance going back to January 2022.
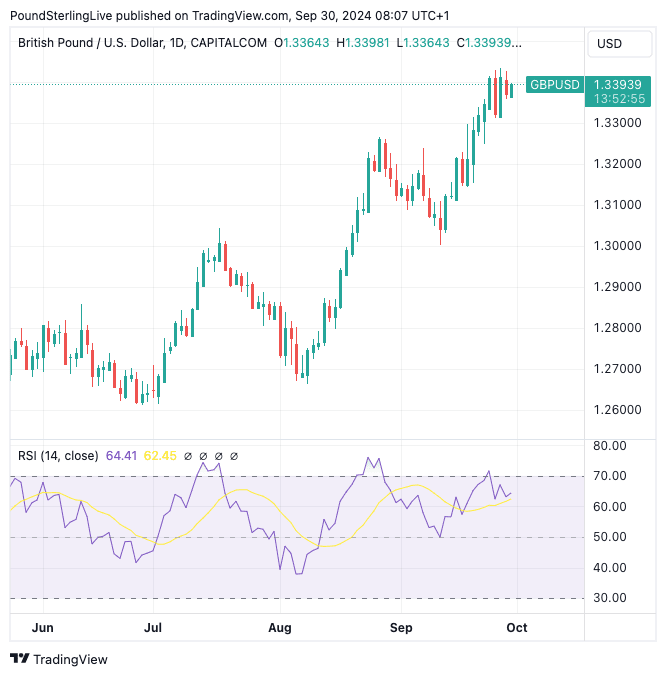
Above: GBP/USD at daily intervals.
“The broader pattern and tone of the charts remain GBP-bullish, amid steady GBP gains and strong, upward momentum on the short-, medium– and long-term oscillators,” says Shaun Osborne, an analyst at Scotiabank.
“GBP dips should remain relatively shallow,” he adds.

Turning to the event risk in the coming days, it is a quiet week in the UK, but the U.S. will offer important data and speeches from Federal Reserve interest rate setters.
The Pound tends to rise when stock markets are rising, which can continue as long as markets think the Federal Reserve will continue to cut interest rates.
Any strong data from the U.S. would, however, signal the pace of cuts will slow, which can deal a setback to the markets.
With this in mind, keep an eye on U.S. PMI survey data on Tuesday and speeches from Fed Open Market Committee (FOMC) members Cook, Collins, Barkin and Bostic. Bowman and Barkin speak on Wednesday.
There are more U.S. PMI figures incoming on Thursday (covering the services sector), which will keep markets entertained ahead of the week’s highlight, which is Friday’s non-farm payroll release.
Here, a headline of 144k is expected. The rule of thumb is that anything slightly below would signal the need for more cuts at the Fed and keep the mood music supportive of global risk and the Pound.
But any big downside miss could backfire as it would suggest maybe the economy is slipping into recession. If the figures give a significant upside, markets will almost certainly fall as investors race to bet the Federal Reserve will slow down the pace of cuts.
This would deal a setback to the Pound and trigger a Dollar recovery.
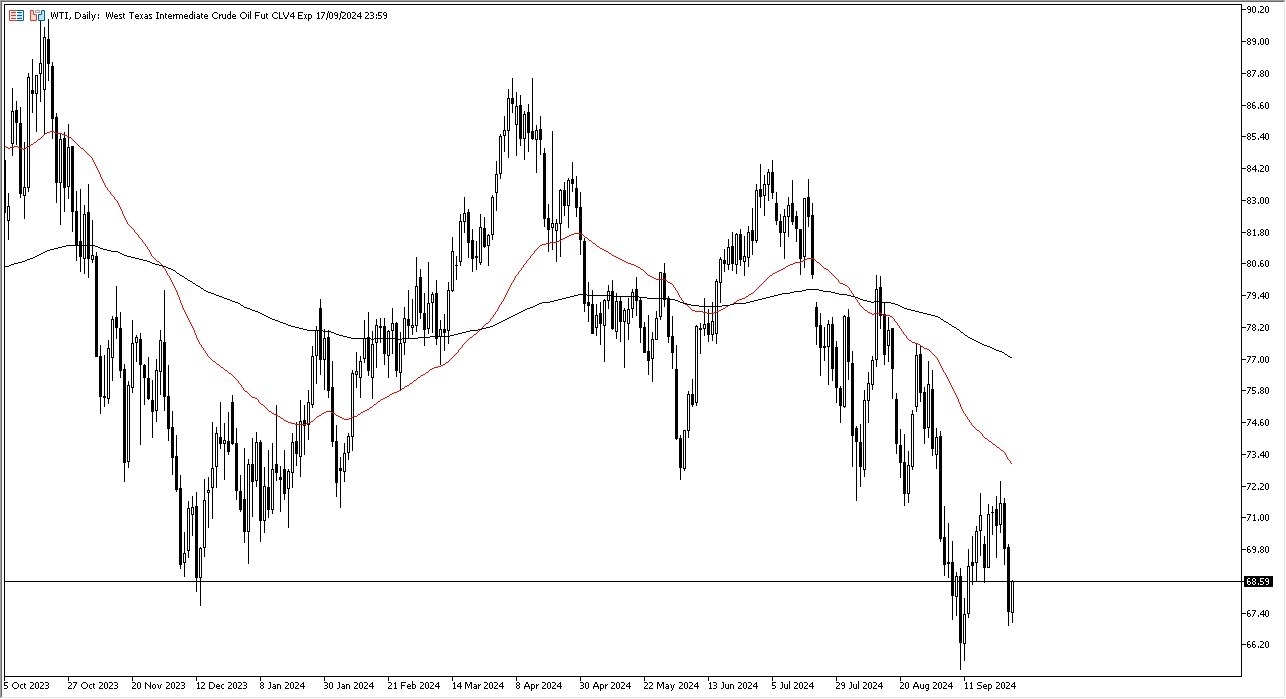
The technical analysis for the crude oil market is a bit of a mixed bag. Quite frankly, we are getting very close to a major support level for the last 2 years, and I think that is something worth paying attention to. However, if we do rally from here the $72.25 level should offer a significant amount of resistance, especially as we have just seen the market selloff from that level. Above there, we have the 50 Day EMA that comes into the picture and offers resistance also, so I think you’ve got a tuition where you could very well see a “fade the rally” type of market.
If we do break down from here, pay close attention to the $66 level. Anything below there could send the market reeling, as the $65 level would suddenly come into focus. After that level, then you have the bottom falling out and that suggests that we could end up having a very negative turn of events when it comes to risk appetite and demand. With that being the case, I think you’ve got a scenario where market participants continue to look at this as a situation where the volatility remains somewhat elevated, but at the end of the day, I don’t think there’s a whole lot here to the downside left, just simply because we are at such extraordinarily low levels for the last couple of years. If we can break above the 50 Day EMA, then I think this market becomes bullish all of the sudden.
Ready to trade Forex daily analysis and predictions? Here are the best Oil trading brokers to choose from.
Gold price is holding the previous corrective downside near $2,650 in Asian trades on Monday, shrugging off another Chinese stimulus-driven upbeat market sentiment. Traders refrain from placing fresh directional bets on Gold price ahead of US Federal Reserve (Fed) Jerome Powell’s speech due later on Monday.
During his last Thursday’s opening remarks at the US Treasury Market Conference, Fed Chair Powell did not speak about the economic and monetary policy outlook. Therefore, traders keenly await Powell’s appearance for fresh hints on the size of the potential interest rate cut in November.
Markets are currently pricing in a 52% chance of a 50 basis points (bps) rate reduction in November, the CME Group’s FedWatch Tool shows, slightly up from a 50% probability seen a week ago. Friday’s core Personal Consumption Expenditures (PCE) Price Index, the Fed’s preferred inflation measure, did little to alter the market’s expectations for the next Fed rate cut.
The headline PCE price index rose 0.1% for the month, putting the annual inflation rate at 2.2%. The core PCE Price Index increased by 2.7% YoY, as expected while the monthly core inflation ticked down to 0.1%, against the previous reading of 0.2%. The annual core PCE moved closer to the central bank’s 2% target in August, exacerbating the US Dollar’s (USD) pain.
However, Gold price failed to take advantage of the USD weakness and corrected from record highs of $2,686 reached last Thursday, as investors resorted to profit-taking heading into the US Nonfarm Payrolls week. Further, the month-end and quarter-end flows came into play, weighing negatively on Gold price.
In Monday’s trading so far, Gold price remains in the red, despite the renewed Middle East geopolitical escalation and additional Chinese stimulus measures.
Over the weekend, Israel continued to strike Lebanon and claimed to have killed another senior Hezbollah figure after the killing of leader Hassan Nasrallah. Iran, which backs the powerful militant group, vowed to strike back, noting that Nasrallah’s killing “will not go unanswered.”
Meanwhile, China announced more stimulus measures, with the nation’s central bank calling on the banks to lower mortgage rates for existing home loans by the end of October, likely by 50 bps on average.
The latest Chinese stimulus-driven optimism was partly dented by disappointing China’s business PMI data for September. China’s official Manufacturing PMI came in at 49.8, slightly better than the 49.5 forecast. However, the country’s Caixin Manufacturing PMI returned to contraction, arriving at 49.3 in the same period vs. August’s 50.4.
Gold price has eased from extremely overbought territory, with the 14-day Relative Strength Index (RSI) currently looks to enter the bullish zone near 71.
If buyers jump back on the bids, the previous high at $2,674 will be the initial content point, above which the record high of $2,686 will be tested.
A strong foothold above the all-time high is needed to take on the $2,700 barrier, followed by the rising trendline resistance at $2,710.
On the flip side, if the correction picks up pace, Gold price will likely test the September 24 low of $2,623, below which the $2,600 threshold will come into play.
Further south, Gold sellers could target the September 20 low of $2,585.
Jerome H. Powell took office as a member of the Board of Governors of the Federal Reserve System on May 25, 2012, to fill an unexpired term. On November 2, 2017, President Donald Trump nominated Powell to serve as the next Chairman of the Federal Reserve. Powell assumed office as Chair on February 5, 2018.
Next release: Mon Sep 30, 2024 17:00
Frequency: Irregular
Consensus: –
Previous: –
Source: Federal Reserve
Throughout the week, economic data releases further supported the case for continued rate cuts. The Personal Consumption Expenditures (PCE) price index—a critical measure of inflation—rose 0.1% month-over-month in August and 2.2% year-over-year, slightly below economists’ expectations of 2.3%. The core PCE index, which excludes food and energy, also rose by 0.1% for the month and 2.7% year-over-year, in line with forecasts. These inflation readings reinforced the outlook that the Fed could cut rates again by the end of the year, as inflation remains close to the central bank’s 2% target.
Meanwhile, jobless claims fell more than expected, and durable goods orders remained flat, further indicating resilience in the U.S. economy despite the Fed’s aggressive rate cuts.
In addition to the Fed’s actions, ongoing geopolitical tensions, particularly in the Middle East, provided strong support for gold prices. Conflict between Israel and Hezbollah escalated last week, with Israeli airstrikes in Lebanon further heightening risk sentiment. Investors seeking refuge from potential global instability increased their exposure to gold, pushing demand higher. Analysts expect these geopolitical risks to persist, keeping gold’s safe-haven appeal intact.
Another key factor driving gold’s rally has been the return of inflows into gold-backed exchange-traded funds (ETFs)