The main category of Forex News.
You can use the search box below to find what you need.
[wd_asp id=1]
The main category of Forex News.
You can use the search box below to find what you need.
[wd_asp id=1]
Softer-than-expected retail sales figures may ease investor expectations of a Q4 2024 Bank of Japan rate cut. Downward trends in consumer spending may dampen inflationary pressures, enabling the BoJ to keep interest rates steady. A less hawkish BoJ could impact Japanese Yen demand, possibly pushing the USD/JPY toward 143.
Notably, softer retail sales would follow Tokyo’s core inflation rate, which declined from 2.4% in August to 2.0% in September.
Japan’s preliminary industrial production figures may also draw interest. Economists forecast a 0.9% drop in August after a 3.1% increase in July. A larger-than-expected fall may indicate weakening demand, possibly affecting the labor market. A deteriorating labor market may affect wages and spending. A pullback in spending could impact the economy as it contributes over 50% to GDP.
On Sunday, September 29, Japan’s newly elected Prime Minister, Shigeru Ishiba, advocated for maintaining loose monetary policy conditions, reportedly stating,
“From the government’s standpoint, monetary policy must remain accommodative as a trend given current economic conditions.”
On Friday, the USD/JPY slumped from a morning high of 146.494 on news of Shigeru Ishiba’s win. Before Sunday’s comments, the markets had expected Ishiba to push for monetary policy normalization. A more dovish Prime Minister could affect demand for the Yen, signaling a possible USD/JPY return to 143.
EUR/JPY extends its upside for the fourth consecutive day, trading around 162.50 during the Asian session on Friday. Technical analysis of the daily chart shows the pair is moving upwards within the ascending channel, suggesting an ongoing bullish bias.
Additionally, the 14-day Relative Strength Index (RSI) remains above the 50 level, confirming the bullish sentiment for the EUR/JPY cross. A further move toward the 70 level would strengthen the upside trend for the currency cross.
On the upside, the EUR/JPY cross may explore the area around its eight-week high at 163.89, which was recorded on August 15. A break above this level could lead the currency cross to test the upper boundary of the ascending channel around the level of 164.50.
In terms of support, the EUR/JPY cross may find immediate support at the lower boundary of the ascending channel around the level of 161.50, followed by the nine-day Exponential Moving Average (EMA) at 160.47 level.
A break below the nine-day EMA could weaken the bullish bias and put downward pressure on the EUR/JPY cross to navigate the area around its seven-week low of 155.15 level.
The table below shows the percentage change of Euro (EUR) against listed major currencies today. Euro was the strongest against the Japanese Yen.
| USD | EUR | GBP | JPY | CAD | AUD | NZD | CHF | |
|---|---|---|---|---|---|---|---|---|
| USD | 0.11% | 0.21% | 0.58% | 0.21% | 0.28% | 0.37% | 0.19% | |
| EUR | -0.11% | 0.09% | 0.46% | 0.04% | 0.17% | 0.25% | 0.10% | |
| GBP | -0.21% | -0.09% | 0.37% | -0.04% | 0.08% | 0.18% | 0.00% | |
| JPY | -0.58% | -0.46% | -0.37% | -0.38% | -0.29% | -0.20% | -0.35% | |
| CAD | -0.21% | -0.04% | 0.04% | 0.38% | 0.08% | 0.20% | 0.02% | |
| AUD | -0.28% | -0.17% | -0.08% | 0.29% | -0.08% | 0.11% | -0.09% | |
| NZD | -0.37% | -0.25% | -0.18% | 0.20% | -0.20% | -0.11% | -0.17% | |
| CHF | -0.19% | -0.10% | -0.00% | 0.35% | -0.02% | 0.09% | 0.17% |
The heat map shows percentage changes of major currencies against each other. The base currency is picked from the left column, while the quote currency is picked from the top row. For example, if you pick the Euro from the left column and move along the horizontal line to the US Dollar, the percentage change displayed in the box will represent EUR (base)/USD (quote).
The USD/JPY weekly forecast leans South due to an increased likelihood of more rate hikes in Japan and cuts in the US.
The USD/JPY pair had a bearish week as the yen rallied after Japan’s election. Meanwhile, the dollar fluctuated due to mixed economic data. The tight election for the Prime Minister seat in Japan ended with a win for former defense minister Shigeru Ishiba. The yen rallied after the result because Ishiba supports the recent Bank of Japan policy moves. Therefore, analysts believe there will be more rate hikes under his leadership.
–Are you interested in learning more about Canada forex brokers? Check our detailed guide-
Meanwhile, the dollar initially had a solid start to the week when data showed steady business activity and a decline in jobless claims. However, it ended weak due to softer-than-expected inflation numbers.
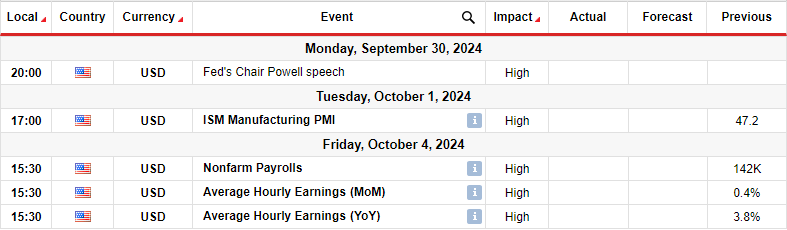
Next week, all eyes will be on US economic data, with none expected from Japan. The US will release figures on manufacturing business activity and employment. Additionally, a speech from Fed Chair Powell might contain clues about future rate cuts.
After the recent FOMC policy meeting, policymakers have taken a more dovish tone, implying more rate cuts in the future. Therefore, there is a chance Powell will continue with this trend, putting downward pressure on the US dollar.
Furthermore, the monthly jobs report will show the state of job growth and unemployment. Economists expect 144,000 more jobs in the economy, a slight increase from the previous reading. Meanwhile, the unemployment rate might hold steady at 4.2%.
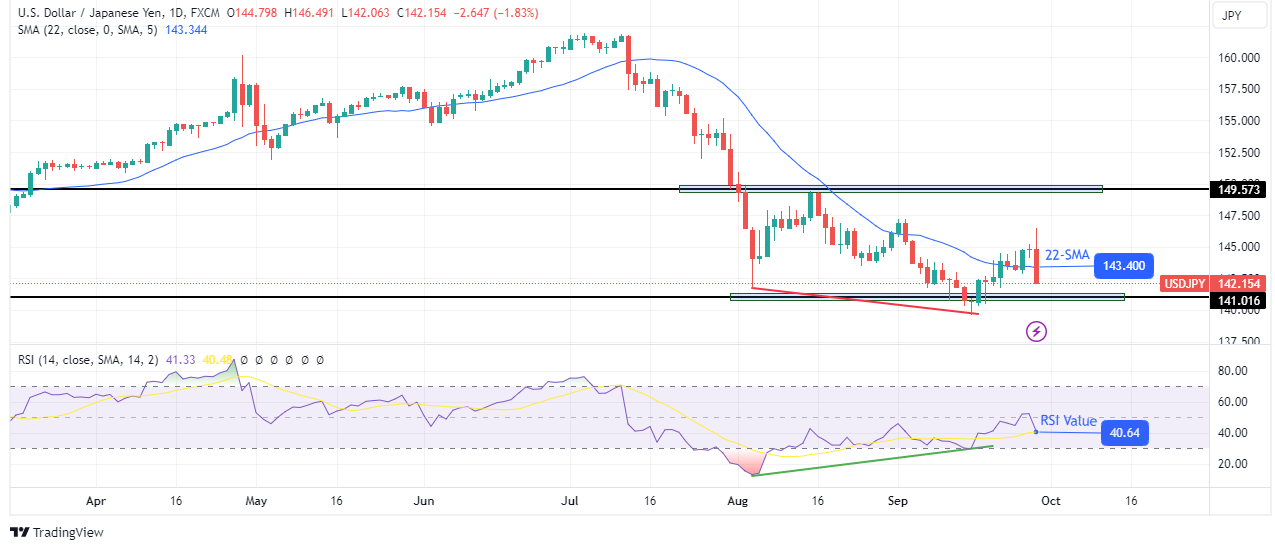
On the technical side, the USD/JPY price is on a bearish trend as the price trades below the 22-SMA, with the RSI in bearish territory. However, price action shows weakness in the downtrend. The price trades near the SMA and has punctured the line several times. This is a sign that bulls are getting stronger.
–Are you interested in learning more about social trading platforms? Check our detailed guide-
Meanwhile, bears are weakening, as seen in the RSI, which has made a bullish divergence. Therefore, if the price fails to break below the 141.01 support in the coming week, it might break above the SMA. Such a break would indicate a shift in sentiment, allowing the price to climb to the 149.57 resistance level.
Looking to trade forex now? Invest at eToro!
68% of retail investor accounts lose money when trading CFDs with this provider. You should consider whether you can afford to take the high risk of losing your money
Silver price (XAG/USD) extends its correction to near $31.60 in Friday’s European session after facing selling pressure from fresh highs of $32.70 on Thursday. The white metal comes under pressure as investors turn cautious ahead of the United States (US) Personal Consumption Expenditure Price Index (PCE) for August, which will be published at 12:30 GMT.
Economists estimate the core PCE price index, a Federal Reserve’s (Fed) preferred inflation measure, to have grown by 2.7%, faster than 2.6% in July, with monthly figures rising steadily by 0.2%. Investors keenly await the US inflation data as it will shape market speculation for the Fed’s likely policy action in the final quarter of this year.
According to the CME FedWatch tool, the central bank is expected to reduce its key borrowing rates further by 75 bps in the remaining two meetings this year, suggesting that there will be one 50 bps and one 25 bps rate cut. 30-day Federal fund futures pricing data shows that traders are equally split over a 25 or 50 bps interest rate cut in November.
Meanwhile, the US Dollar Index (DXY), which tracks the Greenback’s value against six major currencies, surrenders its early gains and hovers above 100.50. 10-year US Treasury yields edge lower to 3.79%.
Silver price falls slightly after posting a fresh decade high near $32.70. The white metal is under pressure ahead of key inflation data. However, its near-term outlook is bullish as all short-to-long-term Exponential Moving Averages (EMAs) are sloping higher.
The 14-day Relative Strength Index (RSI) oscillates in the bullish range of 60.00-80.00, suggesting a strong bullish momentum.
(This story was corrected on September 27 at 11:49 GMT to say that US core PCE inflation is expected to accelerate to 2.7%, not accelerated to 2.7%, nor has it grown by 2.37%.)
Silver is a precious metal highly traded among investors. It has been historically used as a store of value and a medium of exchange. Although less popular than Gold, traders may turn to Silver to diversify their investment portfolio, for its intrinsic value or as a potential hedge during high-inflation periods. Investors can buy physical Silver, in coins or in bars, or trade it through vehicles such as Exchange Traded Funds, which track its price on international markets.
Silver prices can move due to a wide range of factors. Geopolitical instability or fears of a deep recession can make Silver price escalate due to its safe-haven status, although to a lesser extent than Gold’s. As a yieldless asset, Silver tends to rise with lower interest rates. Its moves also depend on how the US Dollar (USD) behaves as the asset is priced in dollars (XAG/USD). A strong Dollar tends to keep the price of Silver at bay, whereas a weaker Dollar is likely to propel prices up. Other factors such as investment demand, mining supply – Silver is much more abundant than Gold – and recycling rates can also affect prices.
Silver is widely used in industry, particularly in sectors such as electronics or solar energy, as it has one of the highest electric conductivity of all metals – more than Copper and Gold. A surge in demand can increase prices, while a decline tends to lower them. Dynamics in the US, Chinese and Indian economies can also contribute to price swings: for the US and particularly China, their big industrial sectors use Silver in various processes; in India, consumers’ demand for the precious metal for jewellery also plays a key role in setting prices.
Silver prices tend to follow Gold’s moves. When Gold prices rise, Silver typically follows suit, as their status as safe-haven assets is similar. The Gold/Silver ratio, which shows the number of ounces of Silver needed to equal the value of one ounce of Gold, may help to determine the relative valuation between both metals. Some investors may consider a high ratio as an indicator that Silver is undervalued, or Gold is overvalued. On the contrary, a low ratio might suggest that Gold is undervalued relative to Silver.
Will the US dollar break free from consolidation next week or continue in a sideways range?
Watch today’s Forex forecast to see the key levels and setups for DXY, EURUSD, GBPUSD, USDJPY, and XAUUSD.
The DXY continues to be a difficult market to read.
On Tuesday, the USD index closed below the 100.60 key support, only to reclaim it by Wednesday’s close.
Typically, this would suggest a local bottom and a move toward the range highs.
However, the DXY is once again losing the 100.60 support today, potentially exposing the confluence of support at 99.60 next week.
This creates a difficult market to read, making it even tougher to trade.
If the DXY loses 100.60 this week, it could open up 99.60 support heading into October.
On the flip side, a weekly close above 100.50/60 would keep the support level intact and could push the DXY toward the 102.00 range highs.
EURUSD has been a challenging market to trade, to say the least.
Since late August, the price action has not only been sideways but also incredibly choppy and indecisive.
While the euro remains above the 1.1110 mid-range I’ve mentioned recently, it has yet to break above the July channel resistance.
Until EURUSD breaks one of these levels, traders should expect continued choppy price action.
That said, I believe the DXY offers a clearer outlook on key levels to watch for next week.

GBPUSD has been much stronger compared to EURUSD.
However, the pair is struggling to break above the ascending trend line from May and is currently just below the 1.3450 to 1.3500 key resistance area.
That said, I wouldn’t consider shorting GBPUSD, given the uptrend since May.
The only way GBPUSD becomes a favorable short is if it sustains a break below 1.3240.
Until then, buyers remain in control.

A few days ago, I mentioned that USDJPY was bullish toward 146.00 to 146.50.
I wasn’t wrong, despite Friday’s massive 430-pip drop.
Notice how Wednesday’s session closed above 144.00, Thursday’s session retested it, and Friday’s candle reached a high of 146.49.
However, predicting next week’s price action is more challenging.
Friday’s close below 144.00 turns the level back into resistance, but USDJPY shorts should be cautious while the pair remains above 141.80 on the daily time frame.

Gold has had an impressive run since June, especially after breaking above $2,527.
That breakout targeted the $2,600 channel resistance I’ve mentioned on this site and later went on to break that level as well.
However, I’m always cautious of upward breaks of ascending levels, as they often result in failed moves.
That said, XAUUSD is still above $2,590, so shorting here wouldn’t be advisable.
If gold breaks below $2,590 on the higher time frames, it could open up $2,527 as new support.
Alternatively, bullish price action from the $2,590 to $2,600 region next week could trigger the next leg higher for XAUUSD.

Silver prices dropped on Friday, finishing the session down by more than 1% after hitting a yearly record high of $32.71 on September 26. Buyers’ failure to cling to gains above $32.00 exacerbated the drop toward $31.60, but they held to weekly profits of over 1.50%.
Silver is upward biased amid dipping to a four-day low of $31.37, but a daily close below the July 13 peak of $31.75 opens the scope to trade within the $31.00-$31.70 range.
The Relative Strength Index (RSI) remains bullish, but in the short term, sellers could push prices toward the September 23 low of $30.36. On further weakness, the next stop would be the 50-day moving average (DMA) at $29.64.
Conversely, if XAG/USD climbs back above $32.00, this could pave the way to test the YTD high of $32.71 before challenging $33.00 ahead of the October 1, 2012, peak at $35340.
Silver is a precious metal highly traded among investors. It has been historically used as a store of value and a medium of exchange. Although less popular than Gold, traders may turn to Silver to diversify their investment portfolio, for its intrinsic value or as a potential hedge during high-inflation periods. Investors can buy physical Silver, in coins or in bars, or trade it through vehicles such as Exchange Traded Funds, which track its price on international markets.
Silver prices can move due to a wide range of factors. Geopolitical instability or fears of a deep recession can make Silver price escalate due to its safe-haven status, although to a lesser extent than Gold’s. As a yieldless asset, Silver tends to rise with lower interest rates. Its moves also depend on how the US Dollar (USD) behaves as the asset is priced in dollars (XAG/USD). A strong Dollar tends to keep the price of Silver at bay, whereas a weaker Dollar is likely to propel prices up. Other factors such as investment demand, mining supply – Silver is much more abundant than Gold – and recycling rates can also affect prices.
Silver is widely used in industry, particularly in sectors such as electronics or solar energy, as it has one of the highest electric conductivity of all metals – more than Copper and Gold. A surge in demand can increase prices, while a decline tends to lower them. Dynamics in the US, Chinese and Indian economies can also contribute to price swings: for the US and particularly China, their big industrial sectors use Silver in various processes; in India, consumers’ demand for the precious metal for jewellery also plays a key role in setting prices.
Silver prices tend to follow Gold’s moves. When Gold prices rise, Silver typically follows suit, as their status as safe-haven assets is similar. The Gold/Silver ratio, which shows the number of ounces of Silver needed to equal the value of one ounce of Gold, may help to determine the relative valuation between both metals. Some investors may consider a high ratio as an indicator that Silver is undervalued, or Gold is overvalued. On the contrary, a low ratio might suggest that Gold is undervalued relative to Silver.
As discussed previously in this column, natural gas has been tracing out a symmetrical triangle consolidation pattern for over six months. The first lower boundary line rises from the February trend low, but a new and higher bottom line was added once the late-August higher swing low was established.
Once price reverses from the low end of a consolidation pattern, the chance for a move to the opposite side of the pattern increases. Support was successfully tested at the low end of the natural gas symmetrical triangle at the late-August low. The subsequent rally opened the possibility of an eventual test of resistance at the top downtrend line.
Today’s high may be that test as natural gas is very close to the top trendline. So far today, it has found resistance at the interim swing high from May 23. However, given the clear bullish momentum that has followed the drop below yesterday’s low from earlier today, the top trendline may be hit in the coming days or a breakout through the line could occur. Today is likely to end with a wide range green candle and the close is on track to be strong, in the top quarter of the day’s trading range, which also means it closes near the highs for the week.
Since upward momentum began after price was rejected to the upside from the 200-Day MA support area last week, a breakout above the trendline in the coming days may not see enough buying pressure to continue to support higher prices in natural gas before a pause or retracement. There is also a good chance the top line will retain resistance and lead to a retracement before an attempt at an upside breakout occurs. Keep in mind that such a move would also trigger a bullish breakout of the triangle formation as well as a trendline. Nonetheless, other than prior swing highs the first higher target looks to be around 3.45.
For a look at all of today’s economic events, check out our economic calendar.
The Pound Sterling (GBP) secured three consecutive months of gains against the US Dollar (USD) in the past week as the GBP/USD pair recaptured the 1.3400 threshold to stay at the highest level since March 2022.
GBP/USD entered a bullish consolidation phase between 1.3435 and 1.3250, sitting at fresh 30-month highs as the monetary policy divergence between the Bank of England (BoE) and the US Federal Reserve (Fed) continued to support the Pound Sterling at the expense of the Greenback.
Cautious remarks from the BoE policymakers contrasted with a slew of explicitly dovish commentary from Fed officials, keeping hopes for 50 basis points (bps) of interest rate cuts by the Fed alive for November. Meanwhile, markets expect the BoE to reduce rates by 25 bps in November.
Several Fed policymakers took up the rostrum and supported their decisions for a 50 bps rate cut move in September, except for Fed Governor Michelle Bowman, who stuck to her hawkish rhetoric.
Meanwhile, BoE Governor Andrew Bailey said Tuesday, “I’m very encouraged that the path of inflation is downwards. Hence, “I do think the path for interest rates will be downwards as well, but gradually.” On the other hand, BoE policymaker Megan Greene said on Wednesday that a “cautious, steady-as-she-goes approach to monetary policy easing is appropriate.”
Apart from the central bank divergence, GBP/USD drew support from persistent risk flows, as risk appetite was boosted by a flurry of stimulus measures from China, such as lowering the key Reserve Requirement Ratio (RRR) by 50 bps.
China’s Politburo, the country’s top leadership, pledged on Thursday to support the struggling economy through “forceful” interest rate cuts and adjustments to fiscal and monetary policies, stoking expectations for more stimulus.
On the economic data front, there were no top-tier releases from the UK. Therefore, traders remained glued to Friday’s core Personal Consumption Expenditures (PCE) Price Index, the Fed’s most preferred inflation gauge, for fresh hints on the size of the next interest rate cut. Markets shrugged off mixed US Jobless Claims and Durable Goods Orders data published on Thursday.
Meanwhile, the Fed’s key inflation measure moved closer to the central bank’s 2% target in August on Friday, exacerbating the USD’s pain, sending the pair back toward the 30-month highs. The headline PCE price index rose 0.1% for the month, putting the annual inflation rate at 2.2%. The core PCE Price Index increased by 2.7% YoY, as expected while the monthly core inflation ticked down to 0.1%, against the previous reading of 0.2%.
Following a mediocre week in terms of economic data releases, the upcoming week is a busy one, with plenty of top-tier statistics due from the United States. On the other side, the UK docket remains devoid of any relevant macro news.
Monday kicks off with a bang, as Fed Chair Jerome Powell is due to participate in a moderated discussion titled “A View from the Federal Reserve Board” at the National Association for Business Economics Annual Meeting in Nashville. BoE policymaker Megan Greene’s speech will follow.
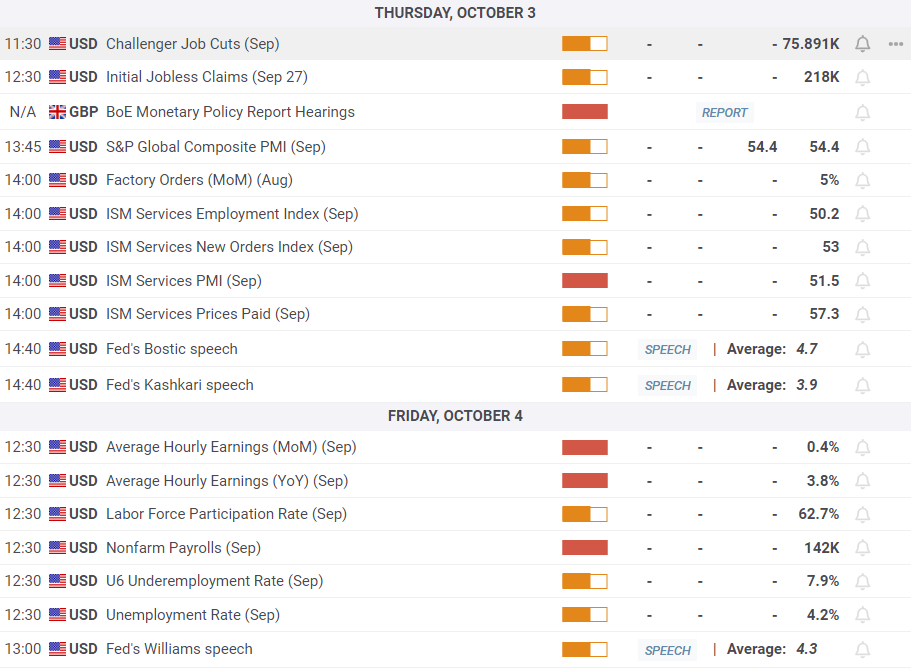
The US ISM Manufacturing PMI and JOLTS Job Openings Survey will grab eyeballs on Tuesday, followed by speeches from Fed officials Raphael Bostic and Lisa Cook.
Early Wednesday will feature a bunch of other Fed policymakers speaking at the Technology-Enabled Disruption Conference hosted by the Federal Reserve Bank of Atlanta. Later that day, the ADP Employment Change data will hog the limelight in American trading alongside more Fedspeak.
The US ISM Services PMI will be reported on Thursday as traders’ focus shifts toward the all-important Nonfarm Payrolls (NFP) slated for release on Friday.
Speeches from Fed officials and the Middle East geopolitical developments will continue to drive the sentiment around the US Dollar, in turn, affecting the GBP/USD pair.
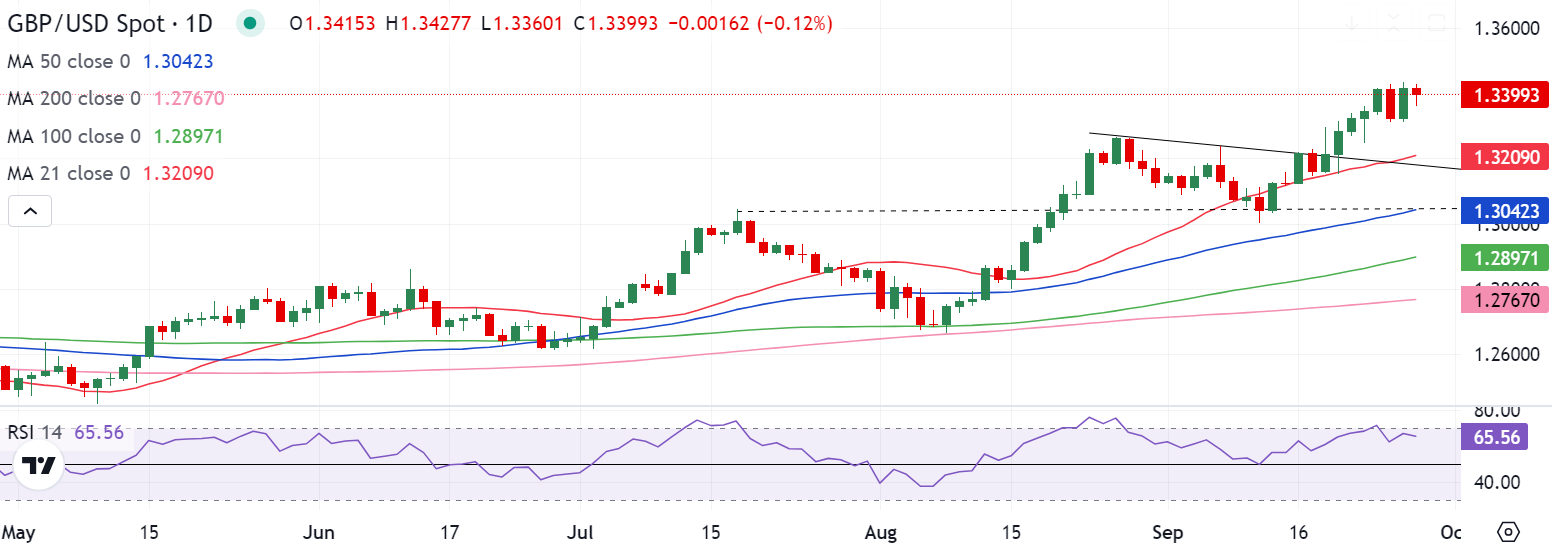
As observed on the daily chart, the GBP/USD pair extended the upside break of the falling trendline resistance, then at 1.3199, to briefly regain the 1.3400 level.
The path of least resistance appears to the upside for the pair, in the absence of any firm resistance levels. Pound Sterling buyers could challenge the initial hurdle at the 1.3500 round level on their way to the February 24, 2022 high of 1.3550.
Acceptance above that level will open doors for a test of the February 2022 high of 1.3644. The next bullish bet aligns at 1.3700.
The 14-day Relative Strength Index (RSI) remains within bullish territory, well above the 50 level, suggesting that more gains remain in the offing.
Alternatively, any pullback could meet initial demand at the September 23 low of 1.3249, below which the falling trendline resistance now turned support at around 1.3200 will be challenged. At that level, the 21-day Simple Moving Average (SMA) coincides.
Additional declines could target the July 17 high of 1.3045, where the 50-day SMA hangs around. The 100-day SMA at 1.2897 will be the last line of defense for buyers.
The Pound Sterling (GBP) is the oldest currency in the world (886 AD) and the official currency of the United Kingdom. It is the fourth most traded unit for foreign exchange (FX) in the world, accounting for 12% of all transactions, averaging $630 billion a day, according to 2022 data. Its key trading pairs are GBP/USD, aka ‘Cable’, which accounts for 11% of FX, GBP/JPY, or the ‘Dragon’ as it is known by traders (3%), and EUR/GBP (2%). The Pound Sterling is issued by the Bank of England (BoE).
The single most important factor influencing the value of the Pound Sterling is monetary policy decided by the Bank of England. The BoE bases its decisions on whether it has achieved its primary goal of “price stability” – a steady inflation rate of around 2%. Its primary tool for achieving this is the adjustment of interest rates. When inflation is too high, the BoE will try to rein it in by raising interest rates, making it more expensive for people and businesses to access credit. This is generally positive for GBP, as higher interest rates make the UK a more attractive place for global investors to park their money. When inflation falls too low it is a sign economic growth is slowing. In this scenario, the BoE will consider lowering interest rates to cheapen credit so businesses will borrow more to invest in growth-generating projects.
Data releases gauge the health of the economy and can impact the value of the Pound Sterling. Indicators such as GDP, Manufacturing and Services PMIs, and employment can all influence the direction of the GBP. A strong economy is good for Sterling. Not only does it attract more foreign investment but it may encourage the BoE to put up interest rates, which will directly strengthen GBP. Otherwise, if economic data is weak, the Pound Sterling is likely to fall.
Another significant data release for the Pound Sterling is the Trade Balance. This indicator measures the difference between what a country earns from its exports and what it spends on imports over a given period. If a country produces highly sought-after exports, its currency will benefit purely from the extra demand created from foreign buyers seeking to purchase these goods. Therefore, a positive net Trade Balance strengthens a currency and vice versa for a negative balance.
The natural gas markets have rallied significantly during the course of the trading session on Friday, as we have broken above the $3 level, at least initially. That being said, there is a massive amount of resistance above as we had formed a double top back in June, so it’ll be interesting to see if we can get above there. The Relative Strength Index is in an overbought condition, so that also comes into the picture, but really when I look at this, the thing that I would pay the most attention to isn’t even on the chart. It’s the hurricane that just ripped through the Gulf of Mexico area.
The question is, did that damage and slow down production enough to drive prices higher? Probably in the short term, but I do recognize that we are getting much closer to the end of this run than we were at the beginning. I took profit yesterday, I’m okay with that. I don’t have any reason to chase this. If we break out to the upside, so be it, I’ll wave goodbye to the trend. Ultimately though, I do think we are about to hit a bit of a brick wall when it comes to resistance, and I think in that environment, you have to be very cautious.
The USD/JPY price analysis supports further downside as the yen rallies after Japan’s former defense minister, Shigeru Ishiba, won the seat for the next prime minister. Meanwhile, cooler-than-expected US inflation data weighed on the dollar.
–Are you interested in learning more about buying NFT tokens? Check our detailed guide-
Japan announced a new prime minister on Friday after a tight race. The outcome boosted the yen since Ishiba supports the current monetary policy moves. Therefore, he might continue supporting the Bank of Japan as it raises borrowing costs.
Although the last meeting was slightly cautious, economists expect at least one BoJ rate hike before the end of the year. Higher borrowing costs reduce the gap in rates between Japan and the US.
Elsewhere, market focus remained trained on the US core PCE report. The Federal Reserve recently cut interest rates by a massive 50-bps. It was a clear indication of confidence that inflation was under control. Therefore, policymakers expect price pressure to continue declining to the target.
Consequently, an unexpected figure could shift the outlook for future moves. Currently, there is a 50% chance of another massive reduction in November. Data on Friday revealed that inflation rose by 0.1%, smaller than the forecast of 0.2%. Therefore, the Fed has every reason to continue lowering borrowing costs.
Moreover, a soft landing is more likely since the economy remains resilient. Notably, data on Thursday showed that US unemployment claims dropped to 218,000 compared to expectations of 225,000. Another report revealed that corporate profits increased at a faster-than-expected rate.
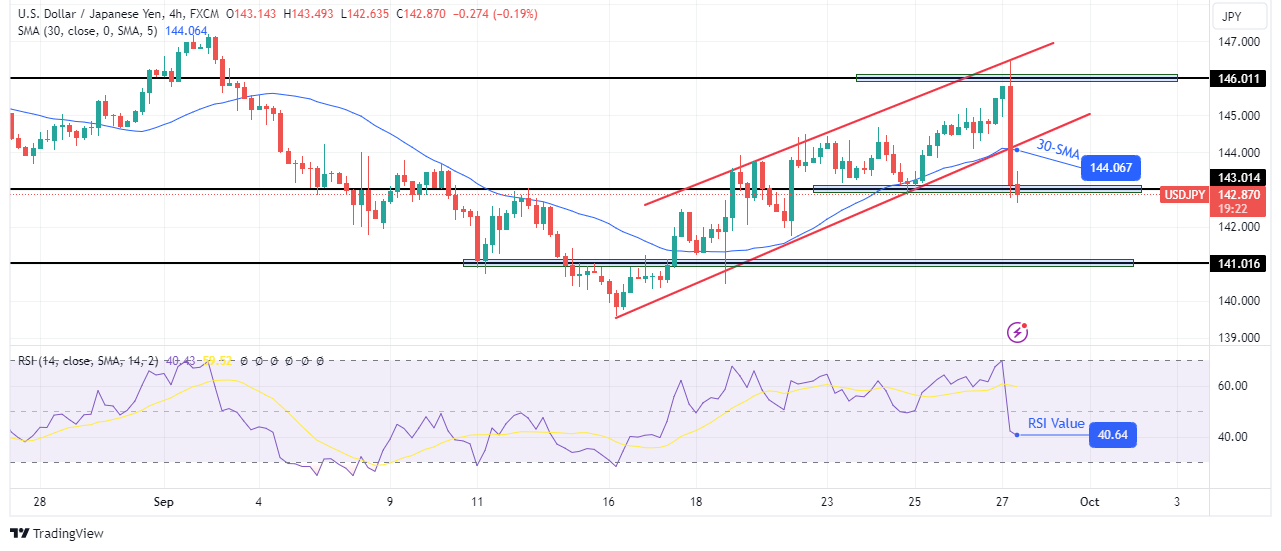
On the technical side, the USD/JPY price has broken out of its bullish channel with a bearish engulfing candle. At the same time, the price has broken below the 30-SMA, indicating a shift in sentiment. Meanwhile, the RSI has dropped below 50, into bearish territory.
-Are you looking for the best CFD broker? Check our detailed guide-
However, the decline has reached the 143.01 support level and might pause here before continuing lower. A pause could allow the price to retest the recently broken channel support. If bears remain in control, the price will likely break below 143.01 support to retest the 141.01 level.
Looking to trade forex now? Invest at eToro!
67% of retail investor accounts lose money when trading CFDs with this provider. You should consider whether you can afford to take the high risk of losing your money.