The main category of Forex News.
You can use the search box below to find what you need.
[wd_asp id=1]
The main category of Forex News.
You can use the search box below to find what you need.
[wd_asp id=1]
Gold price hit yet another record high on Tuesday, changing hands as high as $2,639.99 a troy ounce during Asian trading hours, to break higher after Wall Street’s opening. The absence of relevant macroeconomic releases left financial markets without a fresh directional catalyst throughout the first half of the day, although the prevalent US Dollar’s weakness kept XAU/USD on the bullish side.
The bright metal extended gains beyond the $2,640 mark during the American session and after the release of discouraging United States (US) data. Consumer sentiment in the country deteriorated in September, with The Conference Board’s (CB) Consumer Confidence Index falling to 98.7 in September after printing at 105.6 in August. Even further, the Present Situation Index fell by 10.3 points to 124.3, while the Expectations Index declined by 4.6 points to 81.7 but remained above 80. Readings below it usually anticipate a recession. As a result, market participants lifted bets the Federal Reserve (Fed) could trim interest rates by 50 basis points (bps) once again in November.
Other than that, the Richmond Fed Manufacturing Index contracted to -21 in September from the previous -19 while missing the -17 anticipated. The macroeconomic calendar will remain scarce on Wednesday, with the focus moving to the end of the week when the US will release the August Personal Consumption Expenditures (PCE) Price Index.
XAU/USD trades around $2,645 with no signs of giving up. In the daily chart, the pair keeps posting higher highs and higher lows, while technical indicators maintain modest bullish slopes within overbought levels. At the same time, the pair develops far above bullish moving averages, with the 20 Simple Moving Average (SMA) now hovering at around $2,545.
The near-term picture also skews the risk to the upside, although some timid divergences anticipate a potential corrective slide. In the 4-hour chart, moving averages accelerated north far below the current level, in line with continued buying interest. However, the Momentum indicator keeps grinding lower in positive territory, diverging from price action. Finally, the Relative Strength Index (RSI) indicator maintains the positive bias, advancing near overbought readings just ahead of overbought readings.
Support levels: 2,628.10 2,613.50 2,598.10
Resistance levels: 2,650.00 2,675.00 2,690.00
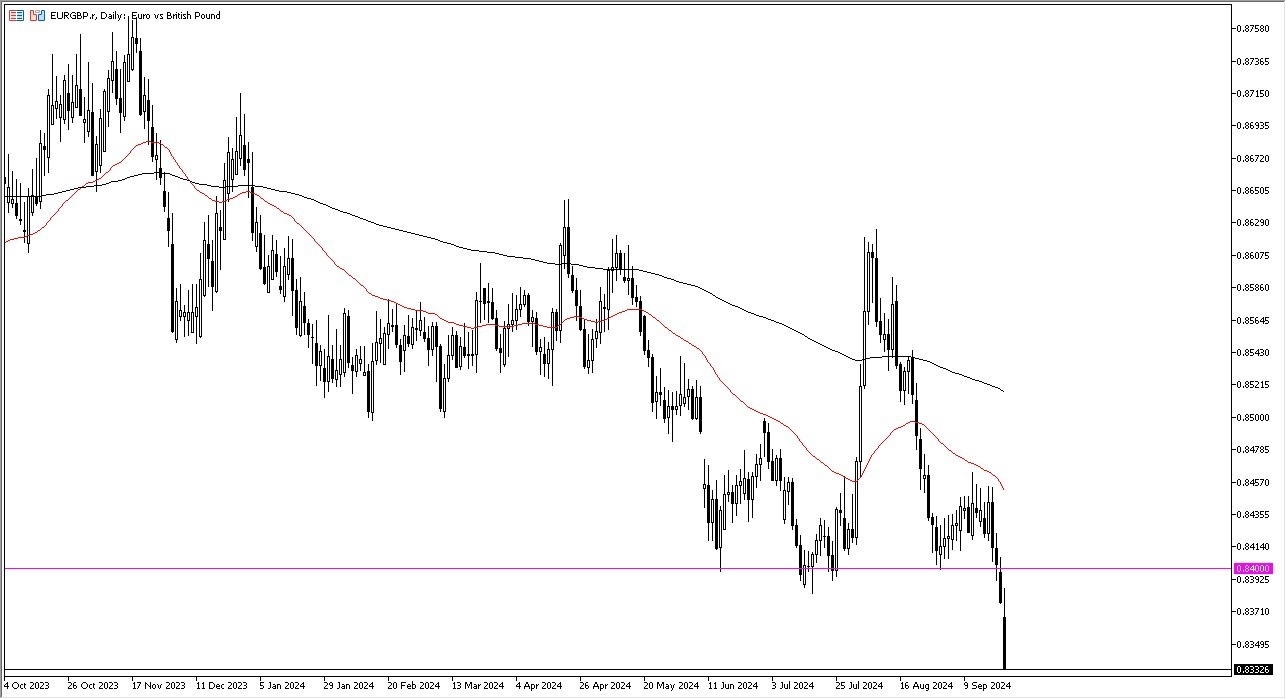
Furthermore, it’s probably worth noting that the Bank of England chose to stand still as far as interest rates are concerned, and this is an obvious reaction to that. In general, this is a market that I think is going to start looking to the 0.83 level, which is a large, round, psychologically significant figure and an area that we have seen a lot of buyers in previously. If we break down through there, then it’s likely that they absolute floor will fall apart, and we could see the EUR/GBP market just dropped drastically.

Looking at this chart, there’s absolutely nothing positive on it, with perhaps the lone exception of the 0.83 level being an area that some people may be looking for to bounce. However, we would have to break above the 50 Day EMA in order to see some type of turnaround and a push to the upside that allows the market to go looking to the 200 Day EMA. Ultimately, I think this is a market that is in freefall, and it is very likely that we will continue to see a lot of money flow out of the EUR and into the GBP. In general, I think this is a situation that will continue to see a lot of questions asked about the overall attitude of risk appetite and of course the idea of whether or not we are going to see the European Union finally turn around and strengthen, or if the fact that the ECB has cut a couple of times in the BOE hasn’t bothered continue to push this market around
Ready to trade our Forex daily analysis and predictions? Here are the best trading platform for beginners to choose from.
According to Forex trading, his comments weakened the prospects of a rate hike in October, although one is still expected in December. However, Ueda maintained his forecast that the economy is steadily progressing towards a modest recovery, affirming that the central bank “will continue to adjust the degree of easing” if its economic and price forecasts are realized.
Externally, the yen faced pressure from rising risk assets after the Federal Reserve’s large interest rate cut boosted global economic expectations.
According to stock trading platforms, the Standard & Poor’s 500 and Dow Jones rose to new record highs. According to performance, the Standard & Poor’s 500 rose 0.3%. Also, the Dow Jones rose 0.1%, both hitting new record highs at the start of the week after last week’s rally that was spurred by the Federal Reserve’s first interest rate cut in four years, which was set at 50 basis points.
Also, the Nasdaq rose 0.1%. Investors closely evaluated the comments of several policymakers to understand the rationale behind the Fed’s large 50 basis point interest rate cut. Fed officials including Raphael Boucek, Neel Kashkari and Austan Goolsbee have expressed support for the latest cut and indicated their preference for additional rate cuts in the coming months.
Among the stock performers, Intel shares jumped 3.4% after reports of a potential multi-billion-dollar investment from Apollo Global Management. Tesla shares rose 4.9% as investors looked ahead to the launch of its long-awaited robotaxi and upcoming third-quarter sales figures.
On the economic data front, concerns about economic growth persist, as US manufacturing data reached a 15-month low and Labor market indicators showed signs of weakness.
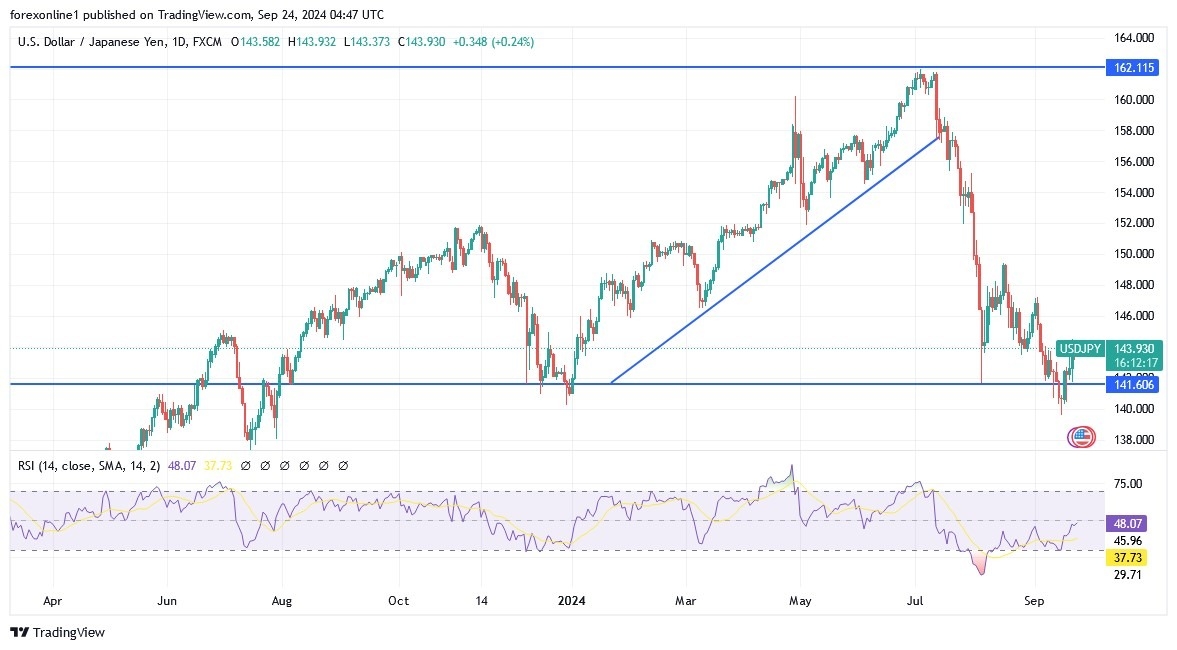
My technical outlook for the USD/JPY pair remains unchanged. Despite its recent gains, the overall trend remains bearish, and the proximity to the psychological support level of 140.00 still confirms the bears’ control of the trend. According to the daily chart attached, a reversal of the overall trend to bullish will not occur without moving towards resistance levels of 147.90 and 150.00, respectively. As mentioned earlier, the USD/JPY price will remain subject to signals from global central bank officials regarding the future of tightening or easing. Also, investor risk appetite, in addition to awaiting the US Federal Reserve’s preferred US inflation reading at the end of the week.
Want to trade our USD/JPY forex analysis and predictions? Here’s a list of forex brokers in Japan to check out.
Gold price is moving slightly away from a new record high of $2,635 early Tuesday, replicating the price action seen in Monday’s Asian trading. Traders look forward to a fresh slew of speeches from the US Federal Reserve (Fed) policymakers and the US Consumer Confidence data before placing more bullish bets on Gold price.
Despite a modest recovery staged by the US Dollar and overbought conditions on the daily chart, Gold price holds its position close to the all-time high, as buyers refuse to give up on the back of the latest dovish Fed commentaries, increased hopes of Chinese stimulus coming through and escalating Middle East geopolitical tensions.
At the highly-anticipated press conference, People’s Bank of China (PBOC) Governor Pan Gongsheng announced a series of measures to boost the economic recovery, including plans to cut the reserve requirement ratio (RRR) by 50 basis points (bps). Increased expectations that these stimulus measures would stimulate the economy keep the pullback restricted in Gold price. China is the world’s top yellow metal consumer.
In addition, Bloomberg reported that Israel intensified its airstrikes in southern Lebanon, killing about 500 people while injuring 1000. This was the deadliest attack since the 2006 Israel-Hezbollah war. This follows the weekend’s exchange of missiles by both Israel and Hezbollah, as the Middle-East strife seems to translate into a wider regional conflict. Gold price tends to benefit from geopolitical tensions due to its traditional safe-haven status.
Meanwhile, Gold buyers also stay hopeful, as markets are wagering another 50 bps rate hike in November, courtesy of the dovish Fed talks. Fed policymakers continued to advocate the need for more rate cuts amid looming downside risks to the labor market, as inflation continues to move closer to the bank’s 2.0% target. Amongst the Fed officials who spoke on Monday, Chicago Fed President Austan Goolsbee was the most dovish, noting that “many more rate cuts are likely needed over the next year, rates need to come down significantly.”
The focus now remains on Fed Governor Michelle Bowman’s speech and the US Conference Board (CB) Consumer Confidence data for fresh trading incentives in Gold price, as Middle East escalation will be also closely eyed.
On Monday, Gold price recorded a fresh all-time high after a brief retreat, underpinned by a renewed decline in the US Dollar, as markets turned risk-averse on discouraging global business PMI reports. The S&P Global US preliminary Manufacturing PMI contracted further to 47.0 in September, compared to 48.5 expected and August’s 47.9. The Services PMI also dipped to 55.4 in September from 55.7 in August.
As observed on the daily chart, the overbought conditions, as represented by the 14-day Relative Strength Index (RSI) sitting above 70, continue to warrant caution for Gold buyers.
If buyers fight back control, acceptance above the record high of $2,635 is critical to unleashing further upside toward the $2,650 psychological barrier. The next relevant resistance is seen at the $2,700 threshold.
Should the corrective downside gather traction, Gold price will likely test the previous day’s low of $2,613, below which the $2,600 threshold will come into play.
Further south, Gold sellers could target the September 20 low of $2,585.
Gold has played a key role in human’s history as it has been widely used as a store of value and medium of exchange. Currently, apart from its shine and usage for jewelry, the precious metal is widely seen as a safe-haven asset, meaning that it is considered a good investment during turbulent times. Gold is also widely seen as a hedge against inflation and against depreciating currencies as it doesn’t rely on any specific issuer or government.
Central banks are the biggest Gold holders. In their aim to support their currencies in turbulent times, central banks tend to diversify their reserves and buy Gold to improve the perceived strength of the economy and the currency. High Gold reserves can be a source of trust for a country’s solvency. Central banks added 1,136 tonnes of Gold worth around $70 billion to their reserves in 2022, according to data from the World Gold Council. This is the highest yearly purchase since records began. Central banks from emerging economies such as China, India and Turkey are quickly increasing their Gold reserves.
Gold has an inverse correlation with the US Dollar and US Treasuries, which are both major reserve and safe-haven assets. When the Dollar depreciates, Gold tends to rise, enabling investors and central banks to diversify their assets in turbulent times. Gold is also inversely correlated with risk assets. A rally in the stock market tends to weaken Gold price, while sell-offs in riskier markets tend to favor the precious metal.
The price can move due to a wide range of factors. Geopolitical instability or fears of a deep recession can quickly make Gold price escalate due to its safe-haven status. As a yield-less asset, Gold tends to rise with lower interest rates, while higher cost of money usually weighs down on the yellow metal. Still, most moves depend on how the US Dollar (USD) behaves as the asset is priced in dollars (XAU/USD). A strong Dollar tends to keep the price of Gold controlled, whereas a weaker Dollar is likely to push Gold prices up.
Overall, investors are now betting on around 44 basis points in additional interest rate cuts by the ECB this year, with a 40% probability of a cut in October. The central bank cut interest rates by 25 basis points for the second time this year in September, and hinted at further cuts in the future due to slowing inflation and weak economic growth in the Eurozone.
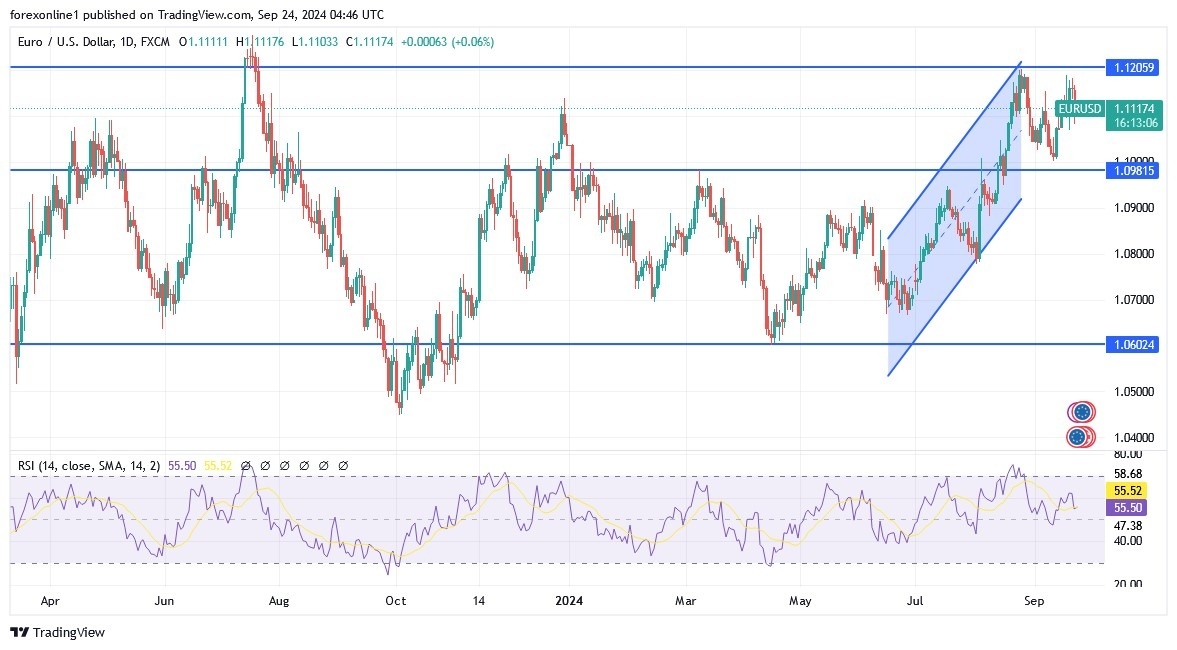
The EUR/USD exchange rate could rise, and analysts believe that the resistance level of 1.12 is an attractive target in the near term. Generally, the recent gains made by the Euro against the US Dollar are due to developments in the United States, where the massive 50 basis point US interest rate cut by the Federal Reserve last week ignited a new wave of dollar weakness.
We are noticing signs of over-extension in the exchange rates of many US dollars, and we wonder whether the US dollar is due for a comeback in the coming days as recent moves consolidate. This was the risk we see in the GBP/USD pair, and any decline there is likely to reflect weakness in the main EUR/USD pair.
Technically, there is only one level ahead that matters: the resistance level of 1.12. This is the level where the previous EUR/USD rallies that lasted for several weeks in August 2024 and mid-2023 failed. According to the forecast, the EUR/USD pair looks set to test the resistance level at 1.1202, its recent high, if the US dollar continues to slow as we expect. A test of the 1.12 resistance level seems likely, but whether it will happen this week is another matter. As we have already mentioned, the recent weakness in the US dollar seems overdone, and some neutrality may be in order.
In general, in the Eurozone, the forex markets will be watching the September PMI survey on Monday, as well as the German IFO survey, due out on Tuesday. However, the impact of these data will be short-lived as recent weeks have consistently confirmed that the dollar and the US Federal Reserve’s policy are the only options available.
For this reason, we will continue to focus on the existing risks in the United States in the coming days; the core personal consumption expenditure figures, which will be released on Friday, will be the Federal Reserve’s preferred measure of inflation. Meanwhile, financial markets expect US inflation to rise by 0.1 percentage point to 2.7% year-on-year in August. Rising inflation conflicts with expectations of a generous flow of interest rate cuts by the Federal Reserve from now until late 2025, and if the market wakes up to this clear contradiction, the dollar could recover.
Initially, Monitor the different policymakers at the Federal Reserve who are scheduled to give speeches this week. Thus, any cautionary voices about the pace of future cuts could give the market a reason to rebalance to a lower level of euphoria that prevailed last week.
According to the performance on the daily chart attached, EUR/USD bulls are trying to break the psychological resistance barrier of 1.1200 to confirm control. Thus, the pair prepares to test stronger peaks, in which case technical indicators will move towards strong overbought levels. In the same time frame, as we mentioned before, the support levels of 1.1075 and 1.0885 will remain the most important to confirm the general trend turning to the downside. Today, the euro will be affected by the announcement of the German IFO reading and the dollar will be affected by the announcement of the US consumer confidence reading.
Ready to trade our daily EUR/USD Forex analysis? We’ve made this forex brokers list for you to check out.
It does make a certain amount of sense because Wall Street, specifically the Americans are celebrating the idea of a falling US dollar due to the Federal Reserve and cutting interest rates by 50 basis points last week.
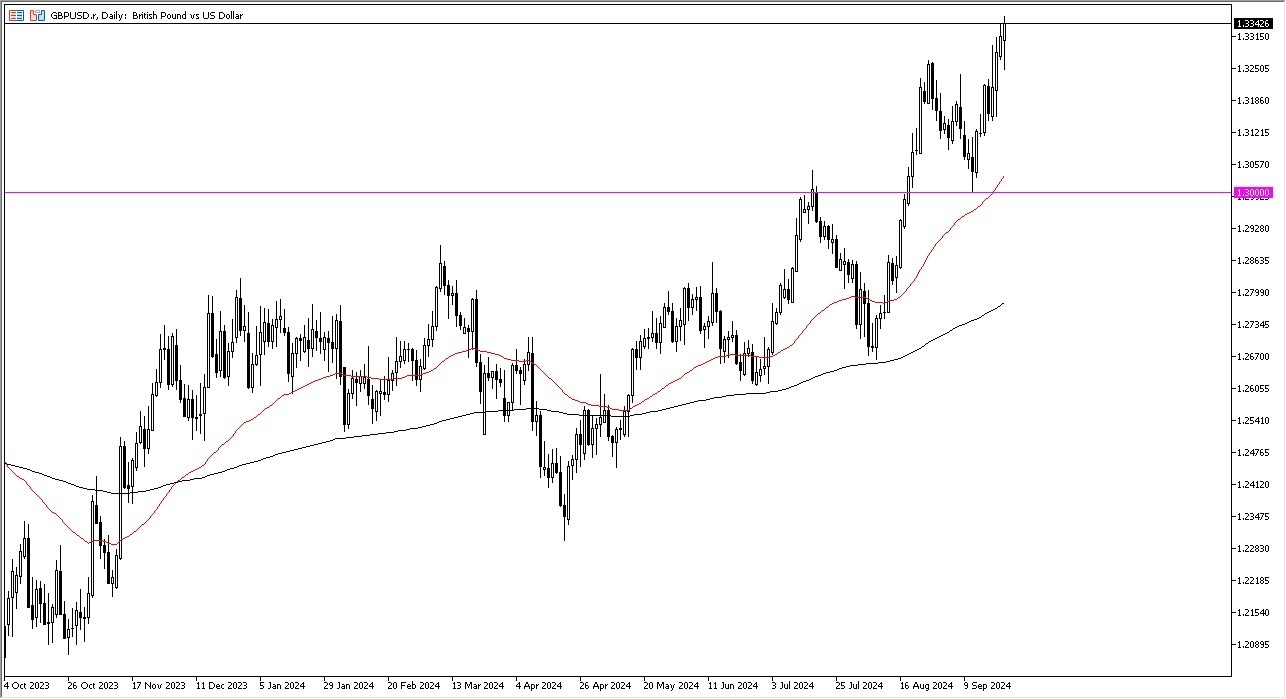
The Bank of England on the other hand has not cut and therefore it shows that it has a bit more resiliency and I think that’s something that must be kept in the back of your mind as well. In fact, the British pound might be one of the better performing currencies out of the G10 that I follow due to central bank policy being much more hawkish than many others. The market is dropping from here, but will find plenty of support at multiple spots, but I believe the 1.30 level is really the floor in the market at the moment. If we can break above the 1.35 level, then I do believe that the British pound continues to go higher, and I think it probably could happen. We are a little bit stretched at the moment, but the way we rebounded later in the day does suggest that there are still plenty of people willing to come in and pick up dips.
Ultimately, this is a market that looks very bullish, but that does not necessarily mean that the market is going to fall apart in the short term. In general, do believe that value hunters will continue to be one of the major drivers of this pair, as the central bank divergence will continue to capture a lot of attention.
Ready to trade our GBP/USD daily analysis and predictions? Here are the best forex trading platforms UK to choose from.
Downward trends in consumer confidence could signal reduced spending, supporting a more dovish Fed rate path. Increasing expectations of multiple 2024 Fed rate cuts could push the USD/JPY below 142.5. However, fears of a US hard economic landing could intensify if the Index falls below 100, possibly fueling a flight to safety. Private consumption contributes over 60% to the US economy.
USD/JPY trends will depend on the services PMI from Japan, US consumer confidence figures, and central bank commentary. Weaker-than-expected PMI numbers and cautious comments from the BoJ Governor could impact Yen demand. Moreover, a modest decline in US consumer confidence may bolster expectations of a soft US landing, supporting a USD/JPY move toward 145.
Investors should remain alert, with economic indicators and central bank commentary to dictate demand for the USD/JPY pair. Monitor real-time data, central bank views, and expert commentary to adjust your trading strategies accordingly. Stay ahead of the market with our expert insights.
The USD/JPY remains well below the 50-day and 200-day EMAs, affirming bearish price signals.
A USD/JPY return to 145 would support a move toward the 145.891 resistance level. Furthermore, a break above the 145.891 resistance level could give the bulls a run at the 50-day EMA.
Services sector PMI figures from Japan, consumer confidence numbers from the US, and central bank commentary require consideration.
Conversely, a fall through the 143.495 support level could signal a drop toward the 141.032 support level.
The 14-day RSI at 46.36 indicates a USD/JPY fall to the 141.032 support level before entering oversold territory.
The USD/JPY snapped two days of gains and dropped late in the North American session following softer-than-expected US economic data, fueling rate cut speculation by the Federal Reserve. At the time of writing, the pair trades at 143.45 after hitting a daily high of 144.46.
From a technical standpoint, the USD/JPY is downward biased despite printing a leg-up after bouncing from the September 16 low of 139.58 to the September 20 high of 144.49. It should be said that the rally continued to remain capped by the Kijun-Sen at 143.81, opening the door for further losses.
Momentum remains negative, as the Relative Strength Index (RSI) portrays. Therefore, tha path of least resistance is tilted to the downside.
The first support would be the Senkou Span Aat 142.92, followed by the Tenkan-Sen at 142.03, before challenging the September 20 swing low of 141.73. If surpassed, the USD/JPY could aim toward the September 16 pivot low of 139.58.
Conversely, if USD/JPY buyers move in and push prices above 144.00, further upside lies above the September 20 high of 144.49.
The Japanese Yen (JPY) is one of the world’s most traded currencies. Its value is broadly determined by the performance of the Japanese economy, but more specifically by the Bank of Japan’s policy, the differential between Japanese and US bond yields, or risk sentiment among traders, among other factors.
One of the Bank of Japan’s mandates is currency control, so its moves are key for the Yen. The BoJ has directly intervened in currency markets sometimes, generally to lower the value of the Yen, although it refrains from doing it often due to political concerns of its main trading partners. The current BoJ ultra-loose monetary policy, based on massive stimulus to the economy, has caused the Yen to depreciate against its main currency peers. This process has exacerbated more recently due to an increasing policy divergence between the Bank of Japan and other main central banks, which have opted to increase interest rates sharply to fight decades-high levels of inflation.
The BoJ’s stance of sticking to ultra-loose monetary policy has led to a widening policy divergence with other central banks, particularly with the US Federal Reserve. This supports a widening of the differential between the 10-year US and Japanese bonds, which favors the US Dollar against the Japanese Yen.
The Japanese Yen is often seen as a safe-haven investment. This means that in times of market stress, investors are more likely to put their money in the Japanese currency due to its supposed reliability and stability. Turbulent times are likely to strengthen the Yen’s value against other currencies seen as more risky to invest in.
Spot Gold traded as high as $2,634.74 a troy ounce on Monday, achieving yet another record high. XAU/USD currently hovers around $2,530, as the broad US Dollar weakness maintains the pair afloat. The Greenback found near-term demand throughout the first half of the day, but gains were modest, and the USD advance looked corrective.
It later suffered a setback as multiple Federal Reserve (Fed) officials publicly supported last week’s decision to trim rates by 50 basis points (bps) while hinting at more monetary loosening in the next few months. The dovish shift in policymakers’ tone did not impact Wall Street, as US indexes hover around their opening levels, not far from the highs posted last week.
Meanwhile, S&P Global released the preliminary estimates of the United States (US) September Purchasing Managers Indexes (PMIs), which showed business activity growth remained robust in the month. The Manufacturing PMI declined to 47 from the previous 47.9, missing the 48.5 anticipated by financial markets. On the other hand, the Services PMI posted 55.4, which is better than the 55.2 expected. Finally, the Composite PMI was reported at 54.4, slightly below the previous 54.6.
By the end of the week, the US will publish the August Personal Consumption Expenditures (PCE) Price Index, the Fed’s favorite inflation gauge. The data could hint at what the central bank may do next and whether aggressive rate cuts would become the norm.
XAU/USD is up for a third consecutive day, and technical readings maintain the bullish case alive despite the easing momentum. The daily chart shows technical indicators are stabilizing within overbought readings while moving averages maintain their positive strength far below the current level. In fact, the 20 Simple Moving Average (SMA) stands at around $2,540, reflecting bulls’ strength in the last few weeks.
In the near term, and according to the 4-hour chart, some unconfirmed bearish divergences hint at a potential correction. Technical indicators pulled back from their recent highs with neutral-to-bearish slopes, supporting a near-term retracement. At the same time, XAU/USD keeps developing above bullish moving averages, with the 20 SMA accelerating north above the longer ones and acting as dynamic support at around $2,597.
Support levels: 2,613.50 2,698.10 2,684.60
Resistance levels: 2,635.00 2,650.00 2,675.00
I had been positioned for this previously, although I was focusing more on the idea of colder temperatures coming to the stage. So, we may have a spike, a pullback, a pretty significant pullback, and then that move again. Traders are starting to bring in the idea of those colder temperatures. So, this hurricane threat kind of all hits at the right time to just really get things going. Now, with that being said, I do think that you can’t chase it here. You also can’t do a huge position.
You have to be very cautious about overextending yourself. If we get a significant pullback, perhaps the hurricane comes to the Gulf of Mexico, nothing really happens. That might be your entry point. But again, as you know, you’ve been watching me here, I’m actually long via an ETF. So, while the gains are substantial here, and I may trend trim some of them, the reality is I’m not levered that much, so I don’t really care. The only way to play this market is swing trading with low leverage that I have found.
For a look at all of today’s economic events, check out our economic calendar.