The main category of Forex News.
You can use the search box below to find what you need.
[wd_asp id=1]
The main category of Forex News.
You can use the search box below to find what you need.
[wd_asp id=1]
With the 50-day EMA at $1.33305, the pair remains supported in the short term, but pressure is building.
If the price fails to reclaim $1.34288, further bearish momentum could unfold. However, a break above the pivot would indicate a potential bullish reversal.
Earlier this week, the German Ifo Business Climate index fell to 85.4, missing expectations of 86.1, signalling a deteriorating business outlook.
Additionally, weak PMIs across Germany and France, including French Manufacturing PMI at 44.0 and German Manufacturing PMI at 40.3, further underscore sluggish growth.
The Belgian NBB Business Climate also dropped to -13.3. With no major data scheduled for Wednesday, traders assess the euro’s vulnerability amid ongoing economic challenges in the Eurozone.
The EUR/USD is trading at $1.11928, up 0.12%, as it hovers near key resistance at $1.11992. A break above this level could push the pair toward $1.12130 and $1.12233, signalling further bullish momentum.
Resistance was seen around the rising trendline at the bottom of a large symmetrical triangle pattern. Today’s 73.52 high may end a counter-trend rally following a breakdown from the triangle formation three weeks ago given that a test of resistance at the line has occurred. At the same time, the 20-Day MA was recaptured three days ago, and today’s trading range is fully above the 20-Day line.
These are short-term signs of strength that may lead to a test of resistance at higher prices. The 61.8% retracement at 73.74 is the next higher price level to watch, while a breakout above that level is followed by potential resistance around the falling 50-Day MA (orange), currently at 74.94. Notice that the 50-Day line has converged with the internal downtrend line as they point to similar resistance levels.
Given the bearish breakdown of the triangle pattern, crude oil is anticipated to eventually find resistance and turn back down to retest recent lows and possibly go lower. The long-term downtrend line, which represents potential support, was approached on the recent decline to 66.65, but it was not hit. Therefore, if a bearish reversal ensues the trendline may eventually be approached. A 33-month low of 63.67 can be watched for now as a proxy for the trendline. Notice that the trendline has not been tested as support since June 2023.
Regardless of the bearish implications from the symmetrical triangle breakdown, that would start to change on a daily close above the 50-Day MA. Along with the 50-Day line keep an eye on how the month ends. Given that September will be ending shortly, the monthly chart may also provide clues. It is currently set up as a potentially bullish hammer candlestick pattern with a high of 75.19. Therefore, holding above the 50-Day line puts the monthly high in range.
For a look at all of today’s economic events, check out our economic calendar.
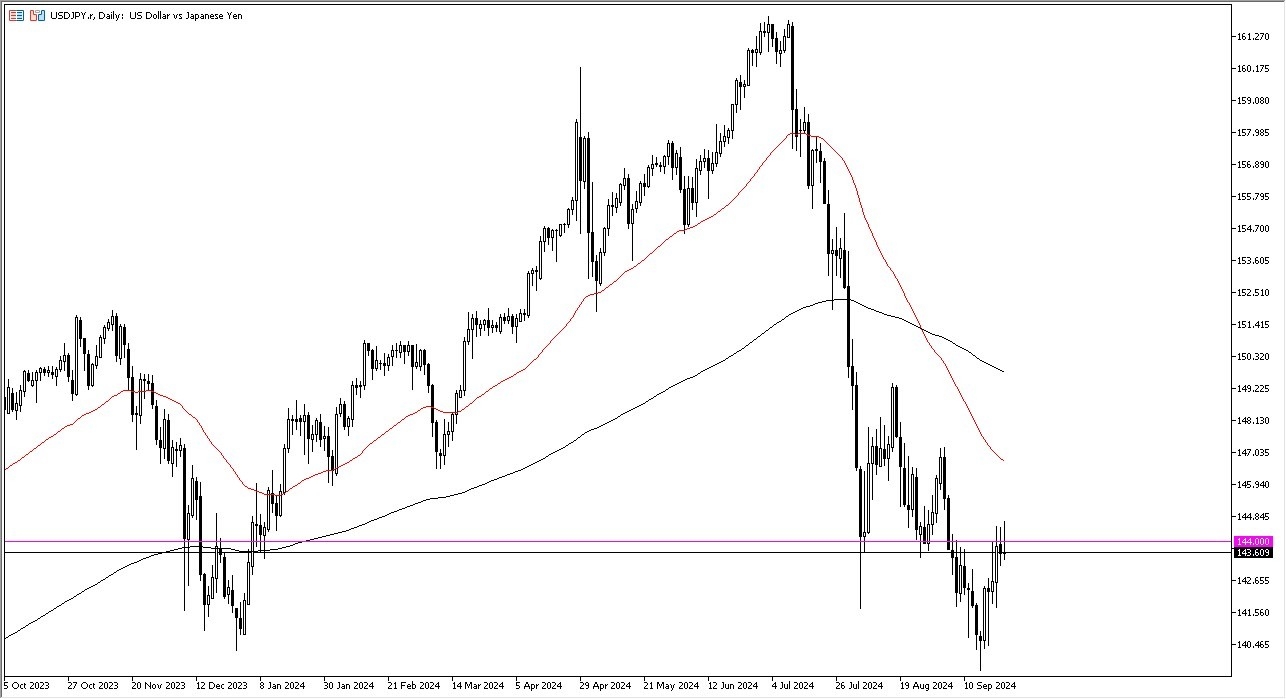
Short-term pullbacks are more likely than I could see a bit of support, but we’ll have to wait and see how things play out. After all, the Federal Reserve has cut interest rates by 50 basis points, but at the same time we’ve seen the Bank of Japan sit on the sidelines and do nothing, and that suggests to me that interest rates are going to stay extraordinarily low in Japan. I’ve been saying for a while that I didn’t think the Bank of Japan could do much due to the fact that the debt level is so massively hindered by the idea that higher interest rates just are not sustainable.

So, with that, I do think it’s only a matter of time before the Japanese yen gets hammered. And we see other currencies rally against it. Now, whether or not that happens right now remains to be seen. But I certainly think that we are in the midst of trying to turn things around.
The 140 yen level underneath is going to continue to be a major support level and as long as we can stay above there. I’m still willing to take a shot at buying this pair occasionally, but I also recognize that it’s got a lot of work to do. This might be something that takes weeks if not months to turn around, so therefore I don’t put a lot of money into any one particular position, but I do keep it in the back of my mind. I get paid at the end of every day to hang on to a long trade.
Ready to trade our daily USD/JPY forex forecast? Here are the best forex brokers in Japan to choose from.
Silver price (XAG/USD) climbs to near $31.00 in Tuesday’s European session. The white metal gains as on firm speculation for the Federal Reserve (Fed) 50 basis points (bps) interest rate cut in November, the announcement of monetary stimulus by China, and escalating Middle East tensions.
According to the CME FedWatch tool, the likelihood of the Fed reducing interest rates by 50 bps to 4.25%-4.50% in November has increased to 51% from 29% a week ago. This has weighed on the US Dollar (USD). The US Dollar Index (DXY), which tracks the Greenback’s value against six major currencies, falls to near 100.80. Historically, lower US Dollar makes the Silver price an inexpensive bet for investors.
Market expectations for Fed large interest rate cuts have strengthened as recent commentaries from policymakers have indicated that they are worried about deteriorating job growth.
Meanwhile, China’s top regulators have announced a slew of stimulus measure to uplift their economy. This would improve the demand for Silver as metal, given that it has applications in various industries, such as electric vehicles and wires and cables, etc.
In the Middle East region, escalating tensions between Israel and Lebanon’s Hezbollah has improved Silver’s demand as a safe-haven asset. Mid-East conflicts deepened after Israel’s airstrike in southern Lebanon on Monday.
Silver price strengthens as it holds the breakout of the downward-sloping trendline from May 21 high of $32.50. Upward-sloping 20-day Exponential Moving Average (EMA) near $29.85 suggests that the near-term outlook of the Silver price is bullish.
The 14-day Relative Strength Index (RSI) strives to sustain in the 60.00-80.00. A bullish momentum would trigger if the oscillator manages to do so.
Silver is a precious metal highly traded among investors. It has been historically used as a store of value and a medium of exchange. Although less popular than Gold, traders may turn to Silver to diversify their investment portfolio, for its intrinsic value or as a potential hedge during high-inflation periods. Investors can buy physical Silver, in coins or in bars, or trade it through vehicles such as Exchange Traded Funds, which track its price on international markets.
Silver prices can move due to a wide range of factors. Geopolitical instability or fears of a deep recession can make Silver price escalate due to its safe-haven status, although to a lesser extent than Gold’s. As a yieldless asset, Silver tends to rise with lower interest rates. Its moves also depend on how the US Dollar (USD) behaves as the asset is priced in dollars (XAG/USD). A strong Dollar tends to keep the price of Silver at bay, whereas a weaker Dollar is likely to propel prices up. Other factors such as investment demand, mining supply – Silver is much more abundant than Gold – and recycling rates can also affect prices.
Silver is widely used in industry, particularly in sectors such as electronics or solar energy, as it has one of the highest electric conductivity of all metals – more than Copper and Gold. A surge in demand can increase prices, while a decline tends to lower them. Dynamics in the US, Chinese and Indian economies can also contribute to price swings: for the US and particularly China, their big industrial sectors use Silver in various processes; in India, consumers’ demand for the precious metal for jewellery also plays a key role in setting prices.
Silver prices tend to follow Gold’s moves. When Gold prices rise, Silver typically follows suit, as their status as safe-haven assets is similar. The Gold/Silver ratio, which shows the number of ounces of Silver needed to equal the value of one ounce of Gold, may help to determine the relative valuation between both metals. Some investors may consider a high ratio as an indicator that Silver is undervalued, or Gold is overvalued. On the contrary, a low ratio might suggest that Gold is undervalued relative to Silver.
Gold price is consolidating near the highest level on record at $2,664 early Wednesday, struggling for a fresh upside boost amid a risk-on market profile and extremely overbought conditions on the daily chart.
Risk sentiment receives a fresh boost in Asian trading on Wednesday after the People’s Bank of China (PBOC) cut the one-year Medium-term Lending Facility (MLF) rate from 2.30% to 2.0% on Thursday, in a bid to shore up the dwindling economy. The MLF rate reduction is one such measure among a host of other stimulus efforts rolled out by China lately.
Gold price appears to lack a bullish conviction, at the moment, as China stimulus optimism weighs on the traditional safe-haven on one side while on the other hand, it raises hopes of a potential increase in Chinese demand, as the dragon nation is the world’s top Gold consumer.
However, Gold price draws support from rallying global equities and growing expectations that the US Federal Reserve (Fed) will opt for a 50 basis points (bps) interest rate cut in November, which continue to undermine the US Dollar (USD) and the US Treasury bond yields.
On Tuesday, the USD was dumped across the board alongside the US Treasury bond yields on China’s stimulus-driven risk flows and weak US Conference Board (CB) Consumer Confidence and regional activity data. Soft data stoked another outsized Fed rate cut expectations at the upcoming meeting.
The CB Consumer Confidence Index dropped to 98.7 this month from an upwardly revised 105.6 in August, registering the largest decline since August 2021. Meanwhile, The Richmond Fed index fell to a 52-month low of -21 from a prior low of -19 in August and a low before that of -17 in July.
Markets are currently pricing in about a 60% chance of such a move, the CME Group’s Fed WatchTool shows. For the next two Fed meetings, rate futures are implying more than 80 bps in cuts. Additionally, the US Dollar also bore the brunt of the sell-off in US Treasury bond yields across the curve, triggered by a strong auction of US two-year government bonds.
Looking ahead, there is no top-tier US economic data in the docket. However, speeches from Fed policymakers and risk trends will continue to play a pivotal role in the Gold price action. Further, Gold traders could also resort to repositioning ahead of a bunch of Fedspeak due Thursday, including the key opening remarks from Fed Chair Jerome Powell at the US Treasury Market Conference in New York.
As observed on the daily chart, the extremely overbought conditions, as represented by the 14-day Relative Strength Index (RSI) flriting with the 80 level, suggest that a correction could be in the offing.
If buyers flex their muscles, acceptance above the $2,670 round level is critical to unleashing further upside toward the $2,700 barrier.
On the flip side, any correction in Gold price will likely test the previous day’s low of $2,623, below which the $2,600 threshold will come into play.
Further south, Gold sellers could target the September 20 low of $2,585.
Jerome H. Powell took office as a member of the Board of Governors of the Federal Reserve System on May 25, 2012, to fill an unexpired term. On November 2, 2017, President Donald Trump nominated Powell to serve as the next Chairman of the Federal Reserve. Powell assumed office as Chair on February 5, 2018.
Next release: Thu Sep 26, 2024 13:20
Frequency: Irregular
Consensus: –
Previous: –
Source: Federal Reserve
Later in the Wednesday session, new home sales will garner investor interest. Economists expect new home sales to slide by 5.1% in August after a 10.6% surge in July. A larger-than-expected decline may fuel concerns about the US economy.
Economists consider the US housing market a litmus test of the economy. Deteriorating housing market conditions may impact consumer confidence, private consumption, and the economy. A more marked decline in new home sales may push the USD/JPY pair toward the 142.5 level.
USD/JPY trends will hinge on central bank commentary and Friday’s Personal Income and Outlays Report. Dovish Fed comments, softer inflation, and weaker-than-expected personal income/spending may reignite concerns of a hard landing. Speculation about a US economic recession may drive Yen demand.
Investors should remain alert, with economic indicators and central bank commentary to dictate demand for the USD/JPY pair. Monitor real-time data, central bank views, and expert commentary to adjust your trading strategies accordingly. Stay ahead of the market with our expert insights.
The USD/JPY hovers well below the 50-day and 200-day EMAs, confirming bearish price trends.
A USD/JPY break above the 143.495 resistance level could support a move toward 145. Furthermore, a return to 145 may give the bulls a run at the 145.891 resistance level.
Bank of Japan commentary, US new home sales, and Fed chatter require consideration.
Conversely, a fall through 142.5 could bring the 141.032 support level into play.
The 14-day RSI at 44.10 suggests a USD/JPY drop to the 141.032 support level before entering oversold territory.
(MENAFN– Daily Forex) I believe that the EUR/GBP pair is worth watching due to the fact that we have absolutely collapsed at this point, and it looks like the market is likely to continue to see traders favor the British pound over the euro 0.84 level has been an area that a lot of people paid close attention to previously, and the fact that we have now sliced through it rather handily suggests that this pair has much further to go to the downside, itu0026rsquo;s probably worth noting that the bank of England chose to stand still as far as interest rates are concerned, and this is an obvious reaction to that. In general, this is a market that I think is going to start looking to the 0.83 level, which is a large, round, psychologically significant figure and an area that we have seen a lot of buyers in previously. If we break down through there, then itu0026rsquo;s likely that they absolute floor will fall apart, and we could see the EUR/GBP market just dropped drastically. Top Forex Brokers 1 Get Started 74% of retail CFD accounts lose money Read Review BrokerGeoLists({ type: u0027MobileTopBrokersu0027, id: u0027mobile-top-5u0027, size: 5, getStartedText: u0060Get Startedu0060, readReviewText: u0060Read Reviewu0060, Logo: u0027broker_carrousel_iu0027, Button: u0027broker_carrousel_nu0027, });Looking at this chartLooking at this chart, thereu0026rsquo;s absolutely nothing positive on it, with perhaps the lone exception of the 0.83 level being an area that some people may be looking for to bounce. However, we would have to break above the 50 Day EMA in order to see some type of turnaround and a push to the upside that allows the market to go looking to the 200 Day EMA. Ultimately, I think this is a market that is in freefall, and it is very likely that we will continue to see a lot of money flow out of the EUR and into the GBP. In general, I think this is a situation that will continue to see a lot of questions asked about the overall attitude of risk appetite and of course the idea of whether or not we are going to see the European Union finally turn around and strengthen, or if the fact that the ECB has cut a couple of times in the BOE hasnu0026rsquo;t bothered continue to push this market around
MENAFN24092024000131011023ID1108710549

Legal Disclaimer:
MENAFN provides the information “as is” without warranty of any kind. We do not accept any responsibility or liability for the accuracy, content, images, videos, licenses, completeness, legality, or reliability of the information contained in this article. If you have any complaints or copyright issues related to this article, kindly contact the provider above.
Most Read: China Slashes Rates – Stimulus Package by PBoC Welcomed by Markets
Gold prices continue to hold the high ground, underpinned by heightened tension in the Middle East and stimulus from China. The precious metal is enjoying its best year in 14 as a host of challenges and concerns plague market participants.
Gold continues to print fresh highs as geopolitical headwinds continue to sway back and forth. Earlier today we had a stimulus package announcement by the People’s Bank of China (PBoC) which has further aided the precious metal. As big as the stimulus package from China is, I do not believe it will hold a major sway on Gold prices but rather other metals in the sector.
Ongoing dovish comments from Federal Reserve officials only serve to add fuel to a fire which is already raging. Some policymakers have hinted at more aggressive cuts ahead which have underpinned gold prices to a degree overnight. The question regarding a lot of these events is how much of the premium is yet to be priced in given the current nature of the market.
As things stand, markets are pricing in another 50 bps cut from the Federal reserve at the November meeting.
Source: CME FedWatch Tool
ETF flows remain positive following a huge spike in July to 47.7 tonnes. August came in more modest at around 28.5 tonnes the equivalent to $2.1 USD. North America led the way with the Western markets more active at present.

Source: LSEG, World Gold Council
Despite the excellent inflows over the last four months the year-to-date losses remain around 44 metric tonnes. The idea is that if these inflows continue however, this could keep the gold rally moving in the upward direction. Economists and analysts continue to upgrade their yearly forecasts.
JP Morgan for its part stressed that the retail-focused ETF builds will be key for a sustainable gold rally, raising its price target for the precious metal to $2850/oz in 2025.

For all market-moving economic releases and events, see the MarketPulse Economic Calendar. (click to enlarge)
On the economic data front, we do have some high impact US data which could impact the US Dollar and thus gold prices. However, it would require the Core PCE data print to be extremely hot on Friday to see any lasting impact on the rate cut expectations from the Fed.
Despite comments from Fed policymaker Bowman today intimating that inflation risks remain this is a long shot and any uptick in inflation may just be a temporary reprieve for Gold prices on its march higher.
From a technical analysis standpoint, Gold is tough to read at the minute particularly where areas of resistance is concerned. As we continue to print fresh all time highs it makes it difficult due to the lack of historical price data to analyze.
To put things into perspective, the RSI on the daily, weekly and monthly timeframe are all in overbought territory. However, as we know an instrument can languish weeks and sometimes months in overbought territory on the larger timeframes so this seems to be irrelevant at present.
The psychological 2650 mark is the most immediate area i would keep an eye on as we may see a reaction or profit taking at this area. Market participants love whole numbers and when it comes to gold the ’50 and 75′ levels are always key.
Looking at support and the 2625 area has been key over the last two days serving as a base fro gold on the smaller timeframes as the precious metal advance toward the 2650 handle. This may be a level worth monitoring moving forward.
GOLD One-Hour (H1) Chart, September 24, 2024

Source: TradingView (click to enlarge)
Support
Resistance
Follow Zain on Twitter/X for Additional Market News and Insights @zvawda
Content is for general information purposes only. It is not investment advice or a solution to buy or sell securities. Opinions are the authors; not necessarily that of OANDA Business Information & Services, Inc. or any of its affiliates, subsidiaries, officers or directors. If you would like to reproduce or redistribute any of the content found on MarketPulse, an award winning forex, commodities and global indices analysis and news site service produced by OANDA Business Information & Services, Inc., please access the RSS feed or contact us at info@marketpulse.com. Visit https://www.marketpulse.com/ to find out more about the beat of the global markets. © 2023 OANDA Business Information & Services Inc.

He has spent the last 3 years in an analyst role honing his skills across various financial domains, including technical analysis, economic data interpretation, price action strategies, and analyzing the geopolitical impacts on global markets. Currently, Zain is advancing in obtaining his Capital Markets & Security Analyst (CMSA) designation through the Corporate Finance Institute (CFI), where he has completed modules in fixed income fundamentals, portfolio management fundamentals, equity market fundamentals, introduction to capital markets, and derivative fundamentals.
He is also a regular guest on radio and television programs in South Africa, providing insight into global markets and the economy. Additionally, he has contributed to the development of a financial markets course approved by BankSeta (Banking Sector Education and Training Authority) at NQF level 6 in South Africa.

A monthly bullish breakout and double bottom breakout on the weekly and daily charts triggered two weeks ago on a move above 2.30. There was a bit of a lag in the advance afterwards as the breakout was followed by six days of consolidation. On the sixth day natural gas fell to test support around the 200-Day MA (blue) and it found it. Price was rejected from the 200-Day line as buyers took back control leading to two strong days up, followed by today’s high.
Given the strong upward momentum that followed the double bottom breakout and remaining higher targets, it seems likely that natural gas will make another attempt at higher prices following a retracement or consolidation. Strength was recently confirmed by the 20-Day MA crossing above the 200-Day MA and the 50-Day MA has just begun to turn up.
Moreover, a bullish reversal triggered this month on the monthly chart, and strength was further confirmed on the subsequent advance to a three-month high as July’s high of 2.60 was exceeded. The double bottom pattern points to a potential target around 2.72. If that price level is exceeded, then natural gas has a chance to test resistance around the downtrend line. For now, the 78.6% retracement at 2.89 can be used as a proxy for the trendline.
Today’s high reached the top of a previously identified potential resistance zone from 2.65 to 2.67. Resistance was seen from the 61.8% Fibonacci retracement level at 2.67. Although a retracement to test support around the breakout level of 2.30, if bullish momentum is to stay strong a shallower retracement seems more likely. The 38.2% Fibonacci level is at 2.50, while the 50% retracement at 2.45 is joined with the prior swing high at 2.44.
For a look at all of today’s economic events, check out our economic calendar.
Important DisclaimersThe content provided on the website includes general news and publications, our personal analysis and opinions, and contents provided by third parties, which are intended for educational and research purposes only. It does not constitute, and should not be read as, any recommendation or advice to take any action whatsoever, including to make any investment or buy any product. When making any financial decision, you should perform your own due diligence checks, apply your own discretion and consult your competent advisors. The content of the website is not personally directed to you, and we does not take into account your financial situation or needs.The information contained in this website is not necessarily provided in real-time nor is it necessarily accurate. Prices provided herein may be provided by market makers and not by exchanges.Any trading or other financial decision you make shall be at your full responsibility, and you must not rely on any information provided through the website. FX Empire does not provide any warranty regarding any of the information contained in the website, and shall bear no responsibility for any trading losses you might incur as a result of using any information contained in the website.The website may include advertisements and other promotional contents, and FX Empire may receive compensation from third parties in connection with the content. FX Empire does not endorse any third party or recommends using any third party’s services, and does not assume responsibility for your use of any such third party’s website or services.FX Empire and its employees, officers, subsidiaries and associates, are not liable nor shall they be held liable for any loss or damage resulting from your use of the website or reliance on the information provided on this website.Risk DisclaimersThis website includes information about cryptocurrencies, contracts for difference (CFDs) and other financial instruments, and about brokers, exchanges and other entities trading in such instruments. Both cryptocurrencies and CFDs are complex instruments and come with a high risk of losing money. You should carefully consider whether you understand how these instruments work and whether you can afford to take the high risk of losing your money.FX Empire encourages you to perform your own research before making any investment decision, and to avoid investing in any financial instrument which you do not fully understand how it works and what are the risks involved.