The main category of Forex News.
You can use the search box below to find what you need.
[wd_asp id=1]
The main category of Forex News.
You can use the search box below to find what you need.
[wd_asp id=1]
Gold price is looking to build on its two-day uptrend in Asian trades on Monday even as the US Dollar (USD) attempts a tepid recovery alongside the US Treasury bond yields in the run-up to the global preliminary business PMI data.
Following the jumbo US Federal Reserve (Fed) interest rate cut-led subdued performance, the USD buyers ae trying their luck at the start of the new week, underpinned by escalating Middle East geopolitical tensions even as markets price in another 50 basis points (bps) Fed rate cut in November.
On Saturday night, Hezbollah fired at least 10 missiles into northern towns and cities of Israel’s Jezreel Valley, the Times of Israel reported. In response, Israeli jets carried out a series of retaliatory strikes across southern Lebanon, targetting at least 110 Hezbollah positions.
The Greenback also finds support from the US House Republicans’s announcement to unveil a stopgap spending bill to fund the government through December 20. The bill due to be voted on the House floor by mid-week.
The uptick in the US Treasury bond yields aids the US Dollar’s latest leg higher but the further upside depends upon the upcoming Euro are and US preliminary Manufacturing and Services PMI data.
Should the PMI reports rekindle recessionary fears worldwide, the US Dollar recovery could likely gain traction on increased safe-haven buying, triggering a fresh correction in the Gold price from record highs.
However, the downside in Gold price is likely to remain cushioned by the expectations of another 50 bps rate cut by the Fed and looming Middle East tensions. Further, hopes for more stimulus coming in from China after the People’s Bank of China’s surprise rate cut early Monday, could also render positive for Gold buyers.
China’s central bank surprised markets by lowering its 14-day repo rate by 10 bps to stimulate the economic recovery impeded by the manufacturing sector slowdown and the property market woes.
Gold price technical analysis: Daily chart
As observed on the daily chart, Gold price looks primed for a correction, as the 14-day Relative Strength Index (RSI) sits within the overbought territory, currently near 72.
If buyers manage to defy the bearish pressures, the $2,530 round level needs to be taken out decisively for further upside. Acceptance above that level will call for a test of the $2,650 psychological barrier, as buyers then target the $2,700 threshold for the first time ever.
On a corrective move lower, Gold price will test the previous day’s low of $2,585, below which the static support at around $2,550 will be challenged.
Depper correction could threaten the key support near $2,535, where the August 20 high and the 21-day Simple Moving Average (SMA) converge.
The S&P Global Manufacturing Purchasing Managers Index (PMI), released on a monthly basis, is a leading indicator gauging business activity in the US manufacturing sector. The data is derived from surveys of senior executives at private-sector companies from the manufacturing sector. Survey responses reflect the change, if any, in the current month compared to the previous month and can anticipate changing trends in official data series such as Gross Domestic Product (GDP), industrial production, employment and inflation. A reading above 50 indicates that the manufacturing economy is generally expanding, a bullish sign for the US Dollar (USD). Meanwhile, a reading below 50 signals that activity in the manufacturing sector is generally declining, which is seen as bearish for USD.
Next release: Mon Sep 23, 2024 13:45 (Prel)
Frequency: Monthly
Consensus: –
Previous: 47.9
Source: S&P Global
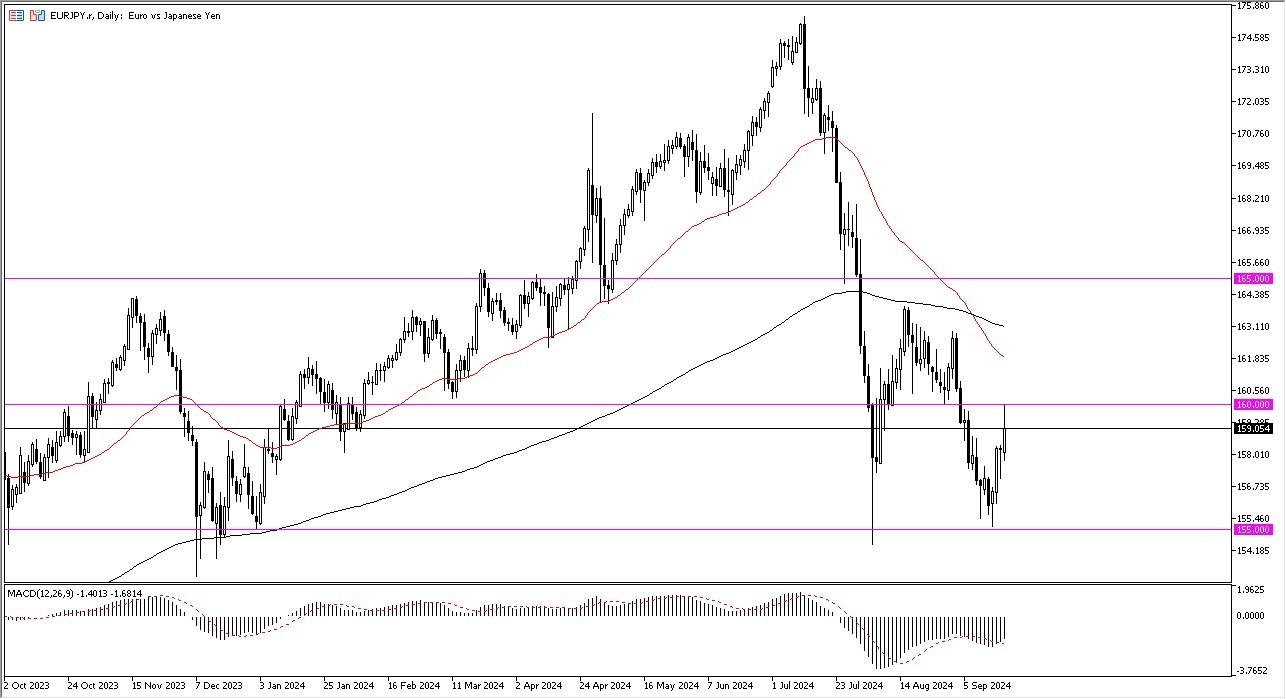
The euro has shot higher against the Japanese yen in early trading on Thursday to reach the 160 yen level. However, that area seems to have offered a bit of resistance. So I find it interesting that we have turned around and dropped pretty significantly from there. This tells me that perhaps traders are trying to go a little more risk on with the risk perhaps leaning towards higher yielding currencies due to the Fed cutting interest rates by 50 basis points. But you have to keep in mind Friday morning features the Bank of Japan and its latest interest rate decision.

Because of that, we may have jumped the gun. However, one thing that this move has set up is a pretty obvious potential trade, meaning that if we break above the 160 yen level, then I think you probably have more momentum entering the market. The MACD has shown itself to be in divergence from the actual price action, so that might be something worth paying attention to as well as it could be a hint that we are in fact bottoming, which would make a certain amount of sense considering we dropped 20 handles at one point. That is a huge move in the currency over the course of an entire year, let alone just a few months.
So, with that being said, it does make sense that we rally mainly just if for no other reason, then those who sold short will eventually want to take profit. But also, if we do have a little bit more risk coming into the picture, or if the Bank of Japan sounds dovish again on Friday, that could very well end up being a sign that the yen has peaked, and other currencies are going to turn around and start taking off against it.
Ready to trade our daily forex signals? Here are the best forex brokers in Japan to choose from.
December arabica coffee (KCZ24) today is down -12.40 (-4.74%), and November ICE robusta coffee (RMX24) is down -208 (-3.96%).
Coffee prices today sold off sharply as forecasts for rain in Brazil have sparked fund liquidation of coffee futures. The two-week Global Forecast System model shows rain moving into Brazil’s coffee-growing regions next week during the all-important flowering period for Brazil’s coffee trees.
A supportive factor for coffee was Thursday’s action by Conab, Brazil’s crop forecasting agency, to cut its 2024 Brazil coffee production forecast to 54.8 million bags from 58.8 million bags forecast in May.
On Monday, Dec arabica and Nov robusta posted contract highs, while nearest-futures (U24) robusta posted a new all-time high. Coffee prices have rallied sharply over the past week as adverse global weather events threaten coffee production. Brazil has been facing the driest weather since 1981, according to the natural disaster monitoring center Cemaden. Rainfall in Brazil has consistently been below normal since April, damaging coffee trees during the all-important flowering stage and reducing the prospects for Brazil’s 2025/26 arabica coffee crop. Somar Meteorologia reported Monday that Brazil’s Minas Gerais region received no rain over the past week. Minas Gerais accounts for about 30% of Brazil’s arabica crop. Also, robusta coffee has support after heavy rain from typhoon Yagi may have damaged Vietnam’s robusta coffee fields.
Robusta coffee prices are underpinned by fears that excessive dryness in Vietnam will damage coffee crops and curb future global robusta production. Vietnam’s agriculture department said on March 26 that Vietnam’s coffee production in the 2023/24 crop year dropped by -20% to 1.472 MMT, the smallest crop in four years, due to drought. The USDA FAS on May 31 projected that Vietnam’s robusta coffee production in the new marketing year of 2024/25 will dip slightly to 27.9 million bags from 28 million bags in the 2023/24 season. Last Wednesday, the General Department of Vietnam Customs reported that Vietnam’s August coffee exports fell -9.9% y/y to 76,214 MT and that Vietnam’s Jan-Aug coffee exports fell -12.1% y/y to 1.06 MMT.
Last Tuesday, Cecafe reported that Brazil’s Aug green coffee exports rose +1.4% y/y to 3.41 million bags. The rise in Brazil’s green coffee exports was consistent with other recent news showing higher exports. The Brazilian Trade Ministry reported on August 7 that Brazil’s July coffee exports rose +44% y/y to 202,000 MT. Also, Cecafe reported on July 11 that Brazil’s 2023/24 coffee exports rose +33% y/y to a record 47.3 million bags. On a global basis, the International Coffee Organization (ICO) reported on September 6 that global coffee exports rose +12.2% y/y in July to 11.29 million bags and that global exports during Oct-July rose +10.5% y/y to 115.01 million bags.
A rebound in ICE coffee inventories from historically low levels is negative for prices. Last Thursday, ICE-monitored arabica coffee inventories rose to a 1-1/2 year high of 858,474 bags, up from the 24-year low of 224,066 bags posted in November 2023. Also, ICE-monitored robusta coffee inventories on July 25 rose to a 1-year high of 6,521 lots, up from the record low of 1,958 lots posted in February 2024.
In a bearish factor, the International Coffee Organization (ICO) said on May 3 that 2023/24 global coffee production climbed +5.8% y/y to 178 million bags due to an exceptional off-biennial crop year. ICO also said global 2023/24 coffee consumption rose +2.2% y/y to 177 million bags, resulting in a 1 million bag coffee surplus.
The USDA’s bi-annual report on June 20 was bearish for coffee prices. The USDA’s Foreign Agriculture Service (FAS) projected that world coffee production in 2024/25 will increase +4.2% y/y to 176.235 million bags, with a +4.4% increase in arabica production to 99.855 million bags and a +3.9% increase in robusta production to 76.38 million bags. The USDA’s FAS forecasts that 2024/25 ending stocks will climb by +7.7% to 25.78 million bags from 23.93 million bags in 2023/24. The USDA’s FAS projects that Brazil’s 2024/25 arabica production would climb +7.3% y/y to 48.2 mln bags due to higher yields and increased planted acreage. The USDA’s FAS also forecasts that 2024/54 coffee production in Colombia, the world’s second-largest arabica producer, will climb +1.6% y/y to 12.4 mln bags.
More Coffee News from Barchart
On the date of publication,
did not have (either directly or indirectly) positions in any of the securities mentioned in this article. All information and data in this article is solely for informational purposes. For more information please view the Barchart Disclosure Policy
here.
The views and opinions expressed herein are the views and opinions of the author and do not necessarily reflect those of Nasdaq, Inc.
Can the US dollar hold range support in the week ahead, or will we finally see it capitulate?
Check out today’s Weekly Forex Forecast to see how I’m trading the DXY, EURUSD, GBPUSD, USDJPY, and USDCHF for the week ending September 27, 2024.
The DXY is holding above key support at 100.60, but just barely.
Thursday’s candle wasn’t very convincing for dollar bulls, and today’s session is once again pushing on that critical support level.
A sustained break below 100.60 will open up the confluence of support at 99.60.
Alternatively, a bounce from 100.60 would keep the range intact.
However, the DXY would have to reclaim 102.60 from here to turn constructive toward higher targets.
Until then, I’ll approach this as a range unless 100.60 fails in the coming days.
EURUSD is flirting with a bullish breakout above 1.1140 today as the DXY struggles to bounce from support.
A weekly close above 1.1140 would expose the August highs and potentially the 2023 high at 1.1275.
Alternatively, a close below 1.1140 would keep the area intact as resistance as we move into next week.

GBPUSD is also pushing higher today on USD weakness.
We saw last week close above the 1.3100 key level, so this week’s rally isn’t too surprising.
A DXY sustained break below 100.60 could send GBPUSD to the confluence of resistance near 1.3480.
That’s a descending trend line that goes back years and a key horizontal level from 2019 to 2020.
Key support for GBPUSD comes in between 1.3230 and 1.3260 next week.

USDJPY is recovering a bit this week on a weaker Japanese yen.
However, USDJPY bulls are struggling with the 144.00 resistance area, leaving it intact as key resistance next week.
It will take a sustained break above 144.00 on the daily and weekly time frames to flip the area to support and expose 146.00.
Until then, USDJPY is capped by resistance and range-bound between 144.00 and 142.00 support.

USDCHF is trading at monthly support in the 0.8350 region.
That’s the bottom of a range that the USDCHF has traded in since mid-2023.
However, the US dollar has work to do to show strength against other currency pairs, including the Swiss franc.
One level I’d like to see recovered before looking for longs is 0.8570.
That’s the level which triggered the early 2024 rally, and one that could do the same, but only if the DXY can hold above 100.60 and reclaim 101.00 next week.
Otherwise, we could see USDCHF sweep the late 2023 low before bottoming.

The Pound Sterling registered minimal gains versus the US Dollar during the North American session after reaching a two-and-a-half-year high of 1.3340 on an upbeat retail sales report in the UK. At the time of writing, the GBP/USD trades at 1.3282, a gain of 0.03%.
From a technical standpoint, the GBP/USD clashed with solid resistance as the pair reached the top of an ascending channel shy of testing 1.3350. Since then, the pair erased those gains, about to form a ‘shooting star’ candle, which opens the door for further losses.
Momentum remains bullish according to the Relative Strength Index (RSI). However, a negative divergence looms, which could spur a pullback in the pair.
If GBP/USD tumbles below 1.3250, further downside is seen. Once cleared, the next stop would be the September 6 peak at 1.3239, ahead of 1.3200. If surpassed, key support levels will be exposed, like the July 14, 2023, peak at 1.3142, followed by the September 11 low of 1.3001.
Conversely, if GBP/USD reclaims 1.3300, the first resistance would be the year-to-date (YTD) high of 1.3340 ahead of the March 1, 2022, pivot high at 1.3437.
The table below shows the percentage change of British Pound (GBP) against listed major currencies today. British Pound was the strongest against the Japanese Yen.
| USD | EUR | GBP | JPY | CAD | AUD | NZD | CHF | |
|---|---|---|---|---|---|---|---|---|
| USD | 0.20% | 0.10% | 1.21% | 0.19% | 0.45% | 0.40% | 0.39% | |
| EUR | -0.20% | -0.11% | 1.05% | -0.03% | 0.23% | 0.21% | 0.20% | |
| GBP | -0.10% | 0.11% | 1.15% | 0.10% | 0.36% | 0.33% | 0.32% | |
| JPY | -1.21% | -1.05% | -1.15% | -1.01% | -0.77% | -0.81% | -0.80% | |
| CAD | -0.19% | 0.03% | -0.10% | 1.01% | 0.25% | 0.22% | 0.22% | |
| AUD | -0.45% | -0.23% | -0.36% | 0.77% | -0.25% | -0.01% | -0.02% | |
| NZD | -0.40% | -0.21% | -0.33% | 0.81% | -0.22% | 0.01% | -0.00% | |
| CHF | -0.39% | -0.20% | -0.32% | 0.80% | -0.22% | 0.02% | 0.00% |
The heat map shows percentage changes of major currencies against each other. The base currency is picked from the left column, while the quote currency is picked from the top row. For example, if you pick the British Pound from the left column and move along the horizontal line to the US Dollar, the percentage change displayed in the box will represent GBP (base)/USD (quote).
The next higher target zone runs from 2.52 to 2.54 and includes the 50% retracement and the completion of a rising ABCD, respectively. Given the improvement in bullish momentum this next target zone could be reached quickly. Notice the wide range yesterday with a close near the highs, and a similar one-day dynamic today. Keep an eye on the rise in the 20-Day MA as it is close to crossing above the slower moving 200-Day MA, now at 2.23. That would provide an additional sign that demand is improving.
Further up is a target zone from 2.65 to 2.67. It correlates with an old trendline rising from the April 2023 swing low. The 2.65 price level is the 127.2% extended target for the rising ABCD pattern that is on the chart, and 2.67 is the completion of a 61.8% Fibonacci retracement.
Natural gas broke out of a double pattern on a move above 2.30 last Wednesday, and it is now showing signs that it is ready to follow through to the upside. The advance also triggered a breakout on the higher time frame monthly chart. This is significant as all higher time frames (daily, weekly, monthly) are bullish. The next monthly target is 2.60, the peak from July.
For a look at all of today’s economic events, check out our economic calendar.
The USD/JPY registers gain for back-to-back days, yet it remains shy of decisively cracking the 144.00 figure despite registering a weekly high of 144.49. At the time of writing, the pair exchanged hands at 143.96, up by 0.93%.
The pair is set to end the week positively, but the downtrend remains. The USD/JPY has failed to reclaim the Kijun-Sen at 144.46, and price action remains below the Ichimoku Cloud (Kumo).
In fact, the trend could accelerate as the 50-day moving average (DMA) crosses below the 100 and 200-DMAs, with the former closing the gap with the latter.
Momentum favors buyers as the Relative Strength Index (RSI) aims upward. However, it remains far from testing the 60 level, which is usually sought as a crucial break to change the USD/JPY ongoing downtrend.
Short-term, the USD/JPY could extend its gains, with the Kijun-Sen seen as first resistance at 144.40. A breach of the latter will expose the 145.00 figure, followed by the September 3 high at 147.21, followed by the 50-DMA at 147.56.
Conversely, if USD/JPY extends its losses past the 143.00 figure, the next support would be the Tenkan-Sen at 142.04.
The table below shows the percentage change of Japanese Yen (JPY) against listed major currencies today. Japanese Yen was the strongest against the Swiss Franc.
| USD | EUR | GBP | JPY | CAD | AUD | NZD | CHF | |
|---|---|---|---|---|---|---|---|---|
| USD | 0.02% | -0.23% | 0.95% | 0.07% | 0.13% | -0.02% | 0.31% | |
| EUR | -0.02% | -0.26% | 0.95% | 0.03% | 0.10% | -0.03% | 0.29% | |
| GBP | 0.23% | 0.26% | 1.21% | 0.31% | 0.38% | 0.24% | 0.58% | |
| JPY | -0.95% | -0.95% | -1.21% | -0.86% | -0.82% | -0.96% | -0.61% | |
| CAD | -0.07% | -0.03% | -0.31% | 0.86% | 0.05% | -0.08% | 0.26% | |
| AUD | -0.13% | -0.10% | -0.38% | 0.82% | -0.05% | -0.12% | 0.22% | |
| NZD | 0.02% | 0.03% | -0.24% | 0.96% | 0.08% | 0.12% | 0.34% | |
| CHF | -0.31% | -0.29% | -0.58% | 0.61% | -0.26% | -0.22% | -0.34% |
The heat map shows percentage changes of major currencies against each other. The base currency is picked from the left column, while the quote currency is picked from the top row. For example, if you pick the Japanese Yen from the left column and move along the horizontal line to the US Dollar, the percentage change displayed in the box will represent JPY (base)/USD (quote).
The GBP/JPY cross turns positive for the fifth successive day following an intraday dip to the 188.70 area and jumps to a nearly three-week top during the first half of the European session on Friday. Spot prices reclaim the 191.00 mark in the last hour amid the emergence of some selling around the Japanese Yen (JPY), triggered by the Bank of Japan (BoJ) Governor Kazuo Ueda’s less hawkish remarks during the post-meeting press conference.
In fact, Ueda noted that uncertainties surrounding Japan’s economy, and prices remain high and that risks of inflation overshoot have diminished to some extent in the wake of the recent FX moves. This, along with the underlying bullish sentiment across the global financial markets, undermines the safe-haven JPY. Meanwhile, the British Pound (GBP) draws support from the Bank of England’s (BoE) decision on Thursday to keep rates unchanged and run down its stock of government bonds by another £100 billion over the coming 12 months. This, in turn, provides an additional boost to the GBP/JPY cross and contributes to the move up.
From a technical perspective, oscillators on the daily chart have been gaining positive traction and support prospects for a further appreciating move. That said, the 50-day Simple Moving Average (SMA) has fallen below the 200-day SMA, forming the ‘Death Cross’ pattern on the daily chart and warranting some caution for bullish traders. Hence, any subsequent move up might confront stiff resistance near the 50-day SMA, currently near the 191.75 region. This is followed by the 192.00 mark, above which the GBP/JPY cross could climb further, though is likely to remain capped near the 200-day SMA barrier near the 192.35-192.40 region.
On the flip side, the 190.40-190.35 zone now seems to protect the immediate downside ahead of the 190.00 psychological mark and the 189.45 horizontal support. Some follow-through selling could drag the GBP/JPY cross towards the 189.00 mark en route to the daily swing low, around the 188.70-188.65 region. Failure to defend the said support levels will suggest that this week’s goodish rebound from the vicinity of the monthly low has run its course and pave the way for deeper losses. Spot prices might then accelerate the fall towards the 188.00 round figure before eventually dropping to the 187.35 support zone and the 187.00 mark.
The Bank of Japan (BoJ) holds a press conference at the end of each one of its eight scheduled policy meetings. At the press conference the Governor of the BoJ communicates with media representatives and investors regarding monetary policy. The Governor talks about the factors that affect the most recent interest rate decision, the overall economic outlook, inflation, and clues regarding future monetary policy. Hawkish comments tend to boost the Japanese Yen (JPY), while a dovish message tends to weaken it.
Last release: Fri Sep 20, 2024 06:00
Frequency: Irregular
Actual: –
Consensus: –
Previous: –
Source: Bank of Japan
The Pound Sterling (GBP) extended its hold against the US Dollar (USD) after the previous week’s resurgence, as the GBP/USD pair tapped the highest level since March 2022 above 1.3300.
The bullish potential remained intact for the GBP/USD pair, as the Pound Sterling capitalized on the monetary policy divergence between the Bank of England (BoE) and the US Federal Reserve (Fed), underscored in the central banks’ bonanza week.
The Fed opted for a 50 basis points (bps) interest rate cut on Wednesday, bringing the fed funds rate to the range of 4.75%-5.0%. The Summary of Economic Projections, the so-called Dot Plot chart, suggested a total of 100 bps of rate cuts for this year and the next.
In contrast, the BoE decided to leave the policy rate on hold at 5.0% on Thursday, as Governor Andrew Bailey warned that policymakers “need to be careful not to cut too fast or by too much”.
The central banks’ imbalances added extra legs to the uptrend in the pair, driving it to a new 30-month top at 1.3315 on Thursday. Buyers remained in control heading into the weekend, despite deteriorating risk sentiment amid renewed concerns over China’s economic slowdown.
In the early part of the week, GBP/USD largely held onto its recovery mode at around 1.3200, as traders preferred to stay on the sidelines, refraining from placing any directional bets on the major heading into the central banks’ decisions.
Tuesday’s US Retail Sales data came in strong and briefly lifted the sentiment around the USD on ‘soft-landing’ optimism but that quickly changed on the Fed verdict. Retail Sales increased 0.1% last month after an upwardly revised 1.1% surge in July, the US Commerce Department’s Census Bureau said.
Meanwhile, data published by the Office of National Statistics (ONS) on Friday showed that Retail Sales in the UK increased by 1.0% over the month in August after rebounding 0.5% in July. Data beat the expected 0.4% growth in the reported month.
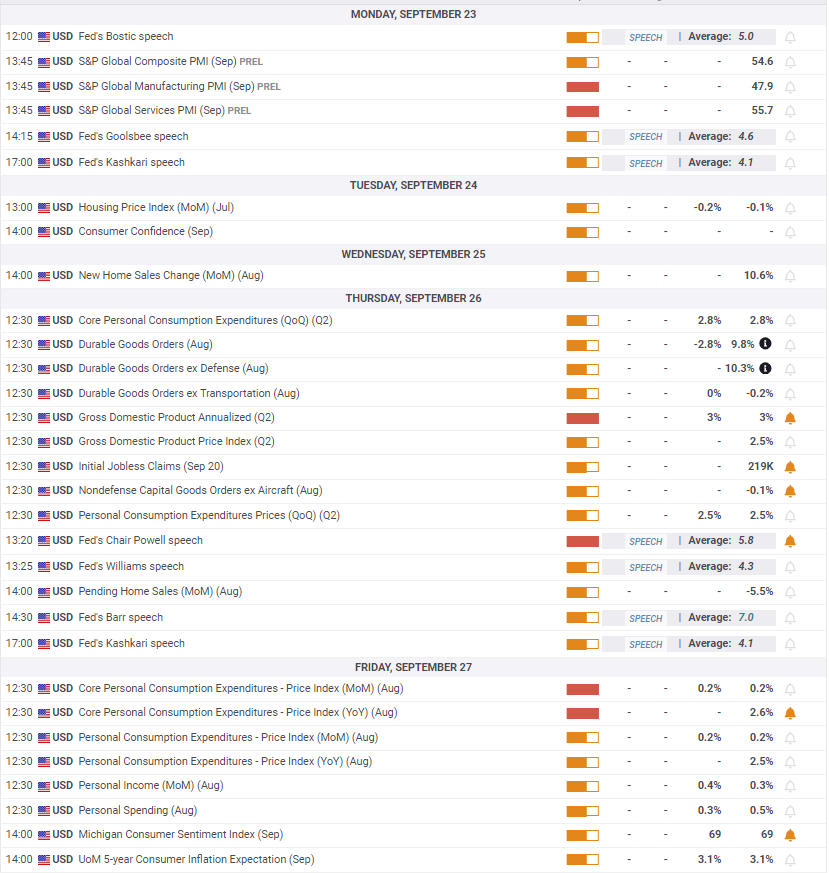
With the Fed and BoE policy decisions out of the way, the focus now shifts to the global business PMI data and the US Personal Consumption Expenditures (PCE) inflation data due in the week ahead.
It’s a busy start to the week, with the S&P Global preliminary Manufacturing and Services PMI data dropping in from the UK and the US on Monday. Tuesday and Wednesday are relatively quiet, as only the US Conference Board Consumer Confidence data and US New Home Sales will be released, respectively.
On Thursday, the US calendar will feature the final revision to the second quarter Gross Domestic Product (GDP) alongside the Durable Goods and Jobless Claims data. The main focus that day, however, will be on Fed Chair Jerome Powell’s opening remarks at the US Treasury Market Conference, in New York.
Traders will closely scrutinize his speech heading into the US core PCE Price Index data due on Friday.
Apart from the macro data releases, speeches from several Fed policymakers and the Middle East geopolitical developments could also emerge as the market-moving drivers.
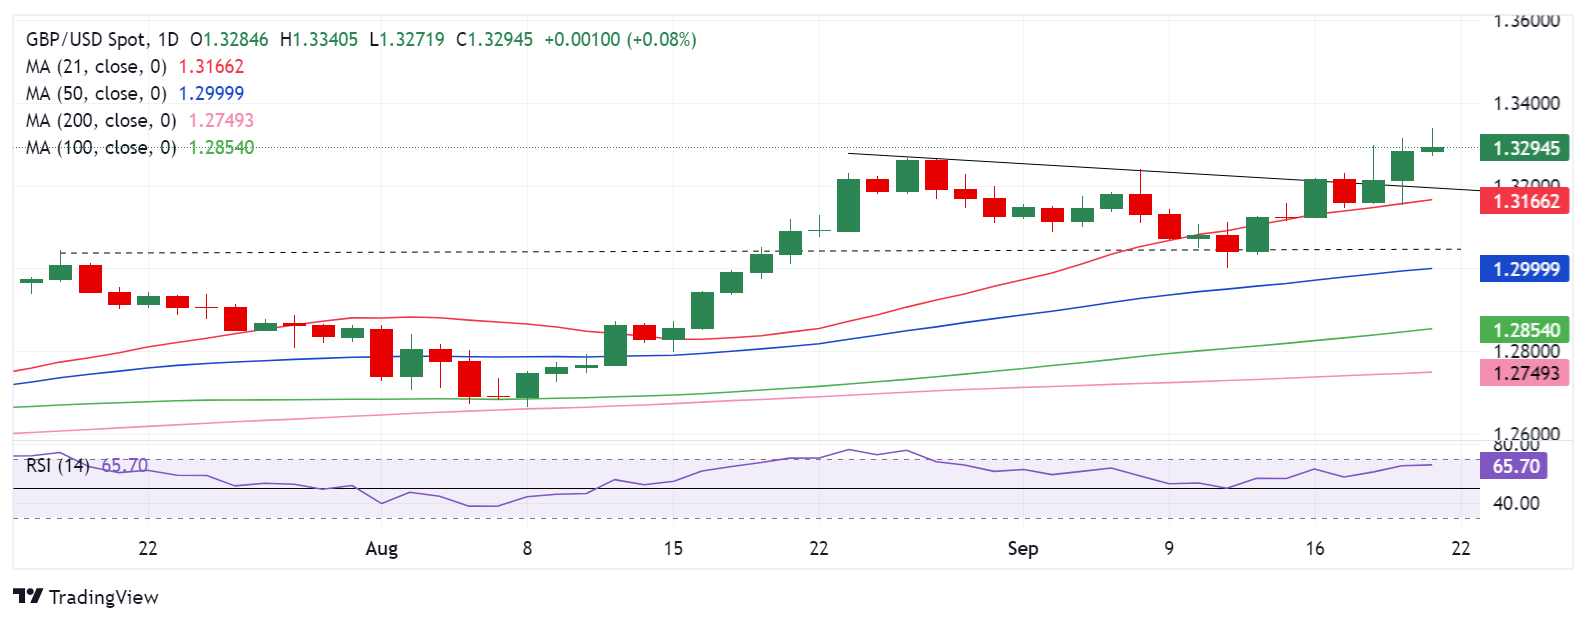
As observed on the daily chart, the GBP/USD pair settled Wednesday above the falling trendline resistance, then at 1.3199, yielding a technical breakout.
Since then, buyers have retained control, with the 14-day Relative Strength Index (RSI) holding comfortably above the 50 level, currently near 65.50, justifying the bullish outlook.
Further upside, however, needs acceptance above the 1.3300 level on a daily closing basis. If that materializes, the next topside barrier is seen at 1.3350 before fresh buying opportunities emerge, calling for a test of the 1.3400 threshold.
Alternatively, any pullback could meet initial demand at the falling trendline resistance now turned support at 1.3195, below which the 21-day Simple Moving Average (SMA) at 1.3166 will be challenged.
Should sellers manage to find a strong foothold below that level, a fresh downtrend is likely to initiate toward the July 17 high of 1.3045.
The 100-day SMA at 1.3000 will be the line in the sand for Pound Sterling buyers.
The USD/JPY price analysis shows the yen crashing after the Bank of Japan policy meeting. Although the central bank held rates as expected, Governor Ueda refrained from giving clear guidance on rate hikes. Instead, he focused on the economy.
–Are you interested in learning more about making money with forex? Check our detailed guide-
Japan’s central bank met on Friday and decided to keep interest rates unchanged. Moreover, the central bank’s forecasts showed that consumption in Japan’s economy would increase. Such an outlook favors rate hike expectations as policymakers will be more willing to hike when demand is high.
However, Governor Ueda’s speech after the meeting contained little on future rate hikes. He kept from giving clear signals on rate hikes, which disappointed investors who had expected more hawkish remarks. Ueda noted that future decisions would depend on the economy, which was a cautious statement.
Meanwhile, the Fed has started its rate-cutting cycle aggressively. The US Central Bank lowered borrowing costs by 50-bps on Wednesday, shrinking the gap in interest rates between Japan and the US. Moreover, Powell’s speech indicated confidence that the fight against inflation was successful. Therefore, there will be more rate cuts in the future.
Although the yen collapsed on Friday, the future is bright. Lower interest rates in the US will continue to reduce the interest rate differentials between the two countries, weakening the popularity of the carry trade. At the same time, economists expect at least one more rate hike this year in Japan, which could boost the yen.
Investors will continue digesting the outcome of the Bank of Japan policy meeting, as there will be no other key economic releases.
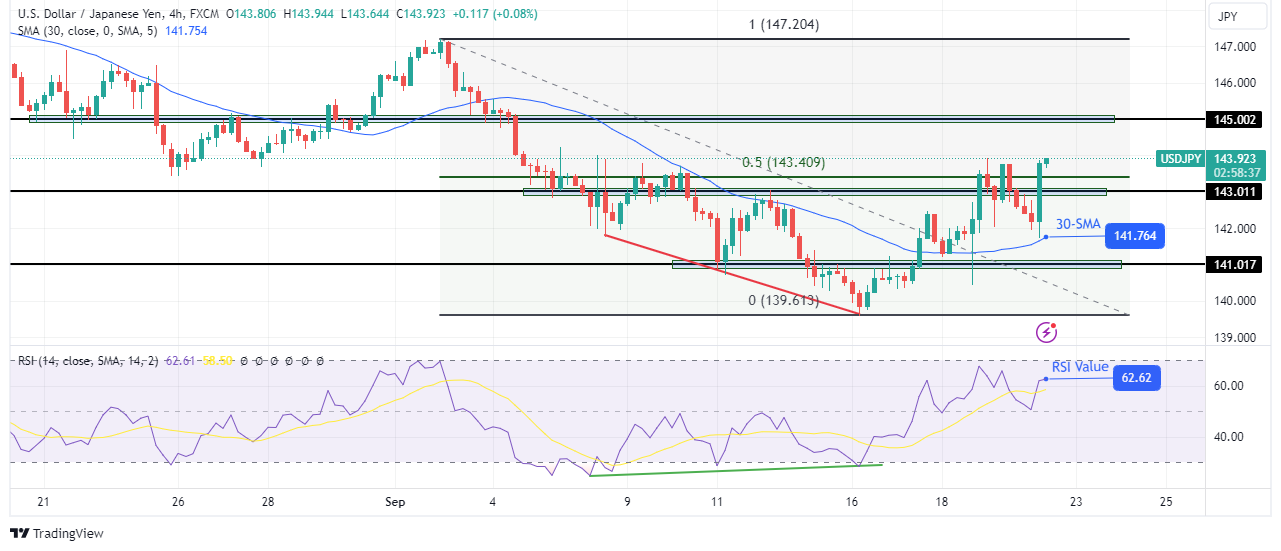
On the technical side, the USD/JPY price broke above a solid resistance zone with a bullish engulfing candle. Initially, the price paused at the 0.5 Fib level, where bears triggered a pullback to the 30-SMA. However, the price stayed above the SMA and the RSI above 50, retaining the bullish bias.
–Are you interested in learning more about MT5 brokers? Check our detailed guide-
Soon after, bulls returned with massive strength and pushed above the 143.01 resistance and the 0.5 Fib. The bullish engulfing candle closed above these levels, showing a clear break. The price is now aiming for the next hurdle at the 145.00 level.
Looking to trade forex now? Invest at eToro!
68% of retail investor accounts lose money when trading CFDs with this provider. You should consider whether you can afford to take the high risk of losing your money.