The main category of Forex News.
You can use the search box below to find what you need.
[wd_asp id=1]
The main category of Forex News.
You can use the search box below to find what you need.
[wd_asp id=1]
Gold price is looking to build on the previous day’s rebound early Friday, consolidating weekly gains amid the overnight weakness in the US Dollar (USD) alongside the US Treasury bond yields. Traders now await the speeches from US Federal Reserve (Fed) monetary policymakers for fresh hints on the central bank’s path forward on interest rates.
Gold price takes a breather, with Fedspeak eyed
The USD has paused its recent downside, as markets turn risk-averse and buck the Wall Street rally after the People’s Bank of China (PBOC) disappointed by leaving the mortgage lending rate unchanged. Markets expected the Chinese central bank to cut the Loan Prime Rates (LPR) amid growing economic slowdown concerns.
A stabilizing US Dollar seems to caution Gold buyers but the downside remains cushioned amid increased haven demand for the traditional safety asset on China worries. They also remain wary and refrain from placing fresh bets, anticipating the Bank of Japan’s (BoJ) policy announcements.
Although the BoJ is widely expected to leave interest rates unchanged, any surprise could trigger the USD/JPY pair-led US Dollar volatility, eventually impacting the USD-denominated Gold price.
That said, Gold price could witness a brief correction, if traders resort to profit-taking due to the recent rally and ahead of next week’s US macro data and Fed Chair Jerome Powell’s appearance.
On Thursday, the bright metal staged a solid rebound toward the all-time high of $2,600 but fell slightly short of it amid the two-way swings seen in the US Dollar, as traders digested the dovish Fed outlook amid the return of risk appetite and mixed US Jobless Claims and Existing Home Sales data.
As observed on the daily chart, the Gold price outlook appears constructive in the short term as long as the crucial support at $2,532 is defended.
That level is the confluence of the August 20 high and the 21-day Simple Moving Average (SMA).
The 14-day Relative Strength Index (RSI) has turned flat while staying firm above the 50 level, currently near 66.50, adding credence to the bullish potential.
The record high at $2,600 will be challenged if Gold price regains the upside traction. Acceptance above that level will call for a test of the $2,650 psychological barrier.
On the downside, Gold sellers need to crack the $2,550 demand area for the correction to extend toward the abovementioned key support at $2,532.
A sustained break below that level will likely extend the decline toward the rising trendline support at $2,512.
Gold has played a key role in human’s history as it has been widely used as a store of value and medium of exchange. Currently, apart from its shine and usage for jewelry, the precious metal is widely seen as a safe-haven asset, meaning that it is considered a good investment during turbulent times. Gold is also widely seen as a hedge against inflation and against depreciating currencies as it doesn’t rely on any specific issuer or government.
Central banks are the biggest Gold holders. In their aim to support their currencies in turbulent times, central banks tend to diversify their reserves and buy Gold to improve the perceived strength of the economy and the currency. High Gold reserves can be a source of trust for a country’s solvency. Central banks added 1,136 tonnes of Gold worth around $70 billion to their reserves in 2022, according to data from the World Gold Council. This is the highest yearly purchase since records began. Central banks from emerging economies such as China, India and Turkey are quickly increasing their Gold reserves.
Gold has an inverse correlation with the US Dollar and US Treasuries, which are both major reserve and safe-haven assets. When the Dollar depreciates, Gold tends to rise, enabling investors and central banks to diversify their assets in turbulent times. Gold is also inversely correlated with risk assets. A rally in the stock market tends to weaken Gold price, while sell-offs in riskier markets tend to favor the precious metal.
The price can move due to a wide range of factors. Geopolitical instability or fears of a deep recession can quickly make Gold price escalate due to its safe-haven status. As a yield-less asset, Gold tends to rise with lower interest rates, while higher cost of money usually weighs down on the yellow metal. Still, most moves depend on how the US Dollar (USD) behaves as the asset is priced in dollars (XAU/USD). A strong Dollar tends to keep the price of Gold controlled, whereas a weaker Dollar is likely to push Gold prices up.
EUR/USD gathered bullish momentum and gained 0.4% on Thursday. The pair holds its ground and trades modestly higher on the day above 1.1150 in the European morning on Friday.
The table below shows the percentage change of Euro (EUR) against listed major currencies this week. Euro was the strongest against the Japanese Yen.
| USD | EUR | GBP | JPY | CAD | AUD | NZD | CHF | |
|---|---|---|---|---|---|---|---|---|
| USD | -0.88% | -1.48% | 1.15% | -0.28% | -1.76% | -1.51% | -0.21% | |
| EUR | 0.88% | -0.66% | 2.12% | 0.57% | -0.95% | -0.68% | 0.63% | |
| GBP | 1.48% | 0.66% | 2.72% | 1.22% | -0.30% | -0.01% | 1.31% | |
| JPY | -1.15% | -2.12% | -2.72% | -1.47% | -2.88% | -2.66% | -1.47% | |
| CAD | 0.28% | -0.57% | -1.22% | 1.47% | -1.56% | -1.22% | -0.03% | |
| AUD | 1.76% | 0.95% | 0.30% | 2.88% | 1.56% | 0.28% | 1.59% | |
| NZD | 1.51% | 0.68% | 0.01% | 2.66% | 1.22% | -0.28% | 1.31% | |
| CHF | 0.21% | -0.63% | -1.31% | 1.47% | 0.03% | -1.59% | -1.31% |
The heat map shows percentage changes of major currencies against each other. The base currency is picked from the left column, while the quote currency is picked from the top row. For example, if you pick the Euro from the left column and move along the horizontal line to the US Dollar, the percentage change displayed in the box will represent EUR (base)/USD (quote).
The US Dollar (USD) staged a short-lasting rebound in the early American session on Thursday after the data published by the US Department of Labor showed that the weekly Initial Jobless Claims declined to 219,000 from 231,000. With risk flows dominating the action in the financial markets, however, the USD came under renewed bearish pressure later in the session, allowing EUR/USD to stretch higher.
The US economic calendar will not feature any high-tier data releases on Friday. Later in the day, Federal Reserve Bank of Philadelphia President Patrick Harker, a non-voting member of the FOMC, will be delivering a speech. Additionally, European Central Bank (ECB) President Christine Lagarde will speak at the 2024 Michel Camdessus Central Banking Lecture.
Several ECB policymakers voiced their willingness to wait until December to have more data to assess before lowering the policy rate again. Although it’s very unlikely, the Euro could weaken against its rivals in case Lagarde leaves the door open for a rate reduction in October.
Meanwhile, US stock index futures trade marginally lower on the day after Wall Street’s main indexes registered impressive gains on Thursday. A continuation of the risk rally in the second half of the day could further weigh on the USD and help EUR/USD push higher heading into the weekend.
The Relative Strength Index (RSI) indicator on the 4-hour chart stays near 70, suggesting that EUR/USD’s bullish bias remains unchanged, with a possibility of a technical correction in the near term.
First resistance could be spotted at 1.1200 (static level, end-point of the uptrend, 2024-high) before 1.1275 (July 18, 2023, high) and 1.1300 (round level). On the downside, 1.1135 (20-period Simple Moving Average) aligns as interim support ahead of 1.1100 (Fibonacci 23.6% retracement) and 1.1080 (100-period Simple Moving Average).
The Euro is the currency for the 20 European Union countries that belong to the Eurozone. It is the second most heavily traded currency in the world behind the US Dollar. In 2022, it accounted for 31% of all foreign exchange transactions, with an average daily turnover of over $2.2 trillion a day. EUR/USD is the most heavily traded currency pair in the world, accounting for an estimated 30% off all transactions, followed by EUR/JPY (4%), EUR/GBP (3%) and EUR/AUD (2%).
The European Central Bank (ECB) in Frankfurt, Germany, is the reserve bank for the Eurozone. The ECB sets interest rates and manages monetary policy. The ECB’s primary mandate is to maintain price stability, which means either controlling inflation or stimulating growth. Its primary tool is the raising or lowering of interest rates. Relatively high interest rates – or the expectation of higher rates – will usually benefit the Euro and vice versa. The ECB Governing Council makes monetary policy decisions at meetings held eight times a year. Decisions are made by heads of the Eurozone national banks and six permanent members, including the President of the ECB, Christine Lagarde.
Eurozone inflation data, measured by the Harmonized Index of Consumer Prices (HICP), is an important econometric for the Euro. If inflation rises more than expected, especially if above the ECB’s 2% target, it obliges the ECB to raise interest rates to bring it back under control. Relatively high interest rates compared to its counterparts will usually benefit the Euro, as it makes the region more attractive as a place for global investors to park their money.
Data releases gauge the health of the economy and can impact on the Euro. Indicators such as GDP, Manufacturing and Services PMIs, employment, and consumer sentiment surveys can all influence the direction of the single currency. A strong economy is good for the Euro. Not only does it attract more foreign investment but it may encourage the ECB to put up interest rates, which will directly strengthen the Euro. Otherwise, if economic data is weak, the Euro is likely to fall. Economic data for the four largest economies in the euro area (Germany, France, Italy and Spain) are especially significant, as they account for 75% of the Eurozone’s economy.
Another significant data release for the Euro is the Trade Balance. This indicator measures the difference between what a country earns from its exports and what it spends on imports over a given period. If a country produces highly sought after exports then its currency will gain in value purely from the extra demand created from foreign buyers seeking to purchase these goods. Therefore, a positive net Trade Balance strengthens a currency and vice versa for a negative balance.
Silver (XAG/USD) attracts buyers for the second straight day on Friday and sticks to its gains above the $31.00 mark, near a two-month peak through the first half of the European session.
From a technical perspective, the recent breakout through a short-term descending trend-line resistance, around the $29.35 area, which coincided with the 100-day Simple Moving Average (SMA), was seen as a fresh trigger for bullish traders. Adding to this, the emergence of some dip-buying on Thursday, along with positive oscillators on the daily chart, suggest that the path of least resistance for the XAG/USD is to the upside.
The positive outlook is validated by the fact that the white metal now seems to have found acceptance above the $31.00 mark. Hence, a subsequent move up beyond the $31.45 intermediate hurdle, en route to the July swing high around the $31.75 zone and the $32.00 mark, looks like a distinct possibility. The momentum could extend further and allow the XAG/USD to challenge a one-decade high, around mid-$32.00s touched in May.
On the flip side, weakness below the $31.00 mark now seems to find decent support near the $30.70 horizontal zone. Any further decline might still be seen as a buying opportunity and remain limited near the $30.00 psychological mark. Some follow-through selling could expose the $29.35 confluence resistance breakpoint, now turned support, which should now act as a strong near-term and a key pivotal point for the commodity.
A convincing break below could accelerate the downfall and drag the XAG/USD below the $29.00 mark, towards testing the next relevant support near the $28.20-$28.15 zone. This is followed by the $28.00 mark and strong horizontal support near the $27.70 area, or the monthly low, which if broken might shift the near-term bias back in favor of bearish traders.
Silver is a precious metal highly traded among investors. It has been historically used as a store of value and a medium of exchange. Although less popular than Gold, traders may turn to Silver to diversify their investment portfolio, for its intrinsic value or as a potential hedge during high-inflation periods. Investors can buy physical Silver, in coins or in bars, or trade it through vehicles such as Exchange Traded Funds, which track its price on international markets.
Silver prices can move due to a wide range of factors. Geopolitical instability or fears of a deep recession can make Silver price escalate due to its safe-haven status, although to a lesser extent than Gold’s. As a yieldless asset, Silver tends to rise with lower interest rates. Its moves also depend on how the US Dollar (USD) behaves as the asset is priced in dollars (XAG/USD). A strong Dollar tends to keep the price of Silver at bay, whereas a weaker Dollar is likely to propel prices up. Other factors such as investment demand, mining supply – Silver is much more abundant than Gold – and recycling rates can also affect prices.
Silver is widely used in industry, particularly in sectors such as electronics or solar energy, as it has one of the highest electric conductivity of all metals – more than Copper and Gold. A surge in demand can increase prices, while a decline tends to lower them. Dynamics in the US, Chinese and Indian economies can also contribute to price swings: for the US and particularly China, their big industrial sectors use Silver in various processes; in India, consumers’ demand for the precious metal for jewellery also plays a key role in setting prices.
Silver prices tend to follow Gold’s moves. When Gold prices rise, Silver typically follows suit, as their status as safe-haven assets is similar. The Gold/Silver ratio, which shows the number of ounces of Silver needed to equal the value of one ounce of Gold, may help to determine the relative valuation between both metals. Some investors may consider a high ratio as an indicator that Silver is undervalued, or Gold is overvalued. On the contrary, a low ratio might suggest that Gold is undervalued relative to Silver.
Following Thursday’s volatile action, GBP/USD gathers bullish momentum and trades at its highest level since March 2022 above 1.3300 in the European morning on Friday. The pair’s near-term technical outlook points to overbought conditions.
The table below shows the percentage change of British Pound (GBP) against listed major currencies this week. British Pound was the strongest against the Japanese Yen.
| USD | EUR | GBP | JPY | CAD | AUD | NZD | CHF | |
|---|---|---|---|---|---|---|---|---|
| USD | -0.90% | -1.50% | 1.56% | -0.28% | -1.66% | -1.42% | -0.13% | |
| EUR | 0.90% | -0.66% | 2.43% | 0.60% | -0.81% | -0.60% | 0.74% | |
| GBP | 1.50% | 0.66% | 3.03% | 1.26% | -0.16% | 0.09% | 1.41% | |
| JPY | -1.56% | -2.43% | -3.03% | -1.80% | -3.10% | -2.91% | -1.73% | |
| CAD | 0.28% | -0.60% | -1.26% | 1.80% | -1.47% | -1.15% | 0.03% | |
| AUD | 1.66% | 0.81% | 0.16% | 3.10% | 1.47% | 0.24% | 1.56% | |
| NZD | 1.42% | 0.60% | -0.09% | 2.91% | 1.15% | -0.24% | 1.32% | |
| CHF | 0.13% | -0.74% | -1.41% | 1.73% | -0.03% | -1.56% | -1.32% |
The heat map shows percentage changes of major currencies against each other. The base currency is picked from the left column, while the quote currency is picked from the top row. For example, if you pick the British Pound from the left column and move along the horizontal line to the US Dollar, the percentage change displayed in the box will represent GBP (base)/USD (quote).
The Bank of England (BoE) announced on Thursday that it left the policy rate unchanged after the September meeting, as expected. In a hawkish surprise, only one policymaker voted in favor of a 25 basis points rate cut. Speaking later in the day, BoE Governor Andrew Bailey said that he is optimistic that interest rates in the UK will fall but added that they need to see more evidence of residual inflation pressure disappearing. Although GBP/USD retreated slightly after the BoE event, it closed in positive territory on Friday.
The renewed selling pressure surrounding the US Dollar (USD) and the upbeat data from the UK helped GBP/USD push higher early Friday. The UK’s Office for National Statistics reported that Retail Sales rose 1% on a monthly basis in August, surpassing the market expectation for an increase of 0.4%.
The economic calendar will not offer any high-tier data releases that could impact GBP/USD’s action on Friday. Hence, investors could pay close attention to changes in risk perception. On Thursday, Wall Street’s main indexes registered strong gains. In the European morning on Friday, US stock index futures trade marginally lower. A deep correction in US stocks after the opening bell could support the USD and limit GBP/USD upside. On the other hand, investors could ignore overbought conditions and allow the pair to stretch higher if risk flows continue to dominate the financial markets heading into the weekend.
The Relative Strength Index (RSI) indicator on the 4-hour chart rises toward 80, reflecting overbought conditions for GBP/USD. On the upside, 1.3350 (upper limit of the ascending regression channel) aligns as next resistance before 1.3400 (psychological level, static level).
In case GBP/USD retreats below 1.3300 (mid-point of the ascending channel) and starts using this level as resistance, an extended correction toward 1.3230 (lower limit of the ascending channel) could be seen.
The Pound Sterling (GBP) is the oldest currency in the world (886 AD) and the official currency of the United Kingdom. It is the fourth most traded unit for foreign exchange (FX) in the world, accounting for 12% of all transactions, averaging $630 billion a day, according to 2022 data. Its key trading pairs are GBP/USD, aka ‘Cable’, which accounts for 11% of FX, GBP/JPY, or the ‘Dragon’ as it is known by traders (3%), and EUR/GBP (2%). The Pound Sterling is issued by the Bank of England (BoE).
The single most important factor influencing the value of the Pound Sterling is monetary policy decided by the Bank of England. The BoE bases its decisions on whether it has achieved its primary goal of “price stability” – a steady inflation rate of around 2%. Its primary tool for achieving this is the adjustment of interest rates. When inflation is too high, the BoE will try to rein it in by raising interest rates, making it more expensive for people and businesses to access credit. This is generally positive for GBP, as higher interest rates make the UK a more attractive place for global investors to park their money. When inflation falls too low it is a sign economic growth is slowing. In this scenario, the BoE will consider lowering interest rates to cheapen credit so businesses will borrow more to invest in growth-generating projects.
Data releases gauge the health of the economy and can impact the value of the Pound Sterling. Indicators such as GDP, Manufacturing and Services PMIs, and employment can all influence the direction of the GBP. A strong economy is good for Sterling. Not only does it attract more foreign investment but it may encourage the BoE to put up interest rates, which will directly strengthen GBP. Otherwise, if economic data is weak, the Pound Sterling is likely to fall.
Another significant data release for the Pound Sterling is the Trade Balance. This indicator measures the difference between what a country earns from its exports and what it spends on imports over a given period. If a country produces highly sought-after exports, its currency will benefit purely from the extra demand created from foreign buyers seeking to purchase these goods. Therefore, a positive net Trade Balance strengthens a currency and vice versa for a negative balance.
Spot Gold recovered its bullish tone early on Thursday, and traded as high as $2,594.75 a troy ounce, holding on to gains and changing hands at around $2,590 mid-American session. Stock markets reflect the optimism that harms US Dollar’s demand, following the Federal Reserve (Fed) monetary policy announcement. The Fed trimmed interest rates by more than anticipated on Wednesday, kick-starting a new monetary policy cycle with a 50 basis points (bps) cut to the benchmark rate.
Fed officials’ message, however, was not as dovish as expected. As usual, Chairman Jerome Powell maintained a cautious tone, refraining from explaining future action, and repeating the decisions will depend on upcoming data. The US Dollar moved back and forth with the news, but resumed its slump with the Asian opening, as global indexes edged north, welcoming lowering borrowing costs in the world´s largest economy.
Encouraging United States (US) data provided temporal support to the USD ahead of Wall Street’s opening. The country published the Q2 Current Account, which posted a deficit of $266.8 billion. Initial Jobless Claims for the week ended September 13 improved to 219K while the Philadelphia Fed Manufacturing Survey printed at 1.7 in September, much better than the previous -7 or the expected -1.
The Bank of Japan (BoJ) will announce its monetary policy decision early on Friday, and market participants anticipate no changes to the monetary policy. Any announcement that diverges from expectations will likely bring volatility back and affect Gold price.
XAU/USD is on its way to retest its recent highs and even extend its gains, despite the positive market mood, as investors drop the USD. Technical readings in the daily chart support such a scenario, as technical indicators head firmly north well above their midlines. At the same time, all moving averages aim north, with the 20 Simple Moving Average (SMA) providing dynamic support at around $2,527.
The near-term picture is also bullish. In the 4-hour chart, technical indicators have extended their advances within positive levels, although with limited upward strength as the XAU/USD pair develops below its recent peaks. Finally, the 100 and 200 SMAs gain upward traction far below the current level, while a flat 20 SMA attracts intraday buyers in the $2,570 region.
Support levels: 2,574.80 2,561.65 2,550.00
Resistance levels: 2,605.00 2,620.00 2,640.00
Following Wednesday’s highly volatile action, EUR/USD gathers bullish momentum early Thursday and trades in positive territory above 1.1150. The US economic calendar will feature mid-tier macroeconomic data releases but the risk perception could drive the pair’s action.
The table below shows the percentage change of Euro (EUR) against listed major currencies this week. Euro was the strongest against the Japanese Yen.
| USD | EUR | GBP | JPY | CAD | AUD | NZD | CHF | |
|---|---|---|---|---|---|---|---|---|
| USD | -0.80% | -1.04% | 1.40% | -0.38% | -1.85% | -1.61% | -0.22% | |
| EUR | 0.80% | -0.29% | 2.17% | 0.39% | -1.12% | -0.87% | 0.54% | |
| GBP | 1.04% | 0.29% | 2.38% | 0.68% | -0.83% | -0.60% | 0.84% | |
| JPY | -1.40% | -2.17% | -2.38% | -1.75% | -3.15% | -2.95% | -1.66% | |
| CAD | 0.38% | -0.39% | -0.68% | 1.75% | -1.56% | -1.24% | 0.05% | |
| AUD | 1.85% | 1.12% | 0.83% | 3.15% | 1.56% | 0.26% | 1.66% | |
| NZD | 1.61% | 0.87% | 0.60% | 2.95% | 1.24% | -0.26% | 1.42% | |
| CHF | 0.22% | -0.54% | -0.84% | 1.66% | -0.05% | -1.66% | -1.42% |
The heat map shows percentage changes of major currencies against each other. The base currency is picked from the left column, while the quote currency is picked from the top row. For example, if you pick the Euro from the left column and move along the horizontal line to the US Dollar, the percentage change displayed in the box will represent EUR (base)/USD (quote).
The Federal Reserve (Fed) announced on Wednesday that it lowered the policy rate by 50 basis points (bps) to the range of 4.75%-5%. Markets were forecasting the Fed to cut the policy rate by 25 bps but there were growing expectations of a 50 bps cut. Nevertheless, the immediate market reaction triggered a US Dollar (USD) selloff and fuelled a leg higher in EUR/USD.
Meanwhile, the revised Summary of Economic Projections (SEP), the so-called dot-plot, showed that policymakers foresee two more 25 bps rate reductions in the last two meetings of the year. In the post-meeting press conference, Chairman Jerome Powell refrained from committing to another large rate reduction, adding that they could dial back the pace of cuts if the economy remains solid.
Although the USD managed to stage a rebound in the Fed aftermath, risk flows started to dominate the financial markets early Thursday, not allowing the currency to hold its ground. At the time of press, US stock index futures were up between 1% and 1.75%. A bullish opening, followed by a risk rally, in Wall Street’s main indexes could further weigh on the USD and open the door for an extended rally in EUR/USD.
In the early American session, the US Department of Labor will publish the weekly Initial Jobless Claims data.
The Relative Strength Index (RSI) indicator on the 4-hour chart rose slightly above 70, suggesting that EUR/USD’s bullish bias remain intact, with a possibility of a technical correction in the near term.
On the upside, 1.1200 (static level, end-point of the uptrend) aligns as first resistance before 1.1275 (July 18, 2023, high) and 1.1300 (round level). Looking south, interim support could be spotted at 1.1130 (20-period Simple Moving Average) ahead of 1.1100 (Fibonacci 23.6% retracement) and 1.1080 (100-period Simple Moving Average).
Silver (XAG/USD) faces downward pressure amid a strong US dollar, but rising demand in China could trigger a price recovery.
On a more optimistic note, China’s increasing demand for silver is emerging as a potential catalyst for price recovery. The Shanghai Metals Exchange has reported that silver prices in China are approximately 10% higher than in Western markets, highlighting strong domestic demand. This surge is attributed to China’s booming solar panel industry and tech sector, which have driven silver imports to exceed 400 tons in both June and July—double the previous year’s monthly average of 200 tons.
The robust demand from China has raised concerns about a potential “silver squeeze” as global production struggles to keep pace with rising demand. Analysts warn that this imbalance could lead to higher silver prices, especially in industries such as electronics and solar energy that are heavily reliant on the metal. If silver remains under-supplied, Western markets could face significant price increases.
Silver (XAG/USD) is trading at $27.93, reflecting a 0.43% decline and ongoing bearish sentiment. The 4-hour chart reveals silver’s struggle to hold above the pivot point at $28.09. Immediate resistance is noted at $28.66, followed by further resistance at $28.98 and $29.42. On the downside, key support levels are identified at $27.54, $27.24, and $26.92.
Technical indicators are pointing to a bearish outlook for silver. The 50-day Exponential Moving Average (EMA) at $28.65 and the 200-day EMA at $28.90 act as strong resistance levels, reinforcing downward pressure. The current downward channel suggests that further declines could be expected unless silver prices break above $28.09. However, a break above this level might signal a potential bullish reversal.
In summary, while silver (XAG/USD) remains under bearish pressure due to a strong US dollar and mixed economic data, China’s rising demand offers a glimmer of hope for price recovery. The potential for a “silver squeeze” could further drive prices higher, particularly in industries dependent on the metal. As traders await key economic data, the focus will remain on whether silver can break above critical resistance levels, signaling a possible shift in market sentiment.
GBP/USD touched its highest level since March 2022 near 1.3300 in the early American session on Wednesday. Although the pair retreated later in the day, it managed to close in positive territory. Ahead of the Bank of England’s (BoE) monetary policy announcements, the pair gathers bullish momentum and trades comfortably above 1.3250.
The table below shows the percentage change of British Pound (GBP) against listed major currencies this week. British Pound was the strongest against the Japanese Yen.
| USD | EUR | GBP | JPY | CAD | AUD | NZD | CHF | |
|---|---|---|---|---|---|---|---|---|
| USD | -0.87% | -1.19% | 1.44% | -0.46% | -1.93% | -1.71% | -0.25% | |
| EUR | 0.87% | -0.37% | 2.28% | 0.38% | -1.13% | -0.90% | 0.58% | |
| GBP | 1.19% | 0.37% | 2.60% | 0.74% | -0.77% | -0.53% | 0.95% | |
| JPY | -1.44% | -2.28% | -2.60% | -1.87% | -3.27% | -3.09% | -1.75% | |
| CAD | 0.46% | -0.38% | -0.74% | 1.87% | -1.56% | -1.26% | 0.09% | |
| AUD | 1.93% | 1.13% | 0.77% | 3.27% | 1.56% | 0.23% | 1.70% | |
| NZD | 1.71% | 0.90% | 0.53% | 3.09% | 1.26% | -0.23% | 1.49% | |
| CHF | 0.25% | -0.58% | -0.95% | 1.75% | -0.09% | -1.70% | -1.49% |
The heat map shows percentage changes of major currencies against each other. The base currency is picked from the left column, while the quote currency is picked from the top row. For example, if you pick the British Pound from the left column and move along the horizontal line to the US Dollar, the percentage change displayed in the box will represent GBP (base)/USD (quote).
The Federal Reserve (Fed) decided to lower the policy rate by 50 basis points (bps) to the range of 4.75%-5% after the September meeting. The immediate market reaction caused the US Dollar (USD) to come under heavy selling pressure and triggered an upsurge in GBP/USD.
Later in the session, however, the cautious market mood helped the USD limit its losses and caused GBP/USD to retreat. In the post-meeting press conference, Chairman Jerome Powell explained that they could dial back the pace of cuts if the economy remains solid, while adding that downside risks to employment have increased.
The BoE is forecast to maintain the bank rate at 5%. Because there will not be a press conference, investors will scrutinize the statement language and the vote split. In August, BoE policymakers voted 5-4 in favor of a 25 bps cut. In case the BoE leaves the interest rate unchanged with a large majority of policymakers, 7 or more, agreeing on this decision, Pound Sterling could preserve its strength. If it’s another close call, same as it was in August, GBP/USD could have a difficult time stretching higher with the immediate reaction.
In the meantime, US stock index futures trade decisively higher in the Fed aftermath. A risk rally in the second half of the day could put additional weight on the USD’s shoulders, helping GBP/USD hold its ground even if the BoE event has a negative impact on Pound Sterling’s valuation initially.
The Relative Strength Index (RSI) indicator on the 4-hour chart stays slightly above 70 but investors could ignore overbought conditions in the near term. On the upside, 1.3300 (static level) aligns as first resistance before 1.3340 (static level from March 2022) and 1.3400 (round level).
In case GBP/USD retreats below 1.3260 (static level, former resistance), technical sellers could take action. Below this level, 1.3200 (static level) could be seen as next support before 1.3150 (100-period Simple Moving Average).
Gain access to all that Trend has to offer, as well as to premium, licensed content via subscription or direct purchase through a credit card.
In an official announcement, the Federal Reserve lowered the target range for the federal funds rate by 50 basis points to 4.75%-5% in September 2024, marking the first reduction in borrowing costs since March 2020. While the rate cut decision was expected, there had been speculation over whether the US central bank would opt for a more conservative 25 basis point cut instead. The Fed also released new economic projections. Policymakers are factoring in 100 basis points of easing by the end of the year, suggesting two more 25 basis point cuts this year.
Additional cuts of 1% are expected in 2025, followed by a final 50 basis point cut in 2026. The personal consumption expenditures price index was also revised downward for 2024 to 2.3% (from 2.6% in June forecasts) and 2.1% for 2025 (from 2.3%). Also, core inflation is expected to decline to 2.6% for 2024 (from 2.8%) and 2.2% for 2025 (from 2.3%). US GDP growth is expected to slow slightly to 2% (from 2.1%), but the forecast for 2025 remained at 2%. Meanwhile, the unemployment rate is expected to rise this year (4.4% vs. 4%) and next year (4.4% vs. 4.2%).
There was good news for both market optimists and dollar pessimists: the upcoming Fed rate decision could be in your Favor, whatever it does. That’s according to Padraic Garvey, head of research at ING. “We have a sneaking suspicion that we might see a ‘surprise’ reaction with higher market rates to whatever the Fed does. That’s happened before. In fact, it works about 50:50 on the reaction function historically,” the analyst said.
The rough evidence suggests that a 25bp cut would disappoint markets, which are generally preparing for a stronger 50bp cut. Thus, that would put pressure on stocks and send the dollar lower. However, a 25bp cut coupled with guidance for a 50bp cut before the end of the year would boost stocks and send the dollar lower. Conversely, a 50bp rate cut with cautious guidance on future cuts could have the opposite effect.
Nonetheless, why does the ING analyst suspect this could be profitable for equity speculators? “All the excitement is before the game. Then delivery brings a sense of new reality to the equation, which can see a higher tactical adjustment as an impact, even if it’s no more than a structural glitch as prices ultimately test a lower low in subsequent weeks.”

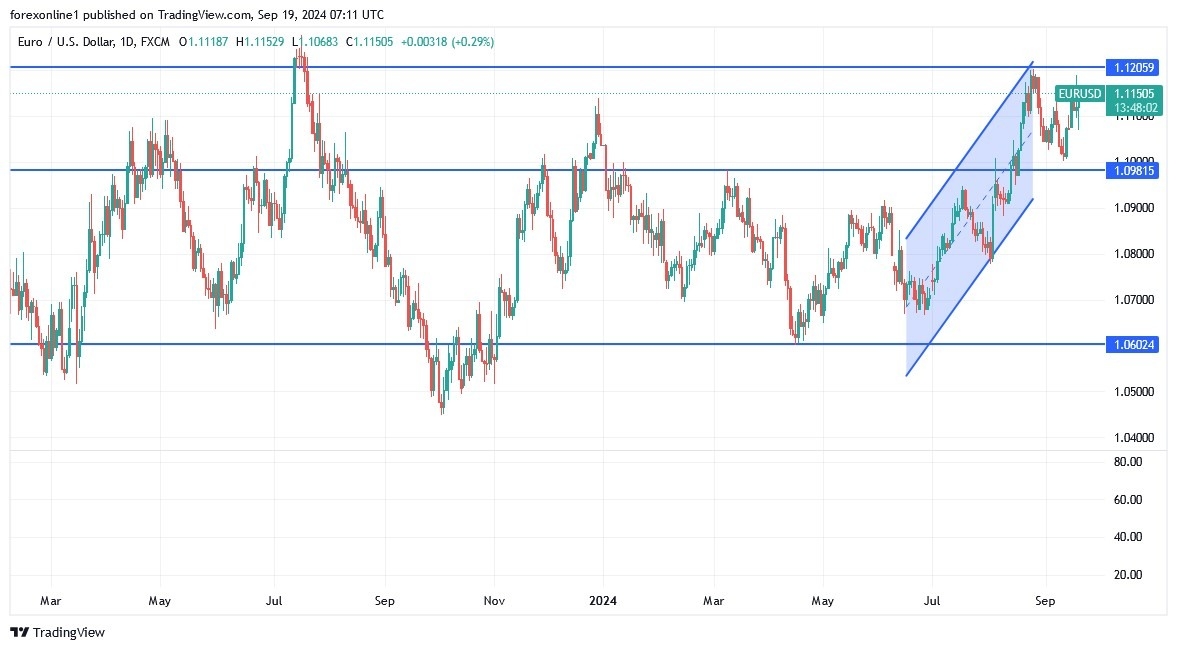
After the Fed decision, EUR/USD could maintain its upward momentum. As we mentioned before, the 1.1200 resistance will continue to provide further positive momentum for bulls to control the trend. On the other hand, according to the performance on the daily chart, a move towards the 1.1020 and 1.0880 support levels will be important for the upside to evaporate. Ultimately, Financial markets and investors will continue to assess the Fed’s statements and the future frequency of US interest rate cuts or not.
Ready to trade our EUR/USD Forex analysis? We’ve made a list of the best forex demo accounts worth trading with.