The main category of Forex News.
You can use the search box below to find what you need.
[wd_asp id=1]
The main category of Forex News.
You can use the search box below to find what you need.
[wd_asp id=1]
WTI crude futures fell 4.5% on Tuesday morning as hedge funds and money managers continued to sour on crude oil.

Bearish Sentiment on Oil Still Yet to Hit Bottom

– Hedge funds and other money managers have turned the most bearish on crude ever since the CFTC started to publish information on market positioning, with Brent and WTI net longs totaling a mere 139,242 lots in the week ended September 3.
– As the oil market gathered in Singapore this week for the annual Appec conference, Trafigura head of oil trading Ben Luckock said oil would dip into the 60s soon, depressed by weakening demand in China.
– US investment Citi lowered its 2025 price forecast to a mere 60 per barrel, prompting a general downward revision of outlooks as Morgan Stanley and the Bank of America both slashed its expectations to $75 per barrel.
– Crude oil futures could potentially flip into contango over the upcoming period as the ICE Brent 36-month spread between the November 2024 and November 2027 contracts shrank to a mere $2 per barrel, down from $9 per barrel a month ago.
Market Movers
– A blaze at Mexico’s largest refinery, the 330,000 b/d Salina Cruz refinery operated by national oil company Pemex, killed two workers as a fire broke out after a truck bumped into refinery waste that surfaced after rain overflowed the sewers.
– Canada’s pipeline operator Pembina Pipeline (TSO:PPL) agreed to buy infrastructure assets in Alberta’s Montney basin from oil producer Veren for $300 million, in yet another instance of M&A in the midstream segment.
– US oil major ExxonMobil (NYSE:XOM) has reportedly renounced on the idea of buying half of Galp Energia’s (ELI:GALP) stake in the allegedly huge Mopane offshore discovery in Namibia, potentially wielding 10 billion barrels of oil equivalent.
Tuesday, September 10, 2024
Not even a forming hurricane in the US Gulf of Mexico could halt the decline in oil prices, with ICE Brent dipping below $70 per barrel and marking the lowest level it has been since late 2021. Defying OPEC+’s postponement of output increases and the Libyan oil embargo, oil prices continue to edge lower on fears of oversupply and an ever-weakening Chinese outlook.
OPEC Lowers Its Demand Growth Outlook. Amidst plunging oil prices, OPEC cut its forecast for global oil demand growth in both 2024 and 2025, revising this year’s outlook to a still very ambitious 2.03 million b/d whilst cutting next year’s number marginally lower to 1.74 million b/d.
Storm Francine Triggers Gulf Evacuations. UK-based energy major Shell (LON:SHEL) has paused drilling operations at its Perdido and Whale offshore platforms in the Gulf of Mexico as Tropical Storm Francine, the sixth named storm of the 2024 hurricane season, is headed towards Texas.
New Regulations Jeopardize US Gulf Production. The American Petroleum Institute warned the US Department of Commerce that if it does not act quickly to publish a new assessment on how to protect endangered species in the Gulf of Mexico, all offshore oil and gas operations could be disrupted.
Central Europe Exhales Amidst New Deal on Ukraine Transit. Hungary’s oil company MOL said it reached a deal to ensure the continued supply of Russian oil via the Druzhba pipeline that transits Ukraine, changing the delivery point from its own border to the Belarus-Ukraine border.
Biden Administration Expedites SPR Repurchases. Having purchased 2.5 million barrels of US crude last month for delivery to Bryan Mound in January-March, the US Energy Department bought another 3.4 million barrels to be delivered in the same months at the same time, boosting the pace of SPR replenishment.
Russia’s Grey Tankers Ignore Danish Pilots. Oil tankers carrying Russian oil as part of its so-called shadow fleet are increasingly refusing to use the service of Danish pilots as they navigate their ships through the Danish straits, increasing the risks of oil spills amidst strong currents and varying depths.
India Doubles Down on Coal Plants. India’s state-owned coal producer Coal India (NSE:COALINDIA) is planning to invest $8 billion to build coal-fired power plants next to its mines, adding at least 4.7 GW of generation over the next six years as part of a giant 88 GW capacity buildout.
Italy Revisits Its Nuclear Strategy. Italy is looking to reverse its ban on nuclear power production and is mulling the creation of a new company to build smaller modular nuclear reactors, to be led by the state power market champion Enel (BMI:ENEI), expecting to pass it in Parliament next year.
UAE Signs Another Major LNG Term Deal. ADNOC, the national oil company of the UAE, has agreed to a 15-year term deal with India’s leading oil firm IOC (NSE:IOC) to supply up to 1 million metric tonnes of LNG per year from 2028, the seventh term contract that it allocated to future buyers.
China Launches Anti-Dumping Probe into Canola. Chinese authorities have announced the launch of a one-year anti-dumping investigation into the imports of canola from Canada, with rapeseed becoming Beijing’s tit-for-tat response to Ottawa’s 100% on Chinese-made EVs and other products.
Qatar Names Flagship LNG Carrier After Rex Tillerson. Qatar’s national energy company QatarEnergy has unveiled its first LNG carrier to be built by the Chinese Hudong-Zhonghua shipyard for its upcoming North Field expansion, naming it after former Exxon CEO Rex Tillerson.
Ecopetrol Implodes on CrownRock Deal Fallout. Two independent directors have resigned from the board of Colombian oil producer Ecopetrol (NYSE:EC), dissatisfied with the company’s decision not to take a 30% stake in CrownRock Energy as part of Occidental’s (NYSE:OXY) $12 billion takeover.
India Launches New LNG Truck Policy. Mirroring China’s large-scale conversion of diesel trucks to LNG, India announced a draft scheme to convert one-third of its existing heavy-duty vehicle fleet over the next five years, however, the lack of a nationwide retail network and high costs could derail that vision.
By Tom Kool for Oilprice.com
Oil prices fell again on Tuesday—by more than 3% on the day—indicating a dramatic shift in fundamentals or some geopolitical tension in the oil-rich Middle East. Only neither of those things has happened—at least not today.
By 10:30am EDT on Tuesday, the price for a barrel of Brent crude oil had fallen by $2.33 (-3.24%) to $69.51—the lowest price in years. WTI crude had fallen by $2.60 (-3.78%) per barrel to $66.11.
But fundamentals have not changed to warrant such a price dip. The API hasn’t issued any figures, nor has the EIA. The world’s largest oil consumer, the United States hasn’t released any significant economic data, for better or for worse.
The only relevant data marker that was released today is customs data about China’s exports, published by Reuters, which grew at a quick pace in August as manufacturers moved to get under the wire of upcoming tariffs. China’s imports, however, were a disappointment, rising only 0.5% instead of the 2% that was anticipated, and a lower growth than in the month prior.
Later today, the American Petroleum Institute will offer its estimate of crude oil and crude oil products inventory movements in the United States. Tomorrow, the Energy Information Administration will offer its estimate of the same.
Brent crude is now trading down $4 from this same time last week, with WTI trading down $4 week over week.
Earlier this week, Morgan Stanley reduced its forecast for Brent crude for the second time in two weeks, now expecting an average of $75 per barrel in Q4—a serious downgrade from its August predictions for Q4 of $80, comparing the trend in Brent prices to “other periods with considerable demand weakness.”
By Julianne Geiger for Oilprice.com
The EUR/USD pair is pressured, trading near its daily low at 1.1027. The US Dollar trades with a weaker tone against other major rivals on Tuesday, but the Euro can not attract investors. The looming European Central Bank (ECB) monetary policy announcement undermines demand for the Euro, as the ECB is widely anticipated to trim interest on the three benchmark rates by 25 basis points (bps) each. The latest data coming from the Eurozone fueled concerns about a potential recession in the area, which was led by an economic setback in Germany. An interest rate cut was priced long ago, yet recent concerns add to the Euro’s weakness.
The US Dollar, in the meantime, is in no better shape. Market players are waiting for an inflation update, as the country will release the August Consumer Price Index (CPI) on Wednesday. Price pressures are expected to have eased further in the month, although the index is still foreseen above the Federal Reserve (Fed) goal of around 2%.
Data-wise, Germany confirmed that the Harmonized Index of Consumer Prices (HICP) rose at an annualized pace of 2% in August. The United States (US) has a light macroeconomic calendar, as it published the NFIB Business Optimism Index, which contracted to 91.2 in August from 93.7 in July. Fed officials Michael Barr and Michelle Bowman are scheduled to speak after Wall Street’s opening, although no relevant comments about monetary policy are to be expected ahead of the Federal Open Market Committee (FOMC) meeting next week.
The daily chart for the EUR/USD pair shows the risk remains skewed to the downside as it develops below a now flat 20 Simple Moving Average, which provides dynamic resistance at around 1.1090. The 100 SMA is slowly advancing above the 200 SMA, both well below the current level, losing their bullish relevance. Finally, technical indicators head south with uneven strength but within negative levels, in line with another leg lower.
Technical readings in the 4-hour chart support a downward extension. The EUR/USD pair is developing below the 20 and 100 SMAs, with the shorter one gaining bearish strength. At the same time, technical indicators maintain firm downward slopes near oversold readings, supporting a break below 1.1020, the immediate support level.
Support levels: 1.1020 1.0975 1.0930
Resistance levels: 1.1090 1.1115 1.1150
The 2024 adjustment, Cochilco said in a report, was related to “macroeconomic weakness in the main consuming countries” and “the postponement of the start of the monetary policy rate reduction cycle in the United States”.
The commission also cited “geopolitical uncertainty and the accumulation of inventories in the Asian market,” but noted prices would remain above $4.00 per pound – a key level it expects to be maintained over the next decade.
Cochilco also said that Chile’s copper production is expected to increase by 3% in 2024 from the previous year to 5.41 million metric tons, short of the previously estimated 5.5 million tons.
In 2025, production would grow 6% to 5.7 million tons, Cochilco added. The Andean country is the world’s largest copper producer.
The commission added that the refined copper market is anticipated to be roughly balanced in 2024 and 2025.
“It is estimated to be in a slight deficit in 2024, with 12,000 tons, and surplus in 2025, with 13,000 tons,” markets coordinator Victor Garay said. “This forecast implies a relevant change from the previous estimate, when a deficit was foreseen.”
(Reporting by Fabian Andres Cambero; Writing by Natalia Siniawski; Editing by Gabriel Araujo)
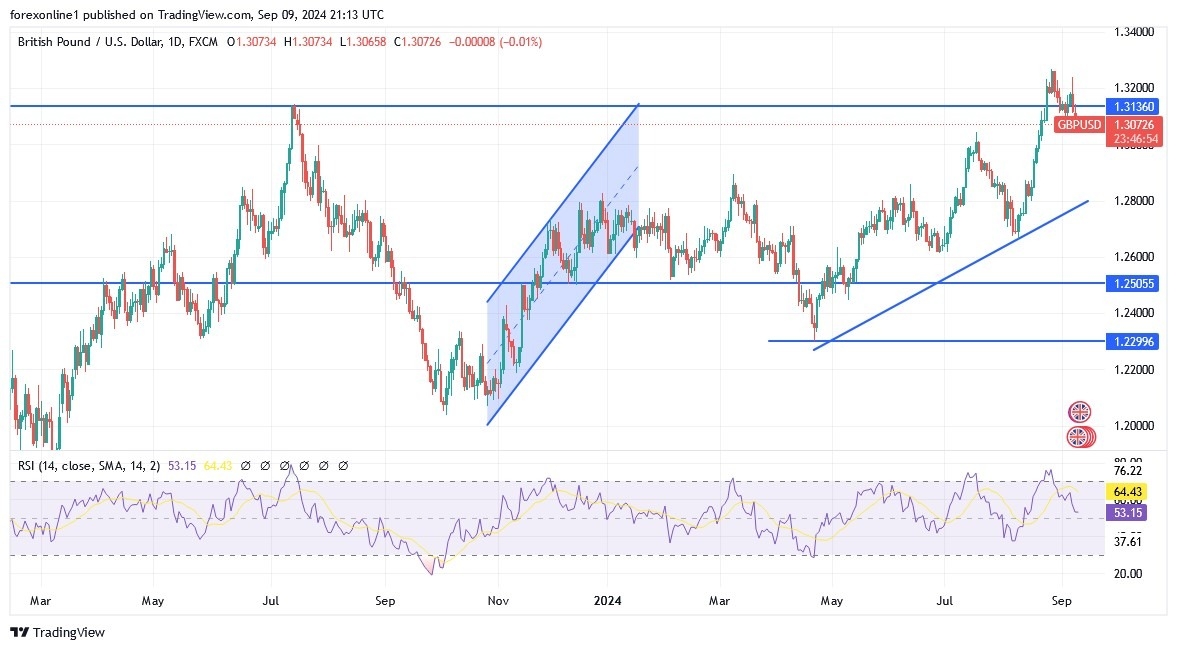
Facing the economic calendar risks, the pound is under short-term pressure against the dollar. The GBP/USD pair fell below the important psychological level of 1.31 on Monday, as the strong sell-off we witnessed on Friday extended into the new week. This move is driven by an adjustment in expectations for US interest rate cuts by the Federal Reserve, as the market has lowered the probability of a 50 basis point US interest rate cut on September 18, now favouring a more traditional 25 basis point move.
Overall, the extent of the sell-off will be determined first and foremost by how long the US interest rate outlook continues to be revised. The market entered September with high hopes for a rapid and aggressive easing cycle from the Fed, but the reality has become clear that the US economy is too healthy to warrant such an easing in policy expectations.

The net result is a stronger dollar, and the immediate support for the resulting weakness in the GBP/USD pair is now at 1.3087, a horizontal graphical support from which the GBP/USD pair rebounded last week. As we have seen it come into play in late August, there is a chance for some buyers to intervene here.
However, we are looking at a lower level at 1.3036 as a more important support area, as this level represents a 23.6% Fibonacci retracement of the significant rally we saw from April to August. Furthermore, we note that Fibonacci retracement lines in this broader multi-month move have a degree of predictive power, and we will add them to our toolkit as a result. Note that upon reaching the 1.3036 level, the best price for the dollar for individual buyers will start to slip to the 1.29 level.
The pound is likely to dominate the proceedings on Tuesday with the release of UK jobs and wages figures. The market expects employment to rise by 84,000 jobs in the three months to July, with an unemployment rate of 4.1%. However, UK jobs figures will be of greater importance for the pound, as this is what the Bank of England will be watching closely. The bank is not expected to cut rates again, but there is some debate about whether it will move again in October and November.
Overall, weaker-than-expected wage data could strengthen the chances of a rate cut in October, which would negatively impact the pound. Average earnings are expected to rise by 4.1% in the three months to July, down from 4.5%. Wage pressures have eased, but some economists are concerned that they are not falling fast enough. If this is the case, the data could beat expectations and reduce the chances of a rate cut in October, which could strengthen the pound against the euro and other currencies. According to analysts, “Another decline in nominal wages could ease inflation concerns in the UK and allow the Bank of England to cut rates later this year, although we still expect them to cut rates at a slower pace than the European Central Bank and the Federal Reserve.”
Tomorrow, Wednesday, will see the release of the UK’s GDP figures for July, with the market expecting a 0.2% growth, up from the flat 0% growth in the previous month. Theoretically, the GDP figure ranks second after the wage data release, but any significant surprises (more than 0.2%) could shake the market, potentially weakening the British pound in case of any disappointments and strengthening it in the event of any unexpected growth.
The biggest release of the day is the US monthly inflation report, due at 13:30 GMT, and given the importance of global drivers, this could end up being the highlight of the week for sterling exchange rates. If US inflation comes in below expectations, market expectations of a 50bp rate cut by the Fed on September 18 will increase, boosting equity markets and supporting sterling against the euro.
However, if the data comes in stronger, expect more selling pressure, as the odds of a 50-basis point cut will be erased, potentially putting further pressure on stocks and the British pound.
Last week, we heard from an influential member of the Federal Reserve’s rate-setting committee that, while U.S. rate cuts are necessary, the path forward remains data-dependent. Consequently, markets interpreted this as a sign that the Fed isn’t concerned enough to pursue a 50-basis point cut and would prefer sticking to more traditional 25 basis point adjustments. This view could shift if inflation numbers exceed expectations, increasing the likelihood of another strong week for the U.S. dollar.
Analysts also note that September is historically a month when global stocks decline, which could keep the pound under pressure in the coming three weeks, in line with this adjustment. However, we believe that supportive UK rate expectations could limit the downside for the GBP/USD pair, and we still view any weakness as part of a larger cyclical trend toward appreciation, which will eventually return.
Ready to trade our Forex daily analysis and predictions? Here are the best forex trading platforms UK to choose from.
Analogously, bank of Japan policymakers indicated that they would adjust monetary settings further if their economic and price outlooks materialize. On the economic data front, final figures showed that Japan’s economy grew at an annual rate of 2.9% in the second quarter, below the previous figure of 3.1% and market expectations of 3.2%.
According to stock trading platforms, Japan’s Nikkei Index falls to its lowest level in a month. According to trading, the Nikkei 225 index of Japanese shares fell by 0.48% to close at 36,216 points, while the broader TOPIX index lost 0.68% to close at 2,580 points on Monday, settling at its lowest levels in more than three weeks, as technology stocks led the decline. Consequently, Japanese stocks followed a sharp sell-off in Wall Street markets on Friday as weak US jobs data raised concerns about the health of the world’s largest economy.
Meanwhile, final data showed that Japan’s economy grew at an annual rate of 2.9% in the second quarter, below the previous figure of 3.1% and the consensus forecast of 3.2%. However, strong growth, rising wages and persistent inflationary pressures continue to support bets that the Bank of Japan will raise interest rates further. According to trading platforms, losses in technology stocks were led by Tokyo Electron (-2.3%), Disco Corp (-3.1%) and Renesas Electronics (-3.1%). Other major constituents in the index also posted notable declines, including Mitsubishi Heavy Industries (-2.3%), Mitsubishi UFJ (-2.3%) and Toyota Motor (-3.2%).
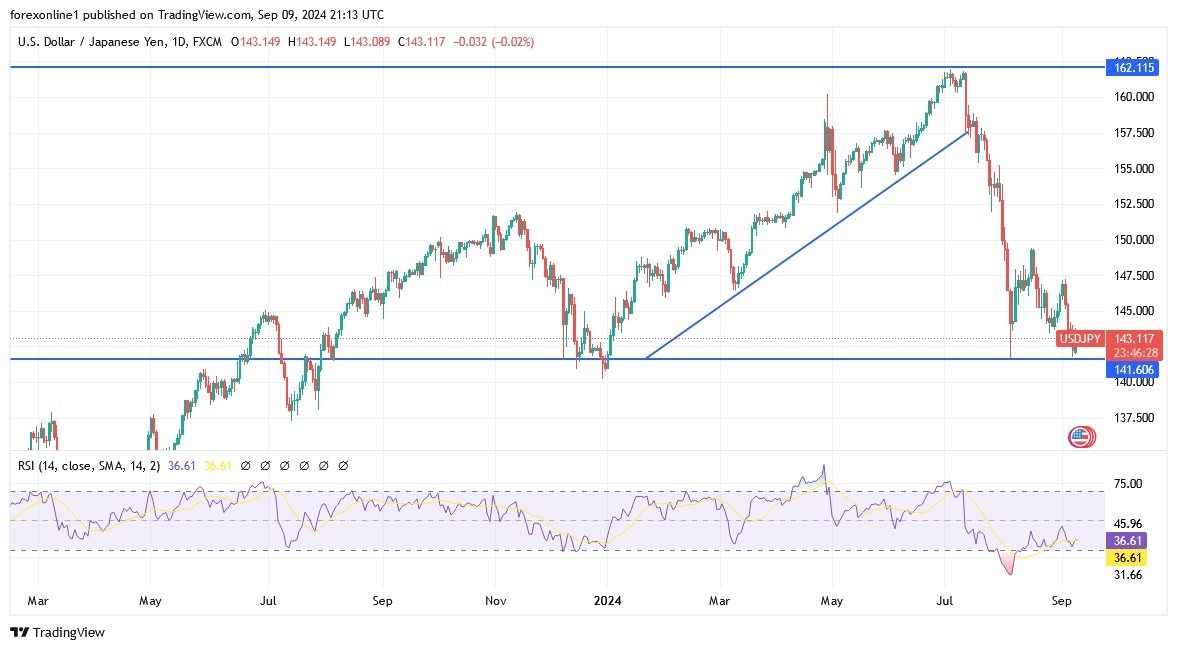
USD/JPY has been trending lower in the past few days, but support around 142.00 appears to be holding. A pullback to Fibonacci levels close to here could follow. Meanwhile, the 38.2% Fibonacci retracement level is at 143.88, followed by the 50% level at 144.51. also, the larger correction could reach the 61.8% level at 145.15 near the downtrend line that has held since August and the 100 SMA resistance.
As for the moving averages, the 100 SMA is below the 200 SMA suggesting that the stronger resistance path is to the downside or that the sell-off is likely to gain more strength than a reversal. However, the gap between the indicators is narrowing to reflect the weakening downward pressure and a potential bullish crossover. If the latter happens, the USD/JPY pair could attempt to break above the trend line and go for a reversal on the downside. Stochastic is after all signalling oversold conditions, and is turning higher to reflect the recovery of bullish momentum. Similarly, the RSI is moving higher, so the price could follow suit as bulls regain control. Both oscillators have plenty of room to run before signalling exhaustion among buyers.
Overall, the USD/JPY pair is likely to take cues from this week’s US inflation reports, especially the CPI release which could feature a decline in annual inflation. A weaker-than-expected result could increase the chances of a 0.5% Fed rate cut in September, which could drag the dollar lower further. On the other hand, strong data could dampen hopes of a Fed rate cut, which could lift the greenback. Nevertheless, it is worth noting that data out of Japan was mostly positive last week while the Bank of Japan’s rhetoric turned hawkish, which led to strong gains for the JPY. Finally, there are no major reports out of Japan this week.
Ready to trade our daily forex forecast? Here are the best forex brokers in Japan to choose from.
After ending the previous week on a bearish note, EUR/USD remained under bearish pressure and closed in negative territory on Monday. The pair holds steady at around 1.1050 early Tuesday as investors move to the sidelines ahead of this week’s key events.
The table below shows the percentage change of Euro (EUR) against listed major currencies this week. Euro was the weakest against the US Dollar.
| USD | EUR | GBP | JPY | CAD | AUD | NZD | CHF | |
|---|---|---|---|---|---|---|---|---|
| USD | 0.44% | 0.30% | 0.90% | 0.04% | 0.16% | 0.39% | 0.47% | |
| EUR | -0.44% | -0.19% | 0.52% | -0.39% | -0.33% | -0.03% | 0.01% | |
| GBP | -0.30% | 0.19% | 0.58% | -0.20% | -0.14% | 0.14% | 0.20% | |
| JPY | -0.90% | -0.52% | -0.58% | -0.85% | -0.72% | -0.52% | -0.23% | |
| CAD | -0.04% | 0.39% | 0.20% | 0.85% | 0.16% | 0.33% | 0.59% | |
| AUD | -0.16% | 0.33% | 0.14% | 0.72% | -0.16% | 0.28% | 0.31% | |
| NZD | -0.39% | 0.03% | -0.14% | 0.52% | -0.33% | -0.28% | 0.07% | |
| CHF | -0.47% | -0.01% | -0.20% | 0.23% | -0.59% | -0.31% | -0.07% |
The heat map shows percentage changes of major currencies against each other. The base currency is picked from the left column, while the quote currency is picked from the top row. For example, if you pick the Euro from the left column and move along the horizontal line to the US Dollar, the percentage change displayed in the box will represent EUR (base)/USD (quote).
Rising US Treasury bond yields helped the US Dollar outperform its rivals in the first half of the day on Monday. Although the improving risk mood limited the USD’s gains in the American session, EUR/USD still lost nearly 0.5% on a daily basis.
The US economic calendar will not feature any macroeconomic data releases that could influence the USD’s valuation on Tuesday. Hence, investors could remain focused on risk perception. At the time of press, US stock index futures were trading little changed on the day. In case safe-haven flows return to markets ahead of the Presidential Debate, EUR/USD could have a difficult time holding its ground.
Nevertheless, investors could refrain from taking large positions while waiting for the Consumer Price Index data from the US and the European Central Bank’s (ECB) policy announcements later in the week.
The Relative Strength Index (RSI) indicator on the 4-hour chart stays below 40 and EUR/USD trades well below the 20, 50 and the 100-period Simple Moving Averages (SMA).
The Fibonacci 38.2% retracement of the latest uptrend aligns as immediate support at 1.1040. If this support fails, 1.1000-1.0990 (Fibonacci 50% retracement, psychological level, 200-period SMA) could be seen as next bearish target before 1.0940 (Fibonacci 61.8% retracement).
On the upside, first resistance is located at 1.1070 (20-period SMA, 50-period SMA) before 1.1100 (Fibonacci 23.6% retracement, 100-period SMA) and 1.1160 (static level).
The Euro is the currency for the 20 European Union countries that belong to the Eurozone. It is the second most heavily traded currency in the world behind the US Dollar. In 2022, it accounted for 31% of all foreign exchange transactions, with an average daily turnover of over $2.2 trillion a day. EUR/USD is the most heavily traded currency pair in the world, accounting for an estimated 30% off all transactions, followed by EUR/JPY (4%), EUR/GBP (3%) and EUR/AUD (2%).
The European Central Bank (ECB) in Frankfurt, Germany, is the reserve bank for the Eurozone. The ECB sets interest rates and manages monetary policy. The ECB’s primary mandate is to maintain price stability, which means either controlling inflation or stimulating growth. Its primary tool is the raising or lowering of interest rates. Relatively high interest rates – or the expectation of higher rates – will usually benefit the Euro and vice versa. The ECB Governing Council makes monetary policy decisions at meetings held eight times a year. Decisions are made by heads of the Eurozone national banks and six permanent members, including the President of the ECB, Christine Lagarde.
Eurozone inflation data, measured by the Harmonized Index of Consumer Prices (HICP), is an important econometric for the Euro. If inflation rises more than expected, especially if above the ECB’s 2% target, it obliges the ECB to raise interest rates to bring it back under control. Relatively high interest rates compared to its counterparts will usually benefit the Euro, as it makes the region more attractive as a place for global investors to park their money.
Data releases gauge the health of the economy and can impact on the Euro. Indicators such as GDP, Manufacturing and Services PMIs, employment, and consumer sentiment surveys can all influence the direction of the single currency. A strong economy is good for the Euro. Not only does it attract more foreign investment but it may encourage the ECB to put up interest rates, which will directly strengthen the Euro. Otherwise, if economic data is weak, the Euro is likely to fall. Economic data for the four largest economies in the euro area (Germany, France, Italy and Spain) are especially significant, as they account for 75% of the Eurozone’s economy.
Another significant data release for the Euro is the Trade Balance. This indicator measures the difference between what a country earns from its exports and what it spends on imports over a given period. If a country produces highly sought after exports then its currency will gain in value purely from the extra demand created from foreign buyers seeking to purchase these goods. Therefore, a positive net Trade Balance strengthens a currency and vice versa for a negative balance.
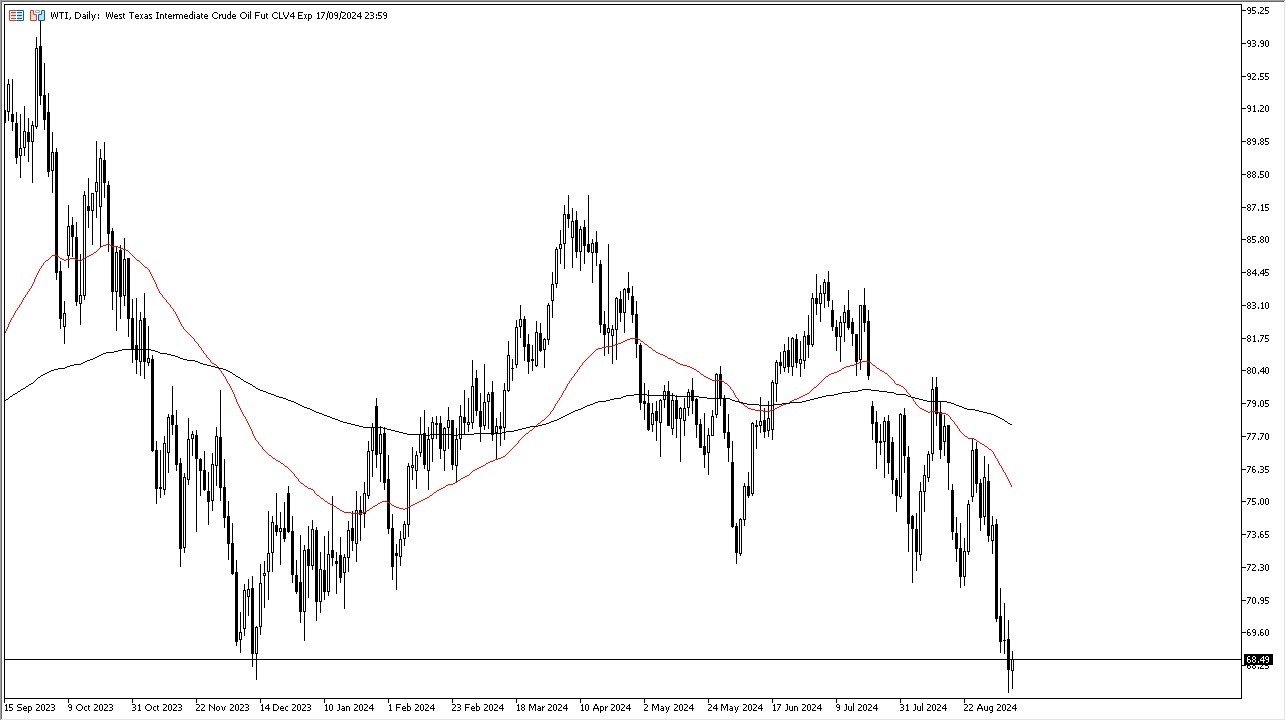
I believe at this point in time the Crude Oil market is going to continue to pay close attention to the $68 region, as it is an area that has been important and significant support in the past. Rally and from here would be expected due to the fact that we are so oversold, but the real question will be asked about whether or not we can get above the $72.50 level, as it is an area that a lot of people have paid close attention to in the past, and I think ultimately, we’ve got a scenario where people will be waiting to see whether or not the previous support should then offer significant resistance in a phenomenon known as “market memory.”
Keep in mind that the global economy looks precarious at best, and I think a lot of people are going to keep an eye on crude oil as a way to express what they believe when it comes to global growth. After all, oil is essentially the “lifeblood” of the global markets, so if there is a significant drop in economic growth, that means there will be a significant drop in crude oil. That’s essentially what’s been going on for the last couple of weeks, and now the question will be whether or not we see any follow through.
If we were to break down below the lows of the last couple of days, we could see oil really start to drop drastically. On the other hand, I think we got a situation where we are trying to find the floor, and therefore it could be choppy and noisy over the next couple of sessions.
Ready to trade the daily Forex forecast? Here’s a list of some of the best Oil trading platforms to check out.
Gold price is trading on a slippery slope, battling $2,500 in Tuesday’s trading so far. Despite a minor retreat, Gold price remains within its recent range, with traders refraining from placing fresh bets on the bright metal ahead of critical US Consumer Price Index (CPI) data due on Wednesday.
Gold price is challenging the critical short-term daily support level, now at $2,499, yet again amid a modest uptick in the US Treasury bond yields and sustained US Dollar strength. The return of risk-off flows in Asia, in the face of looming concerns over a Chinese economic slowdown, keeps the haven demand for the US Dollar supported even as markets lower bets for a 50 basis points (bps) interest rate cut by the US Federal Reserve (Fed) next week.
A weak US labor market report failed to convince markets of an outsized rate cut by the world’s most powerful central bank this month amid lingering US ‘hard-landing’ fears.
Markets are currently pricing in a 29% chance of a 50 bps rate cut move, down from about 47% seen pre-NFP data release, the CME Group’s FedWatch Tool shows. About 110bps worth of cuts are priced in for the rest of the year.
Against this background, the Wall Street indices rebounded firmly but the US Treasury bond yields downtrend enabled the non-yielding Gold price to stage a brief comeback on Monday.
All eyes remain on the US inflation data due
on Wednesday. The data is likely to ramp up volatility around the US Dollar and, in turn, the Gold price. US inflation data will be key to determining Fed rate cuts beyond September.
In the meantime, Gold price will remain at the mercy of risk trends, in the absence of top-tier US data on Tuesday. Additionally, the Fed entered its ‘blackout period’ on Saturday ahead of the September 18 policy decision, leaving Gold price gyrating in a familiar range.
Nothing seems to have changed for Gold price from a short-term technical perspective, as buyers continue to stay hopeful so long as the 21-day Simple Moving Average (SMA), now at $2,499, is being defended.
The 14-day Relative Strength Index (RSI) has turned slightly lower, still remains well above the 50 level, supporting the bullish bias.
After recapturing the $2,500 level on a daily closing basis on Monday, Gold buyers now aim for the record high of $2,532, above which the $2,550 psychological level will come into play.
If Gold price faces rejection once again near the $2,530 supply zone, a correction would ensue, with a daily closing below the 21-day SMA at $2,499 needed for a sustained downside.
A breach of the latter will challenge the previous week’s low of $2,472, followed by the symmetrical triangle resistance-turned-support at $2,461.
Gold has played a key role in human’s history as it has been widely used as a store of value and medium of exchange. Currently, apart from its shine and usage for jewelry, the precious metal is widely seen as a safe-haven asset, meaning that it is considered a good investment during turbulent times. Gold is also widely seen as a hedge against inflation and against depreciating currencies as it doesn’t rely on any specific issuer or government.
Central banks are the biggest Gold holders. In their aim to support their currencies in turbulent times, central banks tend to diversify their reserves and buy Gold to improve the perceived strength of the economy and the currency. High Gold reserves can be a source of trust for a country’s solvency. Central banks added 1,136 tonnes of Gold worth around $70 billion to their reserves in 2022, according to data from the World Gold Council. This is the highest yearly purchase since records began. Central banks from emerging economies such as China, India and Turkey are quickly increasing their Gold reserves.
Gold has an inverse correlation with the US Dollar and US Treasuries, which are both major reserve and safe-haven assets. When the Dollar depreciates, Gold tends to rise, enabling investors and central banks to diversify their assets in turbulent times. Gold is also inversely correlated with risk assets. A rally in the stock market tends to weaken Gold price, while sell-offs in riskier markets tend to favor the precious metal.
The price can move due to a wide range of factors. Geopolitical instability or fears of a deep recession can quickly make Gold price escalate due to its safe-haven status. As a yield-less asset, Gold tends to rise with lower interest rates, while higher cost of money usually weighs down on the yellow metal. Still, most moves depend on how the US Dollar (USD) behaves as the asset is priced in dollars (XAU/USD). A strong Dollar tends to keep the price of Gold controlled, whereas a weaker Dollar is likely to push Gold prices up.
(MENAFN– Daily Forex)
You can see that the British pound initially rallied during the trading session on Friday, but then collapsed quite significantly to show extreme signs of weakness.
At this point in time, the market is likely to continue to see a lot of uncertainty.
With the jobs number in the United States coming out weaker than anticipated, that has people worried about the global growth situation. And of course, whether or not the trader is going to continue to chase risk, or will they run into something like the US bond market in order to protect their wealth?
That is a very real possibility, but we’ll have to wait and see how that plays out. Keep in mind, this is a market that has been very, uh, bullish for some time. And we are now consolidating quite drastically. This suggests that the market will more likely than not continue to see the dips as potential buying opportunities, but if we really start to see panic take over the market, the US dollar is almost always a big winner.Top Forex Brokers1 Get Started 74% of retail CFD accounts lose money A breakdown below the 1.3050 level opens up the possibility of a move down to the 1.30 level and then the 50 day EMA. In general, this is a market that I think continues to be very noisy and no matter what happens next, it is going to be a choppy affair. If we were to break above the 1.3250 level, then the 1.35 level could end up being a target, which being a psychologically important large figure, it also could end up being a ceiling. We will wait to see if that ends up being the case, and as a result, I think this is a market that will remain volatile, but over the next few weeks, we should get a bit of clarity if the Federal Reserve can do its job of conveying their plans to the marketplace.Ready to trade our GBP/USD daily analysis and predictions? Here are the best forex trading platforms UK to choose from.
MENAFN09092024000131011023ID1108653819

Legal Disclaimer:
MENAFN provides the information “as is” without warranty of any kind. We do not accept any responsibility or liability for the accuracy, content, images, videos, licenses, completeness, legality, or reliability of the information contained in this article. If you have any complaints or copyright issues related to this article, kindly contact the provider above.