The main category of Forex News.
You can use the search box below to find what you need.
[wd_asp id=1]
The main category of Forex News.
You can use the search box below to find what you need.
[wd_asp id=1]
Williams said that the time had come for a US interest rate cut, but market expectations of a large 50 basis point move faded as he showed no inclination for such an aggressive initial cut. In addition, the US non-farm payrolls numbers were not significantly below expectations and remained above 114K in July. Additionally, the unemployment rate fell to 4.2% from 4.3%, which was expected. Also shining on the positive side for the US dollar was the stronger-than-expected earnings data of 0.44% on a monthly basis, which was stronger than the expected reading of 0.3%.
Widely, Hurricane Beryl is believed to have tarnished the picture in July, which is why the smoothing of the data on a three-month basis provides a good glimpse into the direction of the Labor market. The three-month rolling average has now fallen to 116K from 146K, confirming a clear trend of weakness.
According to Forex trading, the US dollar’s reaction after the payrolls is likely to be limited to recent ranges as there is not enough evidence in this report to clearly indicate whether the Fed will raise US interest rates by 50 or 25 basis points, ensuring that an element of uncertainty remains.
Overall, the US inflation report this week will provide more guidance for the markets, but it should be noted that the US Federal Reserve has shifted its focus from inflation to employment, believing that higher prices are eventually expected to decline further in the coming months. The Fed will be concerned about rising unemployment if it does not take action, but the debate now is over how strong the opening strike will be.
Concurrently, the Fed is expected to cut US interest rates by a total of 100 basis points this year, meaning at least one of the remaining meetings will see a 50-basis point rate cut. If that happens, the US dollar could continue to fall as US interest rates converge with those in other parts of the world.
An analysis from Bank of America says: “With the US 10-year Treasury yield trending lower after the first Fed cut, global financial conditions are set to improve further. The US dollar could see further weakness as other central banks, especially those that cut rates before the Fed, are now able to let the Fed do some of its work.”
On the stock exchanges front, the FTSE 100 failed to recover and closed down about 0.7% at 8,181.5 on Friday, its lowest level in nearly a month, extending losses to a sixth straight session. Meanwhile, the performance came as global traders reassessed the latest US jobs report, which pointed to continued slowdown in the Labor market, reinforcing expectations of an imminent interest rate cut by the Federal Reserve. However, uncertainty persisted over the scope of the potential cut. Locally, figures from Halifax showed that UK house prices rose to a two-year high in August as confidence rebounded amid easing interest rates. Among individual stocks, Vestry Group shares hit the bottom of the index, down 6.3% after UBS analysts stuck to a “sell” rating on the housebuilder despite positive results on Thursday. Burberry shares lost more than 5% ahead of their imminent FTSE 100 plunge. Also, industrial mining shares fell on the back of lower copper and iron ore prices.
For the week, the FTSE 100 index of UK shares fell 2.3%.

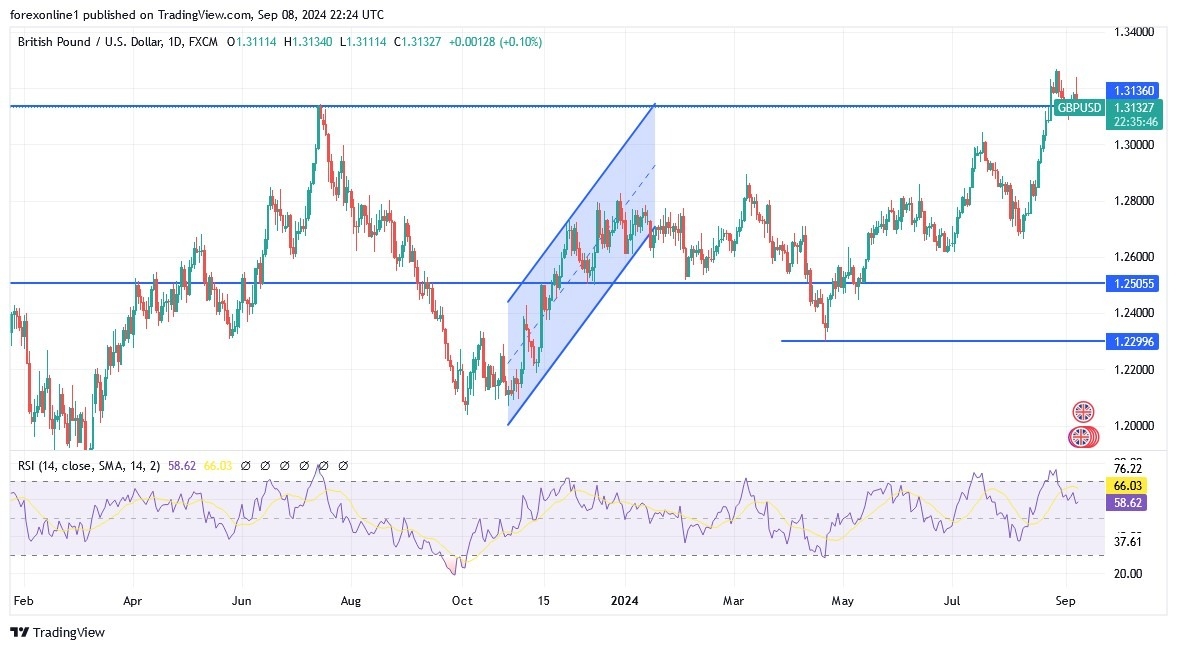
The GBP/USD price is trying hard to avoid collapsing to the psychological support level of 1.3000 so that the current bullish hopes do not evaporate. Technically, this is the most prominent level on the daily chart below and the GBP/USD price may remain in the current performance area until the financial markets and investors react to the announcement of the US inflation figures. Obviously, this latest economic data that will determine the fate of the US Federal Reserve’s decision in the coming days. In contrast, the resistance of 1.3250 remains the most important for the strength of bulls’ control. At the same time technical indicators are moving towards strong overbought levels.
Ready to trade our daily Forex analysis? We’ve made this UK forex brokers list for you to check out.
Last week’s price range is relatively large, from 2.075 to 2.29 and natural gas could trade within that range all this week. Nevertheless, it marks the key near-term support and resistance levels. In addition, the 2.29 price level should be used along with 2.30. The 2.30 level is more significant as it marks the breakout level of the double bottom. Also, notice that the 50% retracement is near last week’s low at 2.085.
Natural gas showed signs of strength last week that should be followed by further strength, unless negated. On Friday, it was able to close above the 200-Day MA, currently at 2.255, for the first time since July 1. But today, natural gas has fallen back below the 200-Day line. In addition, last week completed a measured move relative to the most recent prior upswing, which is from the rally off the first recent bottom at 1.88. The rally off that low was 22.3%, and the current advance completed a 22.4% rally from the second bottom, as of last week’s high. It adds to the potential for resistance around the 2.29/2.30 price zone.
If natural gas continues to weaken but stays above last week’s low, it will continue to be poised for an upside breakout of the double bottom pattern. A drop below 2.075 may increase the time for a retracement to occur and could put at risk the potential double bottom pattern. A bullish reversal on the weekly chart was triggered last week and it indicates a likely continuation higher. That may change though if the 2.075 level is broken to the downside.
An upside bullish breakout of the double bottom will trigger on a move above 2.30. It will then need to close above it to confirm the strength of the breakout. There will then be the potential for natural gas to test resistance around the top trendline, which is near the 78.6% retracement at 2.89. Lower price targets are marked on the enclosed chart.
For a look at all of today’s economic events, check out our economic calendar.
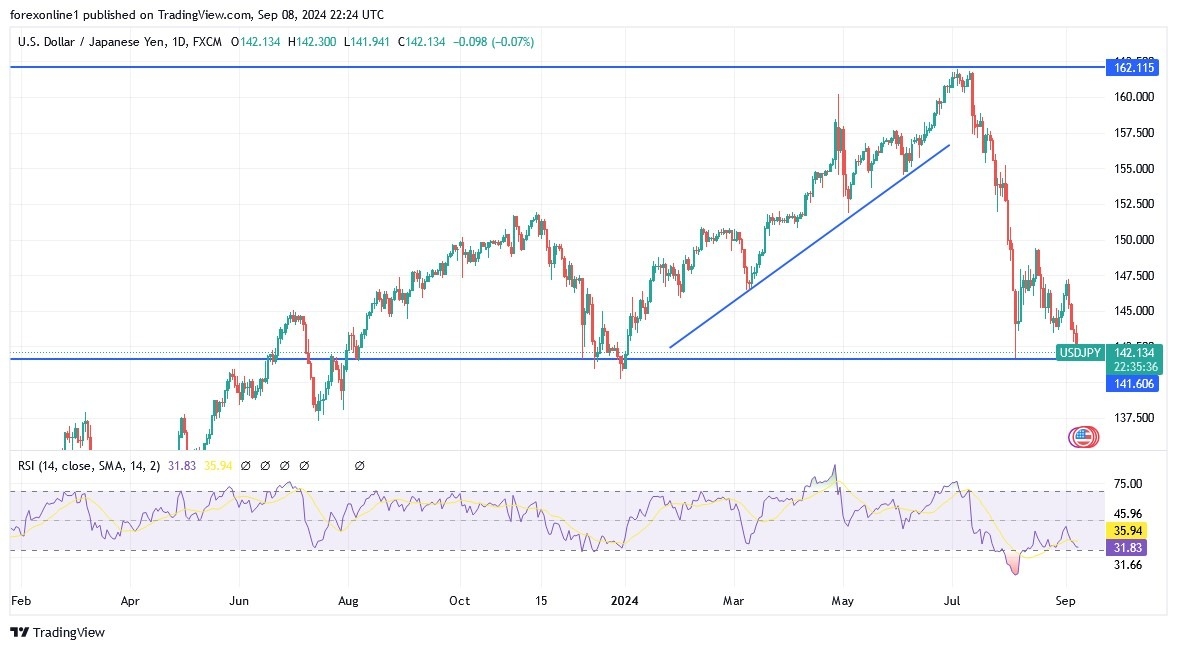
The US dollar has bounced a bit in the early hours against the Japanese yen against the backdrop of the 142 yen level offering massive support. This is an area where I think a lot of traders will be looking to find buyers. And therefore, the little bit of a bounce does make a certain amount of sense as the 142 yen level has been crucial multiple times. When you zoom out, it doesn’t take a whole lot of imagination to see that the market is most certainly testing an area of pretty significant support, not only based on the 142 yen level, but a massive trend line that goes back to the beginning of 2022.
So, it’s somewhat now or never for the dollar. Keep in mind that on the 18th, we have the next Federal Reserve meeting. And while it is expected to be a cut, it’s the language that people will be paying the most attention to. Furthermore, two days later on the 20th, we have the next interest rate decision from the Bank of Japan.
So, the next week or two might be somewhat choppy as we hang around this general vicinity, but this is an area that if we are going to see a turnaround, this would be a prime candidate. If we break down below the 140 yen level, this whole thing probably falls apart, and we could find ourselves down at 125 yen rather quickly.
For a look at all of today’s economic events, check out our economic calendar.
This article was originally posted on FX Empire
Brent Crude oil prices are set to drop into the $60s per barrel range soon, according to one of the largest independent oil traders, Trafigura.
Brent Crude, the international benchmark, was trading at $71.63 a barrel, up by 0.65% on the day, early on Monday, as both benchmarks rebounded following a major selloff last week. Oil prices dropped to their lowest level so far this year and settled on Friday at the lowest levels since June 2023.
Ben Luckock, Global Head of Oil at Trafigura, expects Brent to drop into the $60s handle, although he warned that traders shouldn’t put all their eggs in the basket of shorts.
The price of Brent is “probably going to go into the $60s some time relatively soon,” Luckock said at the Asia Pacific Petroleum Conference (APPEC) conference in Singapore on Monday.
But, he warned that “It’s dangerous because there’s so many events out there that can ruin your day,” in remarks at a panel at the conference carried by Bloomberg.
“I wouldn’t put all your chips on the table being short,” Luckock said.
The mood in the oil market has been increasingly bearish in recent weeks amid concerns about oil demand in China, which isn’t living up to earlier expectations of leading another year of growth in global consumption.
Another major oil trader, Gunvor, also expects Brent at $70. Gunvor’s co-founder and chairman Torbjorn Tornqvist told the APPEC conference that Brent’s fair value is now $70 a barrel as supply outpaces demand.
The problem with oversupply is not the OPEC+ policy but the fact that the group doesn’t have control over the jump in non-OPEC+ supply, Tornqvist said.
The bearish forecasts from Gunvor and Trafigura came just as Morgan Stanley cut again its forecast of Brent oil price to average $75 a barrel in the last quarter of the year. The outlook downgrade was the second in just two weeks after at the end of August the Wall Street bank cut its Brent price forecast for the fourth quarter to $80 per barrel, down from $85 expected earlier.
By Charles Kennedy for Oilprice.com
The EUR/USD pair eased towards 1.1035 during European trading hours, as the Euro got hit by poor local data fueling concerns about the Eurozone’s economic performance. At the same time, the US Dollar remained resilient amid caution ahead of first-tier events scheduled for later this week.
The EU released September Sentix Investor Confidence, which fell for a third consecutive month, printing at -15.4. The accompanying report showed the economy is on the brink of a recession and that the poor performance of the German economy plays a major role in this. The United States (US) macroeconomic calendar will remain light on Monday, as the country will release July Wholesale Inventories and Consumer Credit Change for the same month.
However, the US will publish the August Consumer Price Index (CPI) on Wednesday, expected to have risen by 2.6% in the previous twelve months. Such a reading will be still above the Federal Reserve (Fed) goal of around 2%, but will be better than the 2.9% posted in July. Additionally, the European Central Bank (ECB) will announce its decision on monetary policy on Thursday. The ECB is widely anticipated to trim interest rates by 25 basis points (bps) after already delivering an interest rate cut. EU data released earlier today supports the case for a looser monetary policy amid the risk high rates imply to economic progress.
The EUR/USD pair is sharply down for a second consecutive day, and technical readings in the daily chart show the slide may continue. The pair gapped lower at the opening and fell after filling the gap. A mildly bullish 20 Simple Moving Average (SMA) provides resistance at around 1.1090, while the 100 SMA slowly advances above the 200 SMA in the 1.0850 price zone. Nevertheless, technical indicators head firmly south, and the Momentum indicator has already crossed below its 100 level, in line with continued selling pressure.
In the near term, and according to the 4-hour chart, the risk skews to the downside. The pair has extended its slide below the 20 and 100 SMAs, with the shorter one slowly gaining downward traction. Technical indicators have stabilized as the pair bounced from the aforementioned intraday low, but remain within negative levels, without signs of downward exhaustion. An immediate support level comes at 1.1020, with a break below it likely resulting in another steep leg south.
Support levels: 1.1020 1.0975 1.0930
Resistance levels: 1.1090 1.1115 1.1150
Spot Gold trades just around the $2,500 mark, unchanged on Monday and confined to a tight intraday range. The bright metal peaked at $2,505.18 early in the American session, as Treasury yields started the day with a positive footing. The United States (US) 10-year note peaked at 3.76% but then trimmed gains and currently stands at 3.70%.
The US Dollar remained resilient throughout the first half of the day, extending Friday’s NFP-inspired gains. The poor performance of Asian indexes added to USD strength, which receded mid-European session, as local shares managed to post gains, underpinning Wall Street ahead of the opening.
Financial markets are waiting for US inflation data, as the country will release the August Consumer Price Index (CPI) next Wednesday. The index is foreseen up by 2.6% on a yearly basis, easing from the 2.9% posted in July. The core annual reading, however, is expected to remain unchanged at 3.2%.
Following the release of the Nonfarm Payroll (NFP) report, speculative interest lifted bets the Federal Reserve (Fed) may opt for a 50 basis points (bps) rate cut when it meets next week. Cooling inflationary pressures will add to such speculation.
From a technical point of view, the daily chart for XAU/USD shows bulls hold the grip but stay cautious. The pair is currently hovering around a mildly bullish 20 Simple Moving Average (SMA), with buyers quickly adding on dips below the media. At the same time, technical indicators hover around their midlines without clear directional strength. Finally, the longer moving averages maintain modest bullish slopes far below the current level.
The near-term picture is neutral-to-bearish. Converging 20 and 100 SMAs provide resistance around the aforementioned intraday high, while the 200 SMA aims north at around $2,465. The Momentum indicator aims lower at around its midline, skewing the risk to the downside without confirming it. Finally, the Relative Strength Index (RSI) indicator holds directionless at around 50, lacking directional strength.
Support levels: 2,489.60 2,475.70 2,461.50
Resistance levels: 2,507.60, 2,519.75 2,531.60
According to forex market trading, for two years since the US Federal Reserve began its aggressive battle against inflation, equity traders have been glued to their screens on the days the US Consumer Price Index was announced. Meanwhile, things should be different next Wednesday when the latest US CPI data is released. But why?
Because with inflation falling toward the Fed’s target and the central bank poised to cut interest rates, the reading is less important to the stock market. Instead, it’s all about the weak employment outlook and whether the central bank can avoid a sharp decline. The S&P 500 is coming off its worst week since the collapse of Silicon Valley Bank in March 2023 as big tech stocks tumbled, led by a 14% drop in Nvidia Corp. shares. Volatility is back, with the Cboe Volatility Index, or VIX, rising from 15 on Aug. 30 to a high of nearly 24 on Sept. 6.
At the same time, options traders are betting on more of that, but less than the market expected, on CPI Day. As of Friday morning, they were pricing in a 0.85% move in either direction for the S&P 500 on Wednesday. If that happens, it would be among the smallest CPI Day moves this year, according to data compiled by Piper Sandler.
On the other hand, traders were pricing in a 1.1% implied move for the S&P 500 ahead of Friday’s weak U.S. jobs report. That was among the highest this year in absolute terms and 83% above the average implied daily move in 2024, according to data compiled by Susquehanna International Group. Moreover, the benchmark stock index managed to beat expectations, falling 1.7%.
Overall and fundamentally, market thinking has now shifted as US interest rate cuts have become a foregone conclusion, but the strength of the economy seems less secure. Federal Reserve Chairman Jerome Powell virtually declared victory in the battle against inflation during his comments at the central bank’s symposium in Jackson Hole, Wyoming, on August 23. Since then, more policymakers such as New York Fed President John Williams, Chicago Fed President Austan Goolsbee. Also, Fed Governor Christopher Waller have indicated that cuts are necessary – but the size is up for debate.
Now the Fed is turning to the other side of its dual mandate, and maximizing employment. The US jobs report released on Friday showed that non-farm payrolls rose by 142,000 jobs last month, putting the three-month average at its lowest level since mid-2020, according to the Bureau of Labor Statistics. Looking ahead to the Fed’s interest rate decision on September 18, swaps contracts are fully pricing in at least a quarter-point cut. At the same time, implied moves ahead of major employment-related macro events are gaining momentum, and with equity volatility measures like the VIX remaining elevated as traders hedge for more downside risks to stocks, according to data compiled by UBS AG Group.
Friday’s pullback pushed USD/JPY below its 100-hour moving average. As a result, the pair is back near oversold levels on the 14-hour Relative Strength Index. In the short term, based on the hourly chart, USD/JPY is trading in a descending channel formation. Also, the 14-hour RSI has declined to approach oversold levels. Therefore, bears will seek to extend the current decline towards 140.44 or lower to the support at 138.52. On the other hand, bulls will seek to pounce on the rebounds at around 143.87 or higher at the resistance at 145.79. In the long term, based on the daily chart, USD/JPY is trading in a descending channel formation. The 14-day RSI also supports a long-term bearish bias as it approaches oversold levels. Therefore, bears will target long-term gains at around 136.27 or lower at the support at 129.66. On the other hand, bulls will seek to pounce on gains at around 149.07 or higher at the resistance at 155.40.
Ready to trade our daily Forex analysis? We’ve made a list of the best forex trading platforms for beginners worth trading with.
Just two weeks after lowering its Brent oil price estimate to $80 per barrel for the fourth quarter, Morgan Stanley cut again its forecast, now expecting the international benchmark to average $75 a barrel in the last quarter of the year.
Analysts at Morgan Stanley see rising headwinds on the demand side, which has been their key reason for cutting their Q4 oil price forecast.
“The recent trajectory of oil prices has similarities to other periods with considerable demand weakness,” Morgan Stanley analysts wrote in a Monday note carried by Bloomberg.
The time spreads on the oil’s futures curve have been signaling “recession-like inventory builds,” the analysts noted.
However, they wrote that it was too early to make that part of Morgan Stanley’s base-case scenario.
Monday’s downward revision to oil price forecasts is Morgan Stanley’s second such cut in a little over two weeks.
At the end of August, the Wall Street bank cut its Brent price forecast for the fourth quarter to $80 per barrel, down from $85 expected earlier.
Back then, Morgan Stanley said that the lowered oil price forecast reflected expectations of increased supply from OPEC and non-OPEC producers amid signs of weakening global demand. The bank anticipates that while the crude oil market will remain tight through the third quarter, it will begin to stabilize in the fourth quarter and potentially move into a surplus by 2025.
Early on Monday in Asian trade, Brent Crude prices traded at just below $72 per barrel, after settling on Friday at just above $71—the lowest level since June 2023.
Morgan Stanley isn’t the only major investment bank to have cut its oil price forecasts in recent weeks.
Goldman Sachs has lowered its expected range for Brent oil prices by $5 to $70-$85 per barrel, on the back of weaker Chinese oil demand, high inventories, and rising U.S. shale production.
Citi, for its part, sees $60-per-barrel oil prices next year if OPEC+ fails to implement more production cuts, amid slowing demand and strong supply coming from non-OPEC producers.
By Tsvetana Paraskova for Oilprice.com
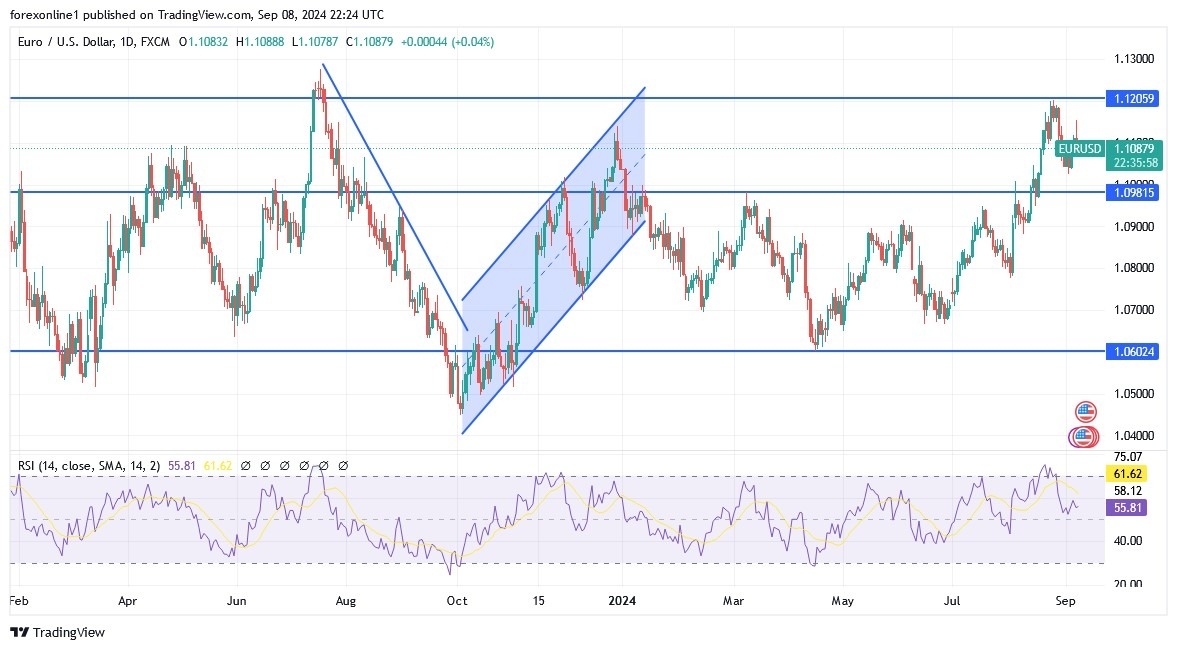
As a result, the euro fell against the US dollar EUR/USD 1.1065 after attempts to rebound higher with gains that reached the resistance level of 1.1155 and settled around the level of 1.1088 at the beginning of trading in the week of announcing the European Central Bank policy decisions amid expectations of a reduction in addition to the announcement of important US inflation figures. Williams had said in a speech he gave to the Council on Foreign Relations: “With the US economy now stable and inflation heading towards 2%, it is now appropriate to reduce the degree of restriction in the policy stance by reducing the target range for the federal funds rate.”
What the financial markets were looking for was any indication that the Federal Reserve was ready to cut US interest rates by 50 basis points. Instead, Williams said: “The stance of monetary policy could be moved to a more neutral framework over time depending on the development of data, expectations, and risks to achieving our objectives.”
He suggested there was no need to panic about the economy and the prospect of a more conventional 25bp cut seemed to disappoint the market, which had seen the odds of a 50bp move closer to 50%. Equity markets fell as expectations of a more aggressive pace of easing receded. In turn, US Treasury yields rose, as did safe-haven currencies such as the franc and the dollar. The euro/dollar exchange rate gave up its high of 1.1154 to trade at 1.1080 at the time of writing.
Before his speech, the very important US jobs report for August was released, and there was no “conclusive evidence” for supporters of a 50-basis point move. Certainly, the headline payroll figure was below expectations at 160,000 at 142,000, but this was higher than July and was not a big surprise. Additionally, the unemployment rate fell to 4.2% from 4.3%, and earnings beat expectations at 0.44% month-on-month, which was stronger than the expected 0.3%.
All eyes are now on this week’s US inflation figures, as a significant drop in expectations could activate bets on a 50-basis point move, which could in turn boost the EUR/USD exchange rate. However, anything close to consensus would warrant a 25-basis point move, which could keep the pair under pressure as the US dollar continues to make a comeback in September.
According to stock trading platforms, Wall Street markets end the week sharply lower. According to trading, US stocks fell on Friday, affected by concerns about a slowing Labor market and technology selloffs. The S&P 500 fell 1.7%, the Dow Jones lost 409 points, and the Nasdaq fell 2.5%. Big tech stocks like Amazon (-3.6%), Alphabet (-4%), and Meta (-3.2%) saw big losses, while chipmakers like Broadcom (-10.3%) and Nvidia (-4.1%) also saw sharp declines. According to the economic calendar, the US jobs report for August, which showed 142,000 new jobs versus 161,000 expected, added to the market tension. In addition, comments from Federal Reserve Governor Christopher Waller increased expectations for a further US interest rate cut in September. Also, he emphasized the growing risks in the Labor market and expressed his openness to cutting interest rates further if necessary. Over the past week, the S&P 500 lost about 4%, recording its worst week since March 2023. Likewise, the Nasdaq fell 5.6%, recording its worst start to September since 2001. Similarly, the Dow Jones fell 2.5%, recording its biggest decline in early September since 2008.
According to the daily chart, the Euro against the US Dollar EUR/USD is in a neutral position, and the trend will be more bullish if it moves towards the resistance levels of 1.1120 and 1.1200, respectively. On the other hand, and for the same period of time, the support level of 1.0945 will remain the most important for bears to control the trend again. Ultimately, we expect the Euro Dollar price to remain in narrow ranges until the reaction to the announcement of the European Central Bank policy decisions and the US inflation figures.
Ready to trade our EUR/USD Forex analysis? We’ve made a list of the best forex demo accounts worth trading with.