The main category of Forex News.
You can use the search box below to find what you need.
[wd_asp id=1]
The main category of Forex News.
You can use the search box below to find what you need.
[wd_asp id=1]
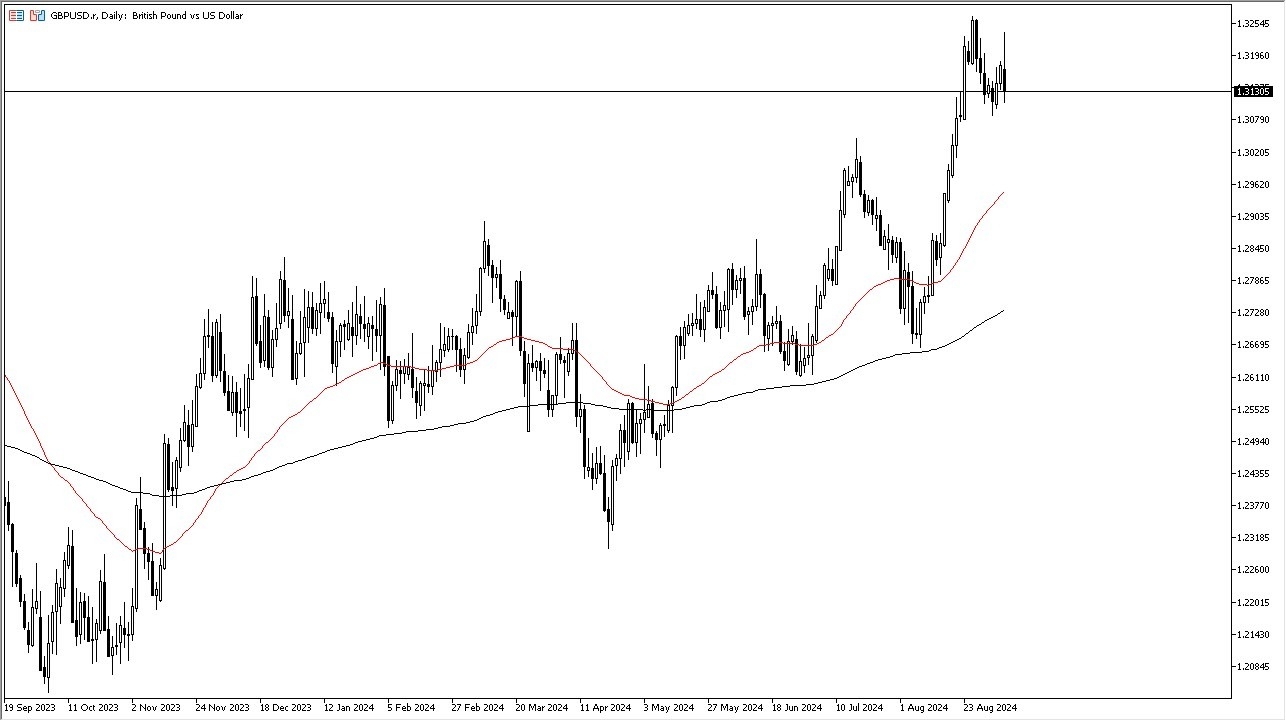
That is a very real possibility, but we’ll have to wait and see how that plays out. Keep in mind, this is a market that has been very, uh, bullish for some time. And we are now consolidating quite drastically. This suggests that the market will more likely than not continue to see the dips as potential buying opportunities, but if we really start to see panic take over the market, the US dollar is almost always a big winner.

A breakdown below the 1.3050 level opens up the possibility of a move down to the 1.30 level and then the 50 day EMA. In general, this is a market that I think continues to be very noisy and no matter what happens next, it is going to be a choppy affair.
If we were to break above the 1.3250 level, then the 1.35 level could end up being a target, which being a psychologically important large figure, it also could end up being a ceiling. We will wait to see if that ends up being the case, and as a result, I think this is a market that will remain volatile, but over the next few weeks, we should get a bit of clarity if the Federal Reserve can do its job of conveying their plans to the marketplace.
Ready to trade our GBP/USD daily analysis and predictions? Here are the best forex trading platforms UK to choose from.
Recent U.S. labor market data has fueled speculation about an aggressive rate cut. Private employers added the fewest workers in over three years in August, signaling a sharp slowdown in hiring. This follows a drop in U.S. job openings in July, further reinforcing concerns about the strength of the labor market. ADP’s employment data triggered a notable uptick in gold prices, as market participants viewed the labor market as being in a precarious state.
“The labor market is in a dire state, and there is a lot of concern about it,” noted Phillip Streible, chief market strategist at Blue Line Futures. Additional weekly jobless claims data also failed to improve sentiment, increasing the likelihood of a larger-than-expected rate cut.
Currently, traders see a 59% chance of a 25-basis-point rate cut at the Fed’s next meeting, with a 41% probability of a more substantial 50-basis-point reduction, according to the CME FedWatch tool. The Fed has signaled that incoming economic data, particularly employment figures, will play a key role in determining the size of the cut.
San Francisco Fed President Mary Daly emphasized that the central bank must take action to protect the labor market, but the extent of the move hinges on Friday’s NFP report. Should unemployment rates remain elevated at 4.3%, gold could push towards record highs as markets price in a larger rate cut.
The August NFP report is expected to show a gain of around 160,000 jobs. A result in line with expectations would likely favor a 25-basis-point rate cut, maintaining gold’s recent strength without significant volatility. However, if the jobs number comes in lower, potentially reflecting a more serious economic slowdown, the likelihood of a 50-basis-point cut increases, which would likely boost gold prices further as traders seek safe-haven assets.
Conversely, stronger-than-expected job growth could dampen the prospects of a large cut, leading to potential selling pressure on gold as investors reassess the Fed’s stance.
The USD/JPY forecast shows a slight recovery in the pair from Friday’s plunge as the yen loses some of its shine. At the same time, the dollar gained as it became clear that the Fed might cut rates gradually.
–Are you interested to learn more about forex options trading? Check our detailed guide-
After a mixed US employment report, the USD/PY pair reached new lows on Friday. The nonfarm payrolls report showed slower job growth, with the economy adding 142,000 jobs compared to estimates of 160,000. Meanwhile, the unemployment rate eased to 4.2%.
The initial reaction was a decline in the US dollar. However, it recovered as it became clear that the labor market was slowing down steadily. Therefore, the risk of a recession remains low. Although most major peers lost against the dollar on Friday, the yen remained steady due to rate hike optimism.
Notably, on Thursday, BoJ board member Hajime Takata said the central bank should continue hiking interest rates. Nevertheless, he emphasized a cautious approach amid increased market volatility. Policymakers are ready to push interest rates higher as long as economic consumption increases.
However, by Monday morning, economic data from Japan dampened some of this rate hike optimism. Japan’s economy grew slower than forecast in the second quarter. The GDP grew by 2.9% compared to estimates of 3.2%. Weaker-than-expected economic performance creates a challenge for the BoJ’s rate hike outlook.
Market participants do not expect any high-impact economic releases in Japan or the US.
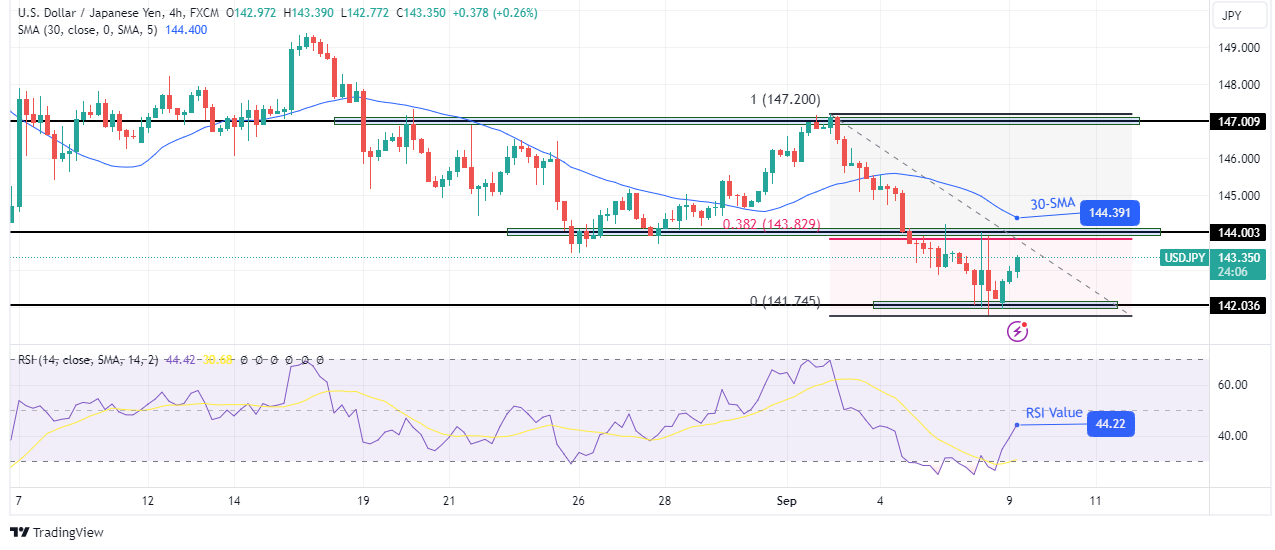
On the technical side, the USD/JPY price is recovering after finding support at the 142.03 level. Nevertheless, the price trades below the 30-SMA, with the RSI in bearish territory. Therefore, the bias is bearish, meaning the rebound might only be temporary.
–Are you interested to learn about forex robots? Check our detailed guide-
Bulls are approaching a solid resistance zone comprising the 0.382 Fib and 144.00 key levels. Moreover, the SMA trades just above this zone. Consequently, the price will likely pause at this level and bounce lower. A break below 142.03 will confirm a continuation of the downtrend.
Looking to trade forex now? Invest at eToro!
67% of retail investor accounts lose money when trading CFDs with this provider. You should consider whether you can afford to take the high risk of losing your money.
Following a drop below the key 1.3100 support earlier in the week, the Pound Sterling (GBP) managed to regain balance against the US Dollar (USD), lifting GBP/USD back north of the 1.3200 hurdle soon after US Nonfarm Payrolls disappointed expectations on Friday (+142K jobs). While that move fizzled out afterwards, it was not enough to reverse Cable’s positive weekly performance.
GBP/USD reversed the previous week’s downward bias on the back of the persistently bearish tone in the Greenback. The US Dollar remained under pressure against the backdrop of a renewed and aggressive Federal Reserve (Fed) easing narrative, which now includes a potential 50-basis-points interest-rate cut at its September 18 gathering.
The Dollar’s offered stance remained propped up by dovish remarks from the Fed’s Chairman, Jerome Powell, at the Jackson Hole Symposium in late August. His views were later reinforced by many Fed officials, who seem to have advocated for starting to reduce interest rates as soon as this month.
Following the Bank of England’s (BoE) rate cut on August 1, Governor Andrew Bailey argued that it remained uncertain whether the persistent elements of inflation were aligned with keeping price increases at the bank’s 2% target. He also questioned whether the current decline in inflation persistence was largely assured as global shocks that previously drove up inflation were easing, or if the UK economy would need a period of slack.
Furthermore, at his speech in Jackson Hole, Bailey said that he believed longer-term inflation pressures were easing. However, he highlighted that further interest-rate cuts would not be made hastily, as it was still too early to be certain that inflation had been fully controlled.
A survey released on Thursday indicated that British companies expect to raise their selling prices by the smallest margin in nearly three years, while wage growth shows no signs of slowing. This mixed news poses a challenge for BoE officials assessing inflation pressures.
Indeed, according to the BoE’s Decision Maker Panel (DMP), closely monitored by the Monetary Policy Committee, businesses in the three months to August anticipated a 3.6% rise in selling prices over the next year. This is the lowest figure since September 2021, slightly down from a previous estimate of 3.7%. However, projections for wage growth, a key factor for the BoE in monitoring inflation, remained steady at 4.1% for the three months to August, unchanged from July’s survey. The monthly data revealed that wage growth forecasts have been stable at 4.0% to 4.1% since May, indicating that the sharp decline in expectations seen over the past 18 months has halted. That said, persistent wage growth remains a major concern for the hawkish members of the MPC, who are worried that it could lead to prolonged inflationary pressures in the economy.
Investors estimate about a 25% likelihood that the “Old Lady” will cut interest rates at its September 12 policy announcement, while a rate cut is fully anticipated for November.
All the attention is expected to be on the publication of US inflation figures tracked by the Consumer Price Index (CPI). However, the UK calendar appears pretty interesting with the releases of the always-relevant labour market report on Tuesday, and GDP figures among other key fundamentals, on Wednesday.
If bearish momentum takes hold, GBP/USD could retest the September low of 1.3087 (set on September 3), followed by the interim 55-day SMA at 1.2900 and the important 200-day SMA at 1.2720. Beyond these levels, the pair may target the August low of 1.2664 (from August 8), the June low of 1.2612 (from June 27), and the May low of 1.2445 (from May 9). A break below this zone could bring the 2024 bottom of 1.2299 (recorded on April 22) back into focus, seconded by potential moves toward the weekly lows of 1.2187 (from November 10, 2023) and 1.2069 (from October 26), and ultimately the October 2023 low of 1.2037 (from October 4).
Conversely, on the upside, the immediate resistance for GBP/USD stands at the 2024 high of 1.3266 (reached on August 27), ahead of the weekly top of 1.3298 (from March 23, 2023) and the February 2022 peak of 1.3643 (from February 10). The daily RSI has eased a tad below 63.
Gold price is trading on the front foot just shy of the $2,500 threshold early Monday, consolidating Friday’s late rebound. Gold price sticks to its familiar range, as traders brace for the US Consumer Price Index (CPI) data due later this week to confirm the size of the Federal Reserve (Fed) interest rate cut next week.
Gold price clings to the critical short-term daily support level, now at $2,498, finding support from a broadly risk-averse market environment even though the US equity futures rebound in early dealings.
Softer-than-expected China’s inflation data raise demand concerns in the world’s top consumer, fuelling speculations that Chinese authorities could roll out more stimulus measures to stimulate economic prospects, supporting the non-yielding Gold price. China’s inflation rate grew 0.6% in August over the year, lower than the 0.7% expected. Every month, the CPI rose 0.4%, lower than the 0.5% expected.
Increased bets for an outsized Fed rate cut this month help maintain the bullish outlook for Gold price from a wider perspective. However, the further recovery in Gold price could be capped, as the US Treasury bond yields see a modest uptick, courtesy of the improvement in the US stock futures, providing fresh legs to the US Dollar (USD) turnaround.
The USD staged a late recovery on Friday after hitting a fresh eight-day low against its major rivals, in an immediate reaction to the disappointing US labor market report. US Nonfarm Payrolls rose by 142,000 missing a 160,000 gain estimated. On the other hand, the unemployment rate edged down to 4.2%, in line with expectations.
Discouraging US employment data rekindled worries about a possible economic downturn, smashing risk assets such as Wall Street indices. The sell-off in US stocks sparked the haven demand for the Greenback, allowing it to stage a late comeback.
The risk-off sentiment fuelled demand for the US government bonds, weighing heavily on US Treasury bond yields on Friday, helping cushion the downside in Gold price.
Looking ahead, Gold price could extend its range play until Wednesday, when the US inflation data will be published. The data is likely to ramp u volatility around the US Dollar and, in turn, the Gold price. US inflation data will be key to gauging the magnitude of the upcoming Fed rate cut.
Heading into the new week, the short-term technical outlook continues to remain constructive so long as Gold price holds above the 21-day Simple Moving Average (SMA), now at $2,498.
The 14-day Relative Strength Index (RSI) also rebounds while above the 50 level, adding credence to the bullish potential in Gold price.
Recapturing the $2,500 level on a daily closing basis is critical for Gold price to strengthen its bullish bias. The next relevant topside barrier is seen at the record high of $2,532, above which the $2,550 psychological level will come into play.
If Gold price faces rejection once again near the $2,530 supply zone, the correction would require a daily closing below the 21-day SMA at $2,498. A breach of the latter will challenge the previous week’s low of $2,472.
Further down, sellers will need to crack the symmetrical triangle resistance-turned-support at $2,459 to initiate a sustained downtrend.
Gold has played a key role in human’s history as it has been widely used as a store of value and medium of exchange. Currently, apart from its shine and usage for jewelry, the precious metal is widely seen as a safe-haven asset, meaning that it is considered a good investment during turbulent times. Gold is also widely seen as a hedge against inflation and against depreciating currencies as it doesn’t rely on any specific issuer or government.
Central banks are the biggest Gold holders. In their aim to support their currencies in turbulent times, central banks tend to diversify their reserves and buy Gold to improve the perceived strength of the economy and the currency. High Gold reserves can be a source of trust for a country’s solvency. Central banks added 1,136 tonnes of Gold worth around $70 billion to their reserves in 2022, according to data from the World Gold Council. This is the highest yearly purchase since records began. Central banks from emerging economies such as China, India and Turkey are quickly increasing their Gold reserves.
Gold has an inverse correlation with the US Dollar and US Treasuries, which are both major reserve and safe-haven assets. When the Dollar depreciates, Gold tends to rise, enabling investors and central banks to diversify their assets in turbulent times. Gold is also inversely correlated with risk assets. A rally in the stock market tends to weaken Gold price, while sell-offs in riskier markets tend to favor the precious metal.
The price can move due to a wide range of factors. Geopolitical instability or fears of a deep recession can quickly make Gold price escalate due to its safe-haven status. As a yield-less asset, Gold tends to rise with lower interest rates, while higher cost of money usually weighs down on the yellow metal. Still, most moves depend on how the US Dollar (USD) behaves as the asset is priced in dollars (XAU/USD). A strong Dollar tends to keep the price of Gold controlled, whereas a weaker Dollar is likely to push Gold prices up.
I wrote on 1st September that the best trade opportunities for that week were likely to be:
Last week’s key takeaways were:
It will be a slightly slower week ahead in terms of data, but it includes more important data, with the most important items this coming week expected to be:
I forecasted that the EUR/USD currency pair would rise in value during September. The performance of my forecast so far is as follows:

Last week, I made no weekly forecast, as there was no large group of currency crosses with unusually large directional movement, which is the basis of my weekly trading strategy.
This week, I again give no weekly forecast, as although 6 currency crosses fluctuated in value by more than 2%, I only like to trade when at least 7 have done so. The odds of profitable reversals are better when many crosses have abnormally large price movements. The volatility now is in the Japanese Yen alone.
Directional volatility in the Forex market rose last week—56% of the most important currency pairs and crosses fluctuated by more than 1%.
Last week, the Australian Dollar was the strongest major currency, while the Japanese Yen was again the weakest.
You can trade these forecasts in a real or demo Forex brokerage account.

The US Dollar Index printed a bearish candlestick last week, albeit with a significantly lower wick, suggesting the bearish momentum may not be strong. The price is below its levels three and six months ago, suggesting a long-term bearish trend in the greenback. Recently, the price broke down below the long-term consolidating triangle pattern, which was a significant bearish sign.
The overall picture is bearish, but the price is likely to consolidate until next Wednesday’s release of US CPI (inflation) data. Data from last week suggested that the US economy is a little weaker than expected, and it is now expected that the US Federal Reserve will cut rates by a full 1% before the start of 2025.
This week, I am cautiously bearish on the US Dollar due to the bearish trend.

The EUR/USD currency pair ended the week printing a higher candlestick, but looking at the price chart below, it is hard to say it looks bullish – but for this currency pair, which is prone to deep retracements, it still might be. That large upper wick is daunting for bulls, though.
The price remains within a valid long-term bullish trend.
Just like last week, I think a long trade here is still a good possibility, provided that the nearest support level at $1.1066 survives.
Much will depend on US CPI data, the policy statement, and the likely rate cut from the European Central Bank, which is due later this week. These events will likely cause some volatility here, as both currencies in the pair are directly affected.

The USD/JPY currency pair continues to be at the heart of the modern Forex market and is still showing a high level of range volatility.
The Yen was the strongest of all major currencies two weeks ago, and it was again this week. There are two good reasons for the strength of the Japanese Yen:
Last week’s candlestick was very bearish—it was relatively large, and the price closed very near the low of its range. It was the lowest weekly close seen in more than eight months, and the price is very near a full eight-month low.
I see this currency pair as a sell.

I expected the USD/CAD currency pair to have potential support at $1.3471.
The H1 price chart below shows how the price action rejected this support level with a very large and very bullish hourly pin bar, marked by the up arrow within the price chart below. This rejection occurred just at the start of the overlap of the London / New York sessions, which can often be a great time for reversals such as these in the US Dollar.
The trade made a profit so far of slightly less than 2 to 1.
All the commodity currencies are weak, and the Canadian Dollar is no exception, although it remains notably stronger than the Australian and New Zealand Dollars. The bearishness in Crude Oil helps drag the Loonie lower, with WTI reaching a new 1-year low price last week.

Gold in US Dollar terms has been grinding higher for weeks in a choppy, long-term bullish trend. Over the last few weeks, it has rejected the blue sky above the big round number $2,500 at least five times. This is a bearish sign despite the long-term bullish trend and recent record highs.
Last week, the price briefly touched a new all-time high, but looking at the weekly price chart below, we can see that last week’s candlestick was the third indecisive candlestick in a row and the second doji within that three-candlestick formation. This indicates indecision in the market.
The bearish retracement from the record high is still shallow, so it could be too soon to go short, especially if the price keeps finding support at $2,494.
Something to watch for is if the price turns strongly bullish again and decisively takes out the record high. This could be a decisive bullish sign after the five rejections, suggesting that a new long trade entry could be an excellent trade.
I see Gold as a buy if we get a daily close this week above $2,525.

The NASDAQ 100 Index fell strongly last week, in what was one of its worst-performing weeks in recent times. The large size of the bearish candlestick and the fact that it closed right on the low of its range are bearish signs.
Markets are firmly in risk-off mode and will likely remain that way until there is more clarity on the prospects of a soft landing for the US economy. US CPI data due this week will likely provide a clue on this or prompt the Fed to give more clarity on its intentions.
The price is still not very far from its record high, but it looks like the bullish stock market, especially in the technology sector, might be over.
However, I think it is too early to take a short trade here—shorting is a risky undertaking in stock markets.
The price is sitting on two key support levels and has not broken the levels of a recent bullish pin bar. Therefore, bears should not open any new short trades here.

Some CFD brokers offer trading in US Treasury Yields, and traders with larger bankrolls can access this asset through the CME micro futures market. Treasury yields can be great for trend traders as they have historically tended to trend very reliably.
The continuing slowdown in the US economy, lower inflation, and increasing fears of a recession in the USA have all combined to push expectations of the Federal Reserve in an increasingly dovish direction. This has pushed short-term (2-year) treasury yields lower and lower.
The daily price chart below shows that the yield fell strongly last Friday following lower-than-expected US non-farm payrolls data. It made the lowest daily close in one year and also traded at a new six-month low.
As all trend traders should be, I am interested in being in a short trade here as it aligns with the direction the Fed is getting pushed in.

I see the best trading opportunities this week as:
Ready to trade our weekly Forex forecast? We’ve made a list of the best Forex brokers worth checking out.
The British pound pulled back initially during the trading session on Wednesday to test support underneath. The 165-level ended up being a bit of a launching pad, and we have seen a lot of strength since then. That said, the market continues to see a lot of noisy behaviour but is bullish more than anything else.
With that being said, the market continues to find plenty of value hunters and of course is probably driven more by the Japanese yen than anything else. With that being the case, I think you’ve got a situation where the market continues to be a “buy on the dips” type of situation.
Underneath, if we do break down below the ¥165 level, it’s possible that we could see the 50-Day EMA into the picture to offer a bit of support. Breaking down below that would be something a bit more important, but at this point, I think you’ve got a situation where you have to pay close attention to risk appetite because, quite frankly, it’s probably going to be what drives our market more than anything else.
I think at this point, the fact that the buyers are very much in control, so now you have to be looking for value every time it drops. Ultimately, I do think that we will see a lot of erratic and noisy behaviour, but eventually the market looks as if it is trying to get to the ¥170 level. Breaking above there would obviously be a very bullish sign.
Underneath, the 50-Day EMA is rising, but if we were to break down below there, then we could see the market drop down to the 200-Day EMA, which is near the ¥162.50 level and rising. That being said, I do not think it’s very likely that it happens, but it is something that you always need to keep in the back of your mind just in case.
Remember, the Bank of Japan continues its yield curve control policy, and therefore it’s very likely that we will continue to see the Japanese yen somewhat soft against other currencies, especially as interest rates rise around the world.
For a look at all of today’s economic events, check out our economic calendar.
This article was originally posted on FX Empire
International crude oil prices have been on a broader downtrend and crashed nearly 20 per cent in the last 12 months due to a demand-supply imbalance in the market, even as the Organisation of Petroleum Exporting Countries and its allies (OPEC+) eye price stability. Brent and US West Texas Intermediate (WTI) crude futures logged the steepest year-to-date (YTD) crash last week after mixed US jobs data and a potential resolution of the Libya deal.
Amid the price decline, the OPEC+ group agreed last week to pause its planned oil output hike for two months after the benchmark Brent crude futures crashed to a 14-month low due to fragile demand and plentiful supply. OPEC nations will not proceed with the scheduled hike of 180,000 barrels per day (bpd) in October.
-Commodity analysts said crude oil prices are weaker because of the current oil market conditions. They added that OPEC is ‘artificially’ curtailing oil production and losing its market share to maintain Brent above $80 per barrel.
-”US is producing more crude oil than any nation at any time for the past six years in a row, according to EIA. US output was 13.1 mbpd in 2023, which is expected to further jump to 13.19 mbpd in 2024 and 13.65 mbpd by 2025 and this record is unlikely to be broken by any nation in the near term,” Mohammed Imran, Research Analyst at Sharekhan Commodities by BNP Paribas told LiveMint.
-According to experts, benchmark Brent crude futures is unlikely to touch the $100 mark until and unless there is an escalation of the Middle Eastern war turning into a full-blown war involving major producers in the region.
-OPEC is likely to extend the curbs through the second half of this year and might start unwinding from early 2025. Crude is expected to trade in a range of $70 – $90 per bbl this year, with OPEC keeping a floor under prices,” Kaynat Chainwala, AVP-Commodity Research of Kotak Securities told LiveMint.
-US government data showed employment increased less than expected in August. Still, a drop in the jobless rate to 4.2 per cent suggested an orderly labor market slowdown that may not warrant a big interest rate cut from the Federal Reserve this month. Concerns around Chinese demand also kept pressuring oil prices.
Also Read: Oil & gas reserve found in Pakistani waters; likely to be fourth-largest in world: Report
-Last Thursday, Brent settled at its lowest since June 2023 despite withdrawing from US oil inventories and OPEC+’s decision to delay planned oil output increases. US crude stockpiles fell by 6.9 million barrels to 418.3 million barrels last week, with a projected decline of 993,000.
-Signals that Libya’s rival factions could be closer to an agreement to end the dispute that has halted the country’s crude exports also pressured oil prices this week. Exports remained mostly shut in, but some loadings were permitted from storage.
-Bank of America lowered its Brent price forecast for the second half of 2024 to $75 a barrel from almost $90 previously, it said in a note on Friday, citing building global inventories, weaker demand growth and OPEC+ spare production capacity. The US active oil rig count, an early indicator of future output, remained unchanged at 483 this week, said energy services firm Baker Hughes.
Crude oil prices settled two per cent lower in the previous session, with a big weekly loss after data US jobs data was weaker than expected in August, which outweighed price support from a delay to supply increases by OPEC+ producers.
Brent crude futures were down $1.63, or 2.24 per cent, to $71.06 a barrel, their lowest level since Dec. 2021. US West Texas Intermediate crude futures fell $1.48, or 2.14 per cent, to $67.67, their lowest since June 2023. For the week, Brent declined 10 per cent, while WTI dropped around eight per cent. Back home, crude oil futures last settled 0.07 per cent lower at ₹5,700 per barrel on the multi commodity exchange (MCX).
OPEC says its member states’ exports account for about 49 per cent of global crude exports. OPEC estimates that its member countries hold about 80 per cent of the world’s proven oil reserves. Because of its large market share, OPEC’s decisions can affect global oil prices. OPEC+ members meet regularly to decide how much oil to sell on global markets.
Commodity analysts say oil prices continue to see high volatility but have remained under selling pressure overall amid further signs of a deteriorating global economic outlook, leading to sluggish demand (especially from China).
“Downside looks limited amid support from bigger than expected drawdown in oil inventories and OPEC+ member’s decision to continue with their additional output cuts. On charts… prices hold support at 5,800/ 5,720, while on the upside resistance is seen at 6,030/ 6,150,” said Pranav Mer, Vice President, EBG – Commodity & Currency Research, JM Financial Services Ltd.
Disclaimer: The views and recommendations made above are those of individual analysts or broking companies, and not of Mint. We advise investors to check with certified experts before taking any investment decisions.
Catch all the Business News , Market News , Breaking News Events and Latest News Updates on Live Mint. Download The Mint News App to get Daily Market Updates.
MoreLess
Oil prices stabilized on Wednesday as the Organization of the Petroleum Exporting Countries (OPEC) maintained its growth forecast for oil demand for this year and next, while U.S. crude and gasoline inventories likely decreased last week.
At 1312 GMT, Brent futures rose by 1 cent, or 0.01%, to $84.67 a barrel, following a 1.3% decline in the previous session. Meanwhile, U.S. West Texas Intermediate (WTI) crude increased by 11 cents, or 0.11%, to $81.52 a barrel, after falling 1.1% in the prior session.
“Crude oil prices traded lower on firm dollar and as hurricane that hit Texas caused less damage than expected. Reduced supply concerns has weighed on the oil prices. Furthermore, weakness in crude demand from China also weighed on oil prices to slip below the $82 mark. Meanwhile, tension in the Middle East and lower supplies from Russia provided support to oil price,” said brokerage firm ICICI Direct in a report.
In its monthly report released on Wednesday, OPEC reaffirmed its global oil demand growth forecasts, projecting an increase of 2.25 million barrels per day (bpd) in 2024 and 1.85 million bpd in 2025.
“Expected strong mobility and air travel in the Northern Hemisphere during the summer driving/holiday season is anticipated to bolster demand for transportation fuels and drive growth in the United States,” OPEC was quoted as saying by Reuters.
According to market sources citing American Petroleum Institute figures on Tuesday, U.S. crude oil inventories decreased by 1.923 million barrels, while gasoline inventories dropped by 2.954 million barrels. Official data from the U.S. Energy Information Administration is scheduled for release at 14:30 GMT.
Both contracts ended the past three sessions lower, as the Texas energy industry appeared largely unaffected by Hurricane Beryl.
Oil and gas companies restarted some operations on Tuesday. Some ports have reopened, and most producers are ramping up output, though some facilities sustained damage and are waiting for full power restoration.
In the Middle East, ceasefire negotiations for the Gaza conflict are set to resume in Doha, with intelligence chiefs from Egypt, the United States, and Israel attending.
Concerns over demand in China also pressured prices. Consumer prices in the world’s second-largest economy grew for the fifth consecutive month in June but missed expectations, while producer price deflation continued.
In its annual Energy Outlook report released on Wednesday, BP stated that it expects oil demand to peak next year, with rapid growth in wind and solar capacity in both of its main scenarios.
(MENAFN– Daily Forex)
The euro has rallied rather significantly against the Japanese yen during trading on Monday, which is interesting considering we’ve seen the Japanese yen lose strength against almost everything.
With that being the case, I think we are starting to return to the carry trade situation where people were shorting the yen and buying pretty much anything that would give them some type of swap.
Keep in mind that the bank of Japan did tighten monetary policy recently, but it was a pittance.
The Japanese can only tighten so much due to the fact that there’s so much debt in their economy. They could literally destroy the Japanese economy. So, with that, the dust has settled, and I suspect that we are going to continue to see the Japanese yen really take it on the chin against most currencies and the Euro won’t be any different Factors The 200 day EMA sits right around the 164.25 level. And if we can break above that, then I think a lot of technical traders will look at that as a sign to have a go at this particular trade. You do get paid at the end of every day to own this position. So that makes sense as well. And with that being the case, I am looking for buying opportunities, not shorting opportunities. I think this is the way longer-term as well.Top Forex Brokers1 Get Started 74% of retail CFD accounts lose money Underneath, I see quite a bit of support near the 160 yen level, and that has been backed up by trading over the last couple of weeks. So, I think you have a situation where short-term pullbacks will continue to attract buyers into this market, trying to take advantage of what could be a rather big move. The question of course is, will it ever pick up serious momentum? I don’t know, but I think a grind to the upside makes more sense than not in this situation, as well as almost any other currency denominated in yen.Ready to trade our daily forex forecast? Here are the best forex brokers in Japan to choose from.
MENAFN03092024000131011023ID1108632377

Legal Disclaimer:
MENAFN provides the information “as is” without warranty of any kind. We do not accept any responsibility or liability for the accuracy, content, images, videos, licenses, completeness, legality, or reliability of the information contained in this article. If you have any complaints or copyright issues related to this article, kindly contact the provider above.