The main category of Forex News.
You can use the search box below to find what you need.
[wd_asp id=1]
The main category of Forex News.
You can use the search box below to find what you need.
[wd_asp id=1]
The EUR/USD pair fell to 1.1072 early on Thursday, bouncing just modestly from the level and trading near such a low ahead of the United States (US) opening. The US Dollar gathered momentum during European trading hours, as a sour sentiment dominated the first half of the day.
NVIDIA, the leading AI and chip giant, reported earnings after Wednesday’s close, which beat expectations, yet shares fell roughly 8% after the news. Analysts attributed the decline to the fact that revenue guidance for the current quarter missed some estimates, while the company reported that it was facing difficulties in developing a new generation of chips.
Asian indexes closed in the red, but European ones shrugged off the dismal mood and hold in the green, halting the USD advance.
Data-wise, Germany released the preliminary estimates of the August inflation data, which surprised investors by falling more than anticipated. The Consumer Price Index (CPI) rose 1.9% YoY, below the 2.1% anticipated, while the CPI was down 0.1% compared to the previous month. The broader Harmonized Index of Consumer Prices (HICP) increased by 2.0% in the year to August and fell by 0.2% compared to July.
Across the Atlantic, the US published Initial Jobless Claims for the week ended August 23, which decreased to 231K, beating expectations. At the same time, the second estimate of the Q2 Gross Domestic Product (GDP) was upwardly revised to 3% from the previous estimate of 2.8%. The encouraging data provided additional support to the USD.
The daily chart for the EUR/USD pair suggests more slides are on the docket. The pair fell for a second consecutive day, resulting in technical indicators heading firmly south, although still above their midlines. The bearish momentum, however, remains the same. At the same time, the 20 Simple Moving Average (SMA) maintains its bullish slope, providing dynamic support at around 1.1020. A break below the latter should fuel selling.
In the near term, and according to the 4-hour chart, the downward momentum eased, but the risk remains skewed to the downside. Technical indicators are stabilizing near oversold readings, still far from suggesting downward exhaustion. Meanwhile, the 20 SMA has turned lower well above the current level, acting as dynamic resistance at around 1.1145.
Support levels: 1.1065 1.1020 1.0985
Resistance levels: 1.1110 1.1145 1.1190
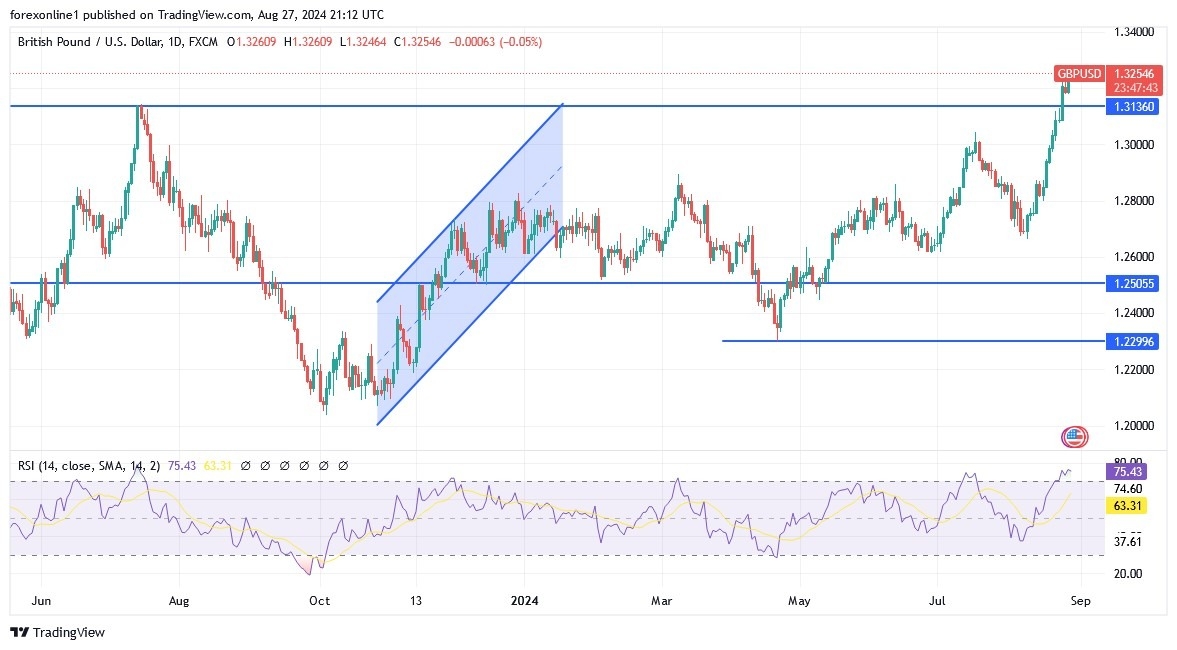
Overall, US equity markets seem poised to start the day on a decline, but German and British markets are recovering and rising by about half a percent each. Obviously, that’s indicating demand for European assets that is helping the Pound Sterling. Commenting on this, a note from the JPMorgan forex trading desk states: “Despite all my doubts, the Pound Sterling continues to trade like a rock star as we easily exit the triple top at 1.3145 after Jerome Powell’s comments.”
According to forex market trading, the GBP/USD rose last Friday after Powell showed a clear intention to cut US interest rates in September, as financial markets were surprised by the extent of his commitment to this move. Previously, the Federal Reserve had insisted that it would move cautiously on cutting US interest rates, but Powell’s speech seemed like a “pause” moment.
In fact, financial markets have seen good odds that the Federal Reserve will start the cut cycle with a large 50 basis point hike, which was still seen as an unlikely scenario before his speech. Consequently, the result is a selling of the US dollar that extends into Tuesday and takes the GBP/USD pair to a new high for 2024 at 1.3260.
According to technical analysis, there is not much on the upside for the GBP/USD pair in terms of levels, except for a secondary pivot zone at 1.3275/00. Also, we struggle to reinvest meaningfully in the Pound Sterling here, and we acknowledge that declines towards the 1.3145 pivot should be bought in the coming sessions.
The Pound Sterling is also supported by Bank of England Governor Andrew Bailey’s speech last Friday, in which he said it is too early to say that the battle against inflation is over, indicating that the bank will not be in a hurry to cut interest rates again. According to analysts, Bailey seems relatively comfortable about inflation, and we have seen the first decline in the BRC in nearly three years, but falling prices are treated as a boon for the currency.
The British Retail Consortium (BRC) said its measure of shop price changes showed prices fell by 0.3% in August, down from +0.2% in July. Moreover, this is below the three-month average of 0.0%, and annual shop price growth remained at its lowest level since October 2021. UK inflation has been falling since 2023, but this means that the pace of increase has only been slowing. Furthermore, the outright falls in prices offer relief to shoppers as the absolute level of goods resulting from a period of abnormal inflation can begin to fall and boost purchasing power.
On the other hand, the yield on 10-year UK bonds is falling. According to electronic trading, the yield on 10-year UK bonds has fallen to 3.95% as investors expect lower interest rates. Earlier in August, the Bank of England cut its benchmark interest rate by 25 basis points to 5%, with markets expecting further cuts of 41 basis points by the end of the year. However, better-than-expected UK economic data and cautious comments from Bank of England Governor Andrew Bailey about further rate cuts have tempered these expectations.
Meanwhile, British Prime Minister Keir Starmer has highlighted the long road ahead to address the issues he attributes to the previous Conservative government, warning that conditions could worsen before they improve. In the United States, weak economic data and comments by Federal Reserve Chairman Jerome Powell have fuelled speculation of future interest rate cuts by the Fed.
On the stock trading platforms front, British stocks paused after four days of gains. According to trading, the FTSE 100 index fluctuated between small gains and losses on Wednesday after four days of gains, as investors exercised caution ahead of Nvidia’s quarterly results, which could impact the AI-driven global stock rally. Among individual stocks, Kingfisher shares fell 2% after Citigroup downgraded it to “neutral” from “buy.” Prudential shares fell 1% after reporting weaker performance in China and Indonesia. On the positive side, the pharmaceutical sector gained, with GSK shares rising 2%. GSK, along with other pharmaceutical companies, is resuming in Delaware to end more than 70,000 lawsuits alleging that the discontinued heartburn drug Zantac causes cancer. Direct Line Insurance shares rose 1.2% after Citigroup upgraded it to “neutral” from “buy,” boosting non-life insurers.

Based on the daily chart performance, the overall trend of the GBP/USD pair remains bullish. However, it’s crucial to consider that today’s US economic data results will significantly impact the sentiment towards the continued weakness of the US dollar. If the data is negative, it could reverse the pair’s direction and turn it bearish, requiring a break below the support level of 1.3045
Ready to trade our Forex daily forecast? We’ve shortlisted the best regulated forex brokers UK in the industry for you.
In contrast, Bank of Japan Governor Kazuo Ueda told parliament last week that the BOJ could adjust monetary policy if its economic outlook holds, signaling a willingness to raise interest rates again. BOJ Deputy Governor Ryozo Himeno echoed that sentiment this week, saying the central bank would raise rates if the economy and prices continued on their current path.
On the stock trading front, Japanese stocks rose as Nvidia earnings awaited. The Nikkei 225 index of Japanese shares rose 0.22% to close at 38,372, while the broader TOPIX index rose 0.42% to close at 2,692 on Wednesday. Furthermore, Japanese stocks rose for a second straight session as investors looked ahead to Nvidia’s earnings report that could fuel a further rise in technology and artificial intelligence. Also, local stocks benefited from a weaker yen as investors continued to assess the Bank of Japan’s monetary policy outlook. Recently, BOJ Deputy Governor Ryozo Himino said the central bank would adjust the degree of monetary easing if the outlook for economic activity and prices improves. Strong performances were seen from index heavyweights Toyota Motor Corp (3.9%), Disco Corp (1.4%), Advantest (4.2%), Sony Group (2.3%) and Hitachi (2.5%). Additionally, Rakuten Group shares rose 9.2% after Morgan Stanley and Citi raised their price targets for the Japanese technology company.
On the economic front, Japan’s index of coincident economic indicators, which covers a range of data such as factory output, employment and retail sales, was revised down to 113.2 in June 2024 from a preliminary reading of 113.7. The figures followed May’s reading of 117.1, indicating the lowest level since February while maintaining a “stop falling” assessment, as the economy continues to recover moderately despite growing global headwinds, particularly from China, the US and Europe.
Meanwhile, Japanese consumer prices are expected to rise after energy subsidies were fully ended in May while the Bank of Japan has begun to consider policy normalization amid a weaker currency.
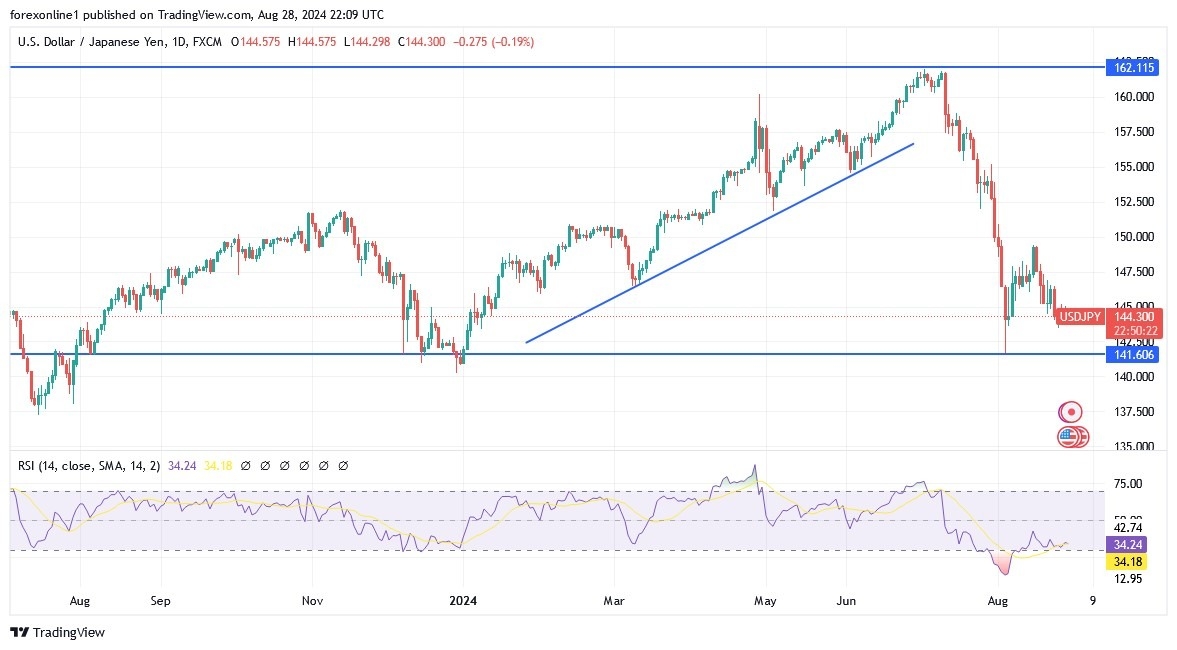
According to the performance on the daily chart, the general trend of the USD/JPY price is still bearish. Also, investors do not care about the technical indicators moving towards strong oversold levels as much as they care about what is being said by global central bank officials regarding the future of raising interest rates or not. Currently, the closest important support levels for trading the USD/JPY are 142.60 and 141.00 respectively. Today’s US economic data: GDP growth and weekly jobless claims.
Ready to trade our USD/JPY Forex analysis? We’ve made a list of the best forex demo accounts worth trading with.
The EUR/USD forecast points south as the dollar rallies ahead of GDP and inflation data. As Middle East tensions escalate, the dollar has recovered from recent lows due to safe-haven demand. Meanwhile, ECB policymakers are getting comfortable with a rate cut in September.
-Are you interested in learning about forex live calendar? Click here for details-
The dollar was initially weak after Powell’s speech on Friday, which solidified bets for a September Fed rate cut. However, the trend reversed this week as tensions in the Middle East had investors rushing for the greenback. The Gaza war has grown, and prospects of a ceasefire agreement have dimmed. The dollar tends to rise in times of global uncertainty.
However, downward pressure remains as investors fully price a Fed pivot in September. Incoming data might alter expectations for the size of rate cuts. Currently, there is a higher chance of a 25-bps rate cut. However, further economic weakness and easing price pressure could lead to a more significant rate cut.
Market participants expect GDP data today to show the economy’s state. Recent GDP figures have shown resilience, so an unexpectedly poor figure could boost rate-cut expectations. At the same time, the US will release its PCE price index on Friday, showing the state of inflation.
Meanwhile, ECB policymakers are ready to start lowering borrowing costs in September. However, some, like Klaas Knot, remain cautious, saying more data is needed to confirm the rate cut.
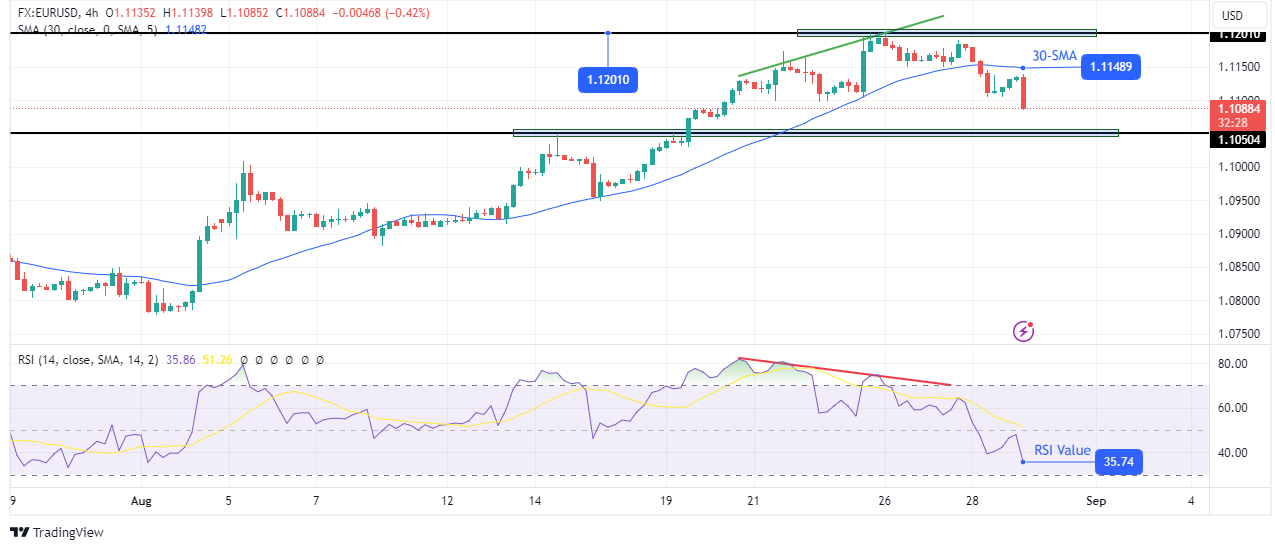
On the technical side, the EUR/USD price is collapsing after breaking below and retesting the 30-SMA. This is a sign that bears have taken charge and reversed the trend. The previous bullish trend peaked at the 1.1201 resistance level, where bullish momentum weakened.
-Are you interested in learning about forex signals? Click here for details-
Notably, the RSI made a bearish divergence, showing fading momentum as the price made higher highs. Eventually, bears overpowered bulls, pushing the price below the 30-SMA. At the same time, the RSI dipped below 50 to trade in bearish territory. The price might soon reach the 1.1050 support level due to the strong bearish bias.
Looking to trade forex now? Invest at eToro!
68% of retail investor accounts lose money when trading CFDs with this provider. You should consider whether you can afford to take the high risk of losing your money.
Gold price is attempting a minor recovery while holding within this week’s familiar range, having regained $2,500 early Thursday. Gold price capitalizes on broad risk aversion, as traders now shift their focus to the second estimate of the US Gross Domestic Product (GDP) and Pending Home Sales data due later this Thursday.
In the meantime, they assess the American AI giant’s, Nvidia, earnings report alongside hawkish comments from Atlanta Federal Reserve (Fed) Bank President Raphael Bostic. Both these events have contributed to the extension of risk-off flows into Asian trading.
Nvidia shares tanked 7% in post-market trading, despite a 122% revenue growth and $50 billion buyback, as the company’s sales forecast disappointed the lofty market expectations. The chipmaker said that revenue for the ongoing quarter would be $32.5 billion, lower than the average analyst estimate of $37.9 billion. Further, Nvidia’s gross margin fell to 75.1% from 78.4% in the previous quarter.
Early Thursday, Atlanta Fed Chair Bostic pushed back against the first interest rate due likely in September, noting that “inflation has come down faster than expected, unemployment has risen farther than thoughts. This means we should pull forward rate cut to third-quarter.”
“It would not be good to cut rates only to have to raise them again,” he added. Markets continue to price in a 35% chance that the Fed will lower rates in September by 50 basis points (bps) while the odds for a 25 bps cut stand at 65%, according to CME Group’s FedWatch Tool.
The hawkish Fed commentary seems to have little to no impact on the market’s pricing of the Fed’s interest-rate outlook, aiding the rebound in the Gold price. A broad-based US Dollar retreat alongside the US Treasury bond yields also bodes well for Gold price heading into the US Q2 GDP second estimate.
US Annualized GDP is expected to hold steady at 2.8% QoQ in Q2, the second estimate will likely show.
The short-term technical outlook for Gold price remains more or less the same, with a fresh push higher in the offing while above the triangle resistance-turned-support at $2,469.
The 21-day Simple Moving Average (SMA) closes in on that level, making it a strong support.
Gold price confirmed an upside break from a symmetrical triangle a couple of weeks ago.
Meanwhile, the 14-day Relative Strength Index (RSI) turns north again above 50, currently near 62, suggesting that there is more room for upside.
Gold buyers need to recapture the record high of $2,532 to take on the next key barrier at the $2,550 level.
Acceptance above the latter could challenge the $2,600 round level en route to the triangle target, measured at $2,660.
Alternatively, the initial demand area is seen at the $2,500 threshold for Gold buyers, below which Friday’s low of $2,485 will be challenged.
A sustained breach of the latter could expose the downside toward the abovementioned triangle resistance-turned-support at $2,469.
The real Gross Domestic Product (GDP) Annualized, released quarterly by the US Bureau of Economic Analysis, measures the value of the final goods and services produced in the United States in a given period of time. Changes in GDP are the most popular indicator of the nation’s overall economic health. The data is expressed at an annualized rate, which means that the rate has been adjusted to reflect the amount GDP would have changed over a year’s time, had it continued to grow at that specific rate. Generally speaking, a high reading is seen as bullish for the US Dollar (USD), while a low reading is seen as bearish.
Spot Gold fell to $2,493.46 on Wednesday, retaining the negative tone in the American session but still trading in the red on a daily basis. The US Dollar gained some footing after reaching oversold conditions against most major rivals. The US Dollar Index (DXY) fell to a fresh YTD low of 100.52, meeting buyers near the critical threshold.
XAU/USD is purely moving on sentiment, as the macroeconomic calendar remained scarce. The focus remains on upcoming inflation figures, as the United States (US) will release the July Personal Consumption Expenditures (PCE) Price Index next Friday, the Federal Reserve’s (Fed) favourite inflation gauge. Market participants have also turned cautious ahead of NVIDIA earning reports, scheduled for after the market’s close. The AI giant is expected to report revenue growth of over 70% in the current quarter, and any divergence will likely spur some wild action early in Asia, exacerbated by the limited volumes at that time of the day.
Other than that, Wall Street trades in the red, unable to follow the lead of its overseas counterparts, while government bond yields remain stable near their August lows. At the time being, the 10-year Treasury note offers 3.83%.
From a technical point of view, the XAU/USD pair seems poised to extend its slide. The bright metal ended a three-day winning streak, retaining modest weekly gains. Technical indicators in the daily chart, however, gain downward traction within positive levels, supporting a steeper corrective decline. At the same time, the 20 Simple Moving Average (SMA) is losing its bullish strength at around $2,467.00, a potential bearish target. Finally, the longer moving averages maintain their upward slopes far below the shorter one, suggesting the long-term bullish trend remains intact.
XAU/USD briefly recovered the $2,500 level early in the American session but resumed its decline afterwards, in line with another leg lower. Technical readings in the 4-hour chart suggest the pair can fall further, as it keeps posting red candles below a now flat 20 SMA. Even further, the Momentum indicator heads south almost vertically within negative levels, while the Relative Strength Index (RSI) indicator heads firmly south at around 43.
Support levels: 2,508.80 2,496.40 2,485.10
Resistance levels: 2,523.50 2,531.60 2,542.00
(MENAFN– Daily Forex)
The euro initially did rally against the yen during the trading session on Tuesday but has been completely wiped out at this point.
Late in the day in New York, we are trading near the 161 yen level, and I am watching the 160 yen level because a breach of that to the downside could end up being a very negative turn of events.
In that environment, I imagine the Japanese Yen is probably picking up strength against most things.
On the other hand, if we turn around and break above the 164 Yen level then we would not only clear the most recent consolidation, but we would also clear the 200 day EMA both of which would capture a lot of attention. Keep in mind that this is more or less about the Japanese Yen.Top Forex Brokers1 Get Started 74% of retail CFD accounts lose money With that being the case, I think you’ve got a situation where you need to watch other pairs such as the US dollar against the Japanese yen or the New Zealand dollar against the Japanese yen. Granted, I think the euro’s overbought against several currencies right now. So, it may not be the big mover when it comes to a reverse the Japanese yen’s fortunes. But really, at this point, it should move in the same direction. Back and Forth is the Norm?All things being equal, this is a market that I think continues to see a lot of back and forth and choppiness and this 400 point range. Keep in mind we recently sold a massive number of positions in the market. So, I think it makes a lot of sense that we have to stabilize and probably see a lot of trouble between now and any type of recovery as far as hanging on to a position. This is a very noisy thing to go through. That being said, if we break down below the 160 yen level, then it’s likely that we go to the 155 yen level underneath.Ready to trade our daily Forex analysis? We’ve made a list of the best forex demo accounts worth trading with.MENAFN28082024000131011023ID1108612184

Before natural gas can advance to test higher areas of potential resistance it first needs to first breakout above a potentially formidable price zone from around 2.25 to 2.30. It includes the recent swing high of 2.30 and an earlier interim swing high of 2.27. The price zone begins with the 50-Day MA (orange) at 2.25 and is joined by the 200-Day MA (blue) at 2.28. Whether upward momentum can continue in the near-term or the price of natural gas consolidates further with the recent price range.
As of this week’s new trend low, there is potential expanding triangle (purple) taking shape. It is a consolidation pattern where the price range expands rather than contracts, such as in a symmetrical triangle. As it expands false breakouts may be experienced either at the bottom or top of the pattern. Currently, the price range is from yesterday’s low of 1.875 to the 2.30 prior swing high.
This week’s low of 1.875 had natural gas down by 40.65% from the June swing high of 3.16. That is a healthy correction that stalled around the 78.6% retracement zone (1.92). However, it exceeds all but one of the bearish corrections that have occurred since February 2023. The largest was a decline of 55.0% from the January swing highs. Also, notice that there is a bullish divergence with the relative strength index (RSI) momentum oscillator, which is a bullish indication.
If natural gas can get above the 2.30 swing high and stay above it, it will have a chance to eventually test resistance around the top trendline. Other interim potential targets are lower starting with the 38.2% Fibonacci retracement at 2.37, and the 50% retracement of 2.52.
For a look at all of today’s economic events, check out our economic calendar.
Important DisclaimersThe content provided on the website includes general news and publications, our personal analysis and opinions, and contents provided by third parties, which are intended for educational and research purposes only. It does not constitute, and should not be read as, any recommendation or advice to take any action whatsoever, including to make any investment or buy any product. When making any financial decision, you should perform your own due diligence checks, apply your own discretion and consult your competent advisors. The content of the website is not personally directed to you, and we does not take into account your financial situation or needs.The information contained in this website is not necessarily provided in real-time nor is it necessarily accurate. Prices provided herein may be provided by market makers and not by exchanges.Any trading or other financial decision you make shall be at your full responsibility, and you must not rely on any information provided through the website. FX Empire does not provide any warranty regarding any of the information contained in the website, and shall bear no responsibility for any trading losses you might incur as a result of using any information contained in the website.The website may include advertisements and other promotional contents, and FX Empire may receive compensation from third parties in connection with the content. FX Empire does not endorse any third party or recommends using any third party’s services, and does not assume responsibility for your use of any such third party’s website or services.FX Empire and its employees, officers, subsidiaries and associates, are not liable nor shall they be held liable for any loss or damage resulting from your use of the website or reliance on the information provided on this website.Risk DisclaimersThis website includes information about cryptocurrencies, contracts for difference (CFDs) and other financial instruments, and about brokers, exchanges and other entities trading in such instruments. Both cryptocurrencies and CFDs are complex instruments and come with a high risk of losing money. You should carefully consider whether you understand how these instruments work and whether you can afford to take the high risk of losing your money.FX Empire encourages you to perform your own research before making any investment decision, and to avoid investing in any financial instrument which you do not fully understand how it works and what are the risks involved.
Overall, the EUR/USD pair rally makes it overbought according to the Relative Strength Index (RSI), which is now at 70. Technically, the exchange rate was certainly overbought last week. Also, the relatively flat trading in the EUR/USD pair on Monday and into Tuesday allowed some overbought conditions to ease.
Consequently, this serves as a reminder that the RSI can reverse from overbought at a stable exchange rate and does not necessarily signal a pullback. The overarching theme we’re looking for at the end of the month is a more subdued EUR/USD price action, with recent highs likely to be out of reach for now.
Commenting on the performance of the most traded pair in the forex market, analyst Sean Osborne at Scotia Bank sees another technical signal indicating near-term exhaustion. Although his thesis is that the near-term weakness will prove limited. The analyst said, “Short-term trading patterns suggest that the euro price may have peaked in overnight trading after forming a bearish ‘evening star’ pattern on the 6-hour charts. Minor losses through quiet European trading tend to confirm this development. But losses are likely to remain limited in the near term at least.”
According to reliable trading platforms, the Euro rose sharply against the US Dollar on Friday after Federal Reserve Chairman Jerome Powell effectively gave the green light to cut US interest rates in September: Powell said in a speech at the Jackson Hole symposium, “The time has come to adjust policy.”
The speech was a surprise because it repeatedly pointed to concerns that the Labor market was at risk of deterioration, suggesting that the Fed needed to cut US interest rates to protect jobs. Furthermore, Financial markets had raised expectations that the Fed could start the US rate-cutting cycle with a large 50 basis point cut.
Overall, the US dollar’s trading this week will be determined by the evolution of expectations for a 50-basis point rate cut: if expectations increase, the euro could rise against the US dollar (EUR/USD). If expectations fade, the exchange rate could fall again. The highlight of the economic data will be the release of the personal consumption expenditures deflator on Friday, a measure of inflation that affects consumers. The US Federal Reserve tends to watch it closely, but we think there is limited opportunity for some kind of surprise that could change the broader narrative.
In his speech at Jackson Hole, Jerome Powell added that he is confident that US inflation will not return suddenly and that it is now more focused on the Labor market. Obviously, this suggests that the release of the US Non-Farm Payrolls report in early September will be the next major event for the US dollar.
The next major data release in the US will be the US jobs report on Friday. However, be aware that we are also approaching the end of the month. This can lead to some unusual non-news Forex market movements, and we will not see any unusual moves as a sign that current trends are changing.
On the stock exchanges front, European stocks were generally higher on Tuesday, recovering from yesterday’s subdued session as financial markets continued to assess the latest economic data and gauge potential responses from major central banks. According to trading, the euro zone’s STOXX 50 index rose 0.2% to more than 4,900, while the pan-European STOXX 600 index added 0.3% to approach the 520 thresholds, its highest level in more than a month. Recently, it has been supported by major mining stocks in the broader index as the London Stock Exchange reopened after a longer weekend.
According to an economic announcement, German consumer confidence as measured by GfK unexpectedly fell to its lowest level since May, underscoring the weak sentiment in the currency bloc’s largest economy after yesterday’s poor Ifo results. However, financial stocks rebounded with Santander, BNP Paribas, Munich Re and Allianz adding between 1.3% and 0.5%. Automakers also rose, led by Stellantis, BMW and Mercedes. Elsewhere, technology stocks continued to fall, with ASML down 0.5% ahead of Nvidia earnings today.
Ready to trade our daily Forex forecast? Here’s a list of some of the top forex brokers in Europe to check out.