The main category of Forex News.
You can use the search box below to find what you need.
[wd_asp id=1]
The main category of Forex News.
You can use the search box below to find what you need.
[wd_asp id=1]
Furthermore, you need to keep in mind that the European Central Bank is also loose with its monetary policy, so even if the Federal Reserve does start cutting rates, which most people think that they will in September, the reality is that we still have a couple of central banks that are both soft and weak. If that is going to be the case, then you’ve got a scenario where this is a market that will more likely than not be looking for some type of range to trade in.

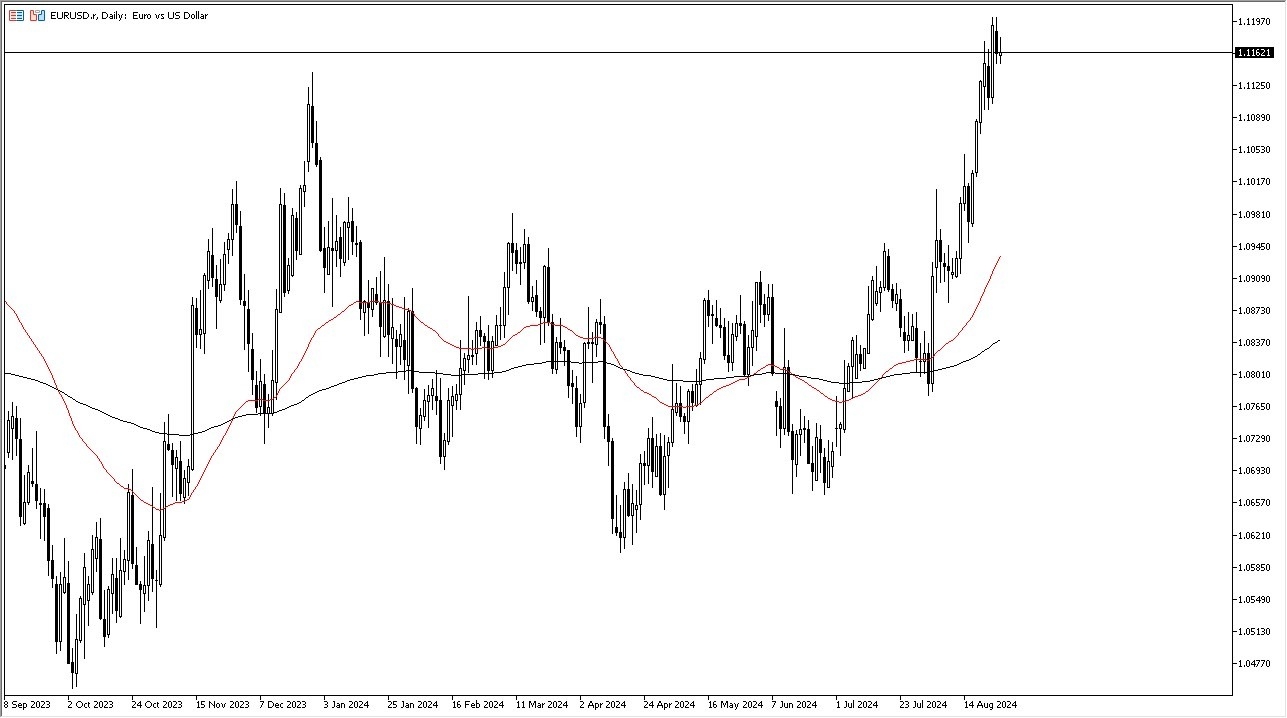
Do not get me wrong, the technical analysis for the EUR/USD pair at the moment is rather bullish. We have had the “golden cross” when the 50-Day EMA crosses above the 200-Day EMA indicator, and that of course has longer-term traders excited. However, the reality is that there is a ton of resistance between the 1.12 level in the 1.1250 level above. Furthermore, we are about 6 country miles from the 50-Day EMA, so we are most certainly overstretched by applying the “eye test.”
If we do pull back from here, I would anticipate that there will probably be a certain amount of value hunters out there looking to pick up “cheap euros.” However, I still have to question how much more upside we have in this type of environment, due to the fact that we have gotten so far in such a short amount of time. Ultimately, I think this is a scenario where the markets are going to try to find their “equilibrium”, and I don’t think we have found it quite yet.
Ready to trade our Forex daily analysis and predictions? Here are the best European brokers to choose from.
Quiet trading extends on Tuesday, with Gold changing hands at around $2,510 a troy ounce. The bright metal is confined to a tight intraday range as expectations mount for the upcoming United States (US) inflation figures to be out on Friday. The country is set to release the Personal Consumption Expenditures (PCE) Price Index, the Federal Reserve’s (Fed) favorite inflation gauge. Price pressures in the US remain above the Fed’s 2% goal but far from the four-decade high hit in mid-2022.
But it is not just about receding inflation. The labor market has finally shown signs of loosening, meaning wages-related risks have decreased. In the meantime, the economy keeps growing at a relatively healthy pace, all of which backs an interest rate cut. Chairman Jerome Powell and co have spent the last month hinting towards a shift in the current monetary policy, reinforcing the idea of a new cycle coming when he spoke at the Jackson Hole Symposium last week. Hopes the Fed will trim rates in September maintain the US Dollar under pressure.
Meanwhile, United States (US) data beat expectations. The Conference Board’s (CB) Consumer Confidence Index rose to 103.3 in August, while the July figure was upwardly revised to 101.9 from 100.3. Furthermore, the Expectations sub-index improved to 82.5, while the July reading was revised to 81.1, marking the second consecutive month of the Index above 80. A reading below the latter usually signals a recession ahead.
From a technical point of view, the risk for XAU/USD remains scheduled to the upside. The daily chart for the pair shows it keeps developing above all its moving averages, with the 20 Simple Moving Average (SMA) maintaining its upward slope well above also bullish 100 and 200 SMAs. Technical indicators, in the meantime, have lost their upward strength but consolidate near overbought readings, falling short of suggesting an upcoming decline.
In the near term, and according to the 4-hour chart, XAU/USD is neutral-to-bullish. A flat 20 SMA keeps providing intraday support, while the 100 and 200 SMAs grind north far below the current level. Technical indicators, however, stand right above their midlines without clear directional strength. The risk of a steeper decline seems limited, but the lack of progress could force some profit-taking and send Gold below the $2,500 mark.
Support levels: 2,508.80 2,496.40 2,485.10
Resistance levels: 2,523.50 2,531.60 2,542.00
Silver’s price consolidated for the second straight day, within the $29.70-$30.10 area on Tuesday, yet printed gains of 0.24%. At the time of writing, XAG/USD trades at $29.96.
The XAG/USD trades above the confluence of the 50- and 100-day moving averages (DMAs), an indication of buyer strength. Still, Silver’s uptrend seems stretched, with bills failing to achieve a daily close above $30.00.
Momentum supports buyers yet shows that they’re losing steam, as the Relative Strength Index (RSI) shows.
Silver’s uptrend will continue once buyers reclaim the August 26 peak at $30.18. Once surpassed, the next resistance would be the $30.50 figure, followed by the July 17 swing high at $31.42.
Conversely, if XAG/USD sellers keep prices below $30.00, this will expose the confluence of the 50 and 100-DMAs at around $29.22-$29.13, ahead of the $29.00 figure.
Silver is a precious metal highly traded among investors. It has been historically used as a store of value and a medium of exchange. Although less popular than Gold, traders may turn to Silver to diversify their investment portfolio, for its intrinsic value or as a potential hedge during high-inflation periods. Investors can buy physical Silver, in coins or in bars, or trade it through vehicles such as Exchange Traded Funds, which track its price on international markets.
Silver prices can move due to a wide range of factors. Geopolitical instability or fears of a deep recession can make Silver price escalate due to its safe-haven status, although to a lesser extent than Gold’s. As a yieldless asset, Silver tends to rise with lower interest rates. Its moves also depend on how the US Dollar (USD) behaves as the asset is priced in dollars (XAG/USD). A strong Dollar tends to keep the price of Silver at bay, whereas a weaker Dollar is likely to propel prices up. Other factors such as investment demand, mining supply – Silver is much more abundant than Gold – and recycling rates can also affect prices.
Silver is widely used in industry, particularly in sectors such as electronics or solar energy, as it has one of the highest electric conductivity of all metals – more than Copper and Gold. A surge in demand can increase prices, while a decline tends to lower them. Dynamics in the US, Chinese and Indian economies can also contribute to price swings: for the US and particularly China, their big industrial sectors use Silver in various processes; in India, consumers’ demand for the precious metal for jewellery also plays a key role in setting prices.
Silver prices tend to follow Gold’s moves. When Gold prices rise, Silver typically follows suit, as their status as safe-haven assets is similar. The Gold/Silver ratio, which shows the number of ounces of Silver needed to equal the value of one ounce of Gold, may help to determine the relative valuation between both metals. Some investors may consider a high ratio as an indicator that Silver is undervalued, or Gold is overvalued. On the contrary, a low ratio might suggest that Gold is undervalued relative to Silver.
Nevertheless, natural gas has been falling for six straight days. It may run out of bearish momentum and yet find support that leads to a bullish reversal around the lows. There are no signs of that yet, but a rally above today’s high of 1.97 may signal a bottom and could lead to a test of higher price levels. Following a rally above today’s high natural gas will be heading towards this week’s high of 2.02, followed by the 20-Day MA at 2.09.
On the downside, a decisive decline below today’s low of 1.875 signals a continuation of the bear trend. Whether the downside momentum stalls or accelerates at that point remains to be seen. Supportive of a bearish continuation are the moving averages. Notice that the orange 50-Day MA broke below the blue 200-Day MA yesterday, a sign that the decline is weakening.
The first area to watch for support would then be around a prior interim swing high at 1.85 from April 23. A little lower is the 88.6% Fibonacci retracement of the larger uptrend that began from the April swing low at 1.58. Depending on when it is reached the 88.6% level will likely be nearby potential support represented by the lower uptrend line.
Despite today’s bearish behavior, natural gas is on track to close above the prior swing low of 1.88. That may provide little comfort to the bulls, but it does provide a small indication that buyers may be returning.
For a look at all of today’s economic events, check out our economic calendar.
(MENAFN) Goldman Sachs has adjusted its forecast for brent crude oil prices for 2025, lowering its average price expectation and narrowing its price range by USD5 per barrel. The bank now anticipates that Brent crude will average USD77 per barrel in 2025, down from a previous forecast of USD82. The revised price range for Brent crude is now set between USD70 and USD85 per barrel. This adjustment comes in response to unexpected increases in oil inventories and a slowdown in demand from China, which are both expected to exert downward pressure on oil prices. Despite this, Goldman Sachs noted that demand from India and lower interest rates are helping to mitigate the extent of the price decline.
In addition, Goldman Sachs highlighted that U.S. oil supplies are surpassing earlier expectations, while demand growth in China has cooled. This shift has contributed to the adjustment in price forecasts. The Organization of the Petroleum Exporting Countries (OPEC) has also revised its global oil demand growth forecast for the coming year, reducing it to 1.78 million barrels per day from an earlier estimate of 1.85 million barrels per day. Goldman Sachs remains optimistic that OPEC will increase production in the fourth quarter.
OPEC+—which includes OPEC members and allies such as Russia—has been implementing a series of production cuts since late 2022 to stabilize the market. Most of these cuts are set to remain in effect until the end of 2025. On August 1, OPEC+ announced plans to begin unwinding the most recent round of cuts, totaling 2.2 million barrels per day, starting in October. However, these reductions may be paused or reversed if market conditions necessitate such measures. Recently, oil prices have experienced volatility, with a recent decline following a rise of more than 7 percent over three sessions, driven by concerns over escalating conflicts in the Middle East and disruptions to Libyan oil fields.
MENAFN27082024000045015682ID1108605003

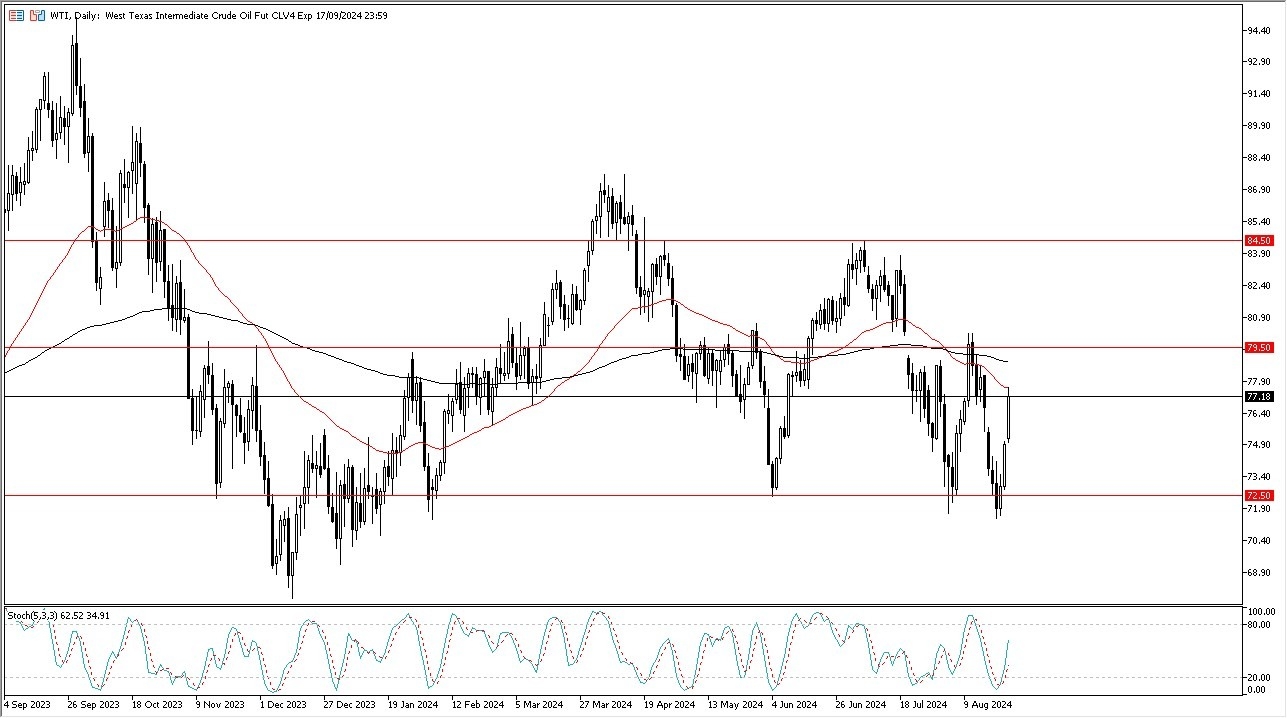
With that being the case, it is showing a little bit of hesitation. However, it’s probably worth noting that the market is going to continue to be very volatile due to the macroeconomic conditions of the wars going on around the world and of course, the fact that Libyans had cut back production. So, with that being said, I think you’ve gotten a situation where traders will continue to look at oil through the prism of extreme volatility and perhaps even the possibility of a lot of concerns about supply. Now, having said that, I do recognize that if the market breaks above the $79.50 level, we could really start to see this market take off. That could open up a move all the way to the $84.50 level, but I also recognize that it is going to take a significant amount of momentum to make that happen.
I think in general we’ve got a situation where traders are going to continue to buy the dip. So, if anything, I would be looking for an opportunity to pick up a little bit of value. I don’t know that I would be a massive holder of the market right now. I think it’s just a scenario where you are looking at short-term pullbacks as short-term opportunities.
As far as some type of massive shift in the overall psyche of the market, I think you probably have some way to go. With this being the case, it is likely going to be a scenario where the oil market will continue to see a lot of questions asked of the trading public as to where we are going to go over the longer term.
Ready to trade the crude oil Forex forecast? Here’s a list of some of the best Oil trading platforms to check out.
This has signaled a decisive shift from targeting inflation to reducing economic weakness, which would mean lowering interest rates. Now, the question for financial markets is whether the US Federal Reserve will go ahead with a decisive 50bp increase in September or start with a 25bp move.
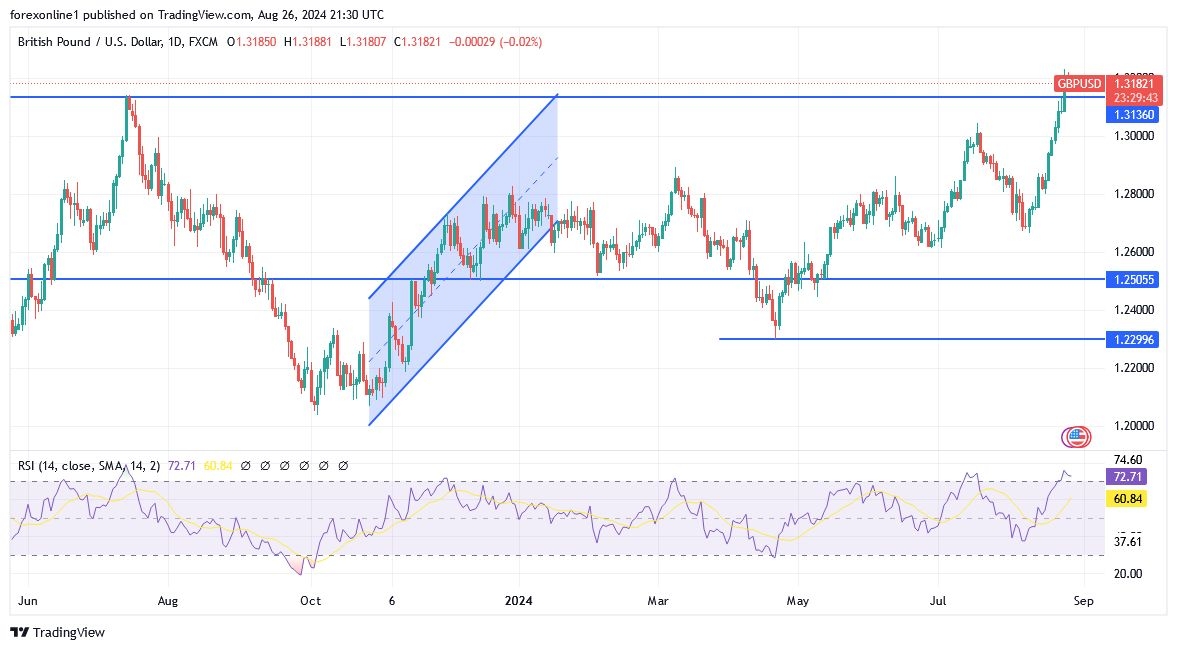
According to reliable trading platforms, the increased likelihood of a strong 50 basis point hike has led to a decline in the US dollar and the GBP/USD exchange rate has risen to a two-year high. Furthermore, this exchange rate is certainly in a technical uptrend and the most obvious way forward in the coming weeks is higher. However, fatigue is growing, and we are seeing signs of overbought conditions on the charts. In particular, the RSI is at 76 and is significantly extended, increasing the likelihood of a pullback this week. There will be no major data from the UK in the next five days, and we believe that the strength of the action will depend largely on how global markets behave.
With that in mind, it is difficult to be anything other than optimistic now that the Fed has given the green light to cut US interest rates with Powell’s speech sounding so “dovish” that he called for a decisive 50 basis point cut in September.
We can expect some overall declines in the markets – and therefore the GBP – in the coming days but ultimately it will be difficult and risky to justify standing in the way of this train. We expect the US dollar to retreat if this week’s data beats expectations and casts doubt on the likelihood of a 50-basis point interest rate hike in September. The highlight will be the release of the US personal consumption expenditures deflator on Friday, a measure of consumer inflation. The Fed tends to watch it closely, but we think there is little chance of a surprise that could change the broader narrative.
For his part, Jerome Powell said in his Jackson Hole speech that he is confident that inflation will not return suddenly and that it is now more focused on the labor market. This suggests that the release of the US non-farm payrolls report in early September will be the next major event for the US dollar.
On the stock trading front, US stock indices faced a volatile session on Monday, with mixed performance across major indexes as investors anticipated upcoming interest rate cuts and focused on Nvidia’s long-awaited earnings report. The Dow Jones closed at a record high while the S&P 500 and Nasdaq 100 fell 0.3% and 1%, respectively, weighed down by losses in technology stocks, especially Nvidia (2.3%) and Tesla (3.2%).
The broader market showed signs of rotating out of technology stocks, with the S&P 500’s energy sector up more than 1%, while technology stocks fell sharply. The shift comes as investors digested a strong signal from Federal Reserve Chairman Jerome Powell that U.S. interest rate cuts are imminent, a move that is expected to impact various sectors differently. Also, investors are looking ahead to earnings reports from Dell, Salesforce, Dollar General and Gap, as well as personal consumption spending data for July on Friday. Meanwhile, the data showed that durable goods orders jumped 9.9% in July, easily reversing a 6.9% decline in June.
Ready to trade our GBP/USD weekly forecast? Here are the best forex trading platforms UK to choose from.
Weaker Chinese oil demand, high inventories, and rising U.S. shale production have prompted Goldman Sachs to reduce its expected range for Brent oil prices by $5 to $70-$85 per barrel.
Commercial inventories have been stable in the peak summer demand season, contrary to expectations of drawdowns, analysts at the Wall Street bank wrote in a note carried by Investing.com.
Higher U.S. supply has been offsetting some of the seasonal demand, according to Goldman Sachs.
Efficiency gains among U.S. producers have raised shale supply by 200,000 barrels per day (bpd) above the investment bank’s expectations.
Higher supply from America, and possibly from OPEC+ later this year and in 2025, has led Goldman Sachs to forecast that Brent Crude prices would average below $80 per barrel next year.
The current forecast is now Brent to average $77 a barrel, as OPEC+ could opt for a strategic move to add supply and punish non-OPEC+ growth, according to Goldman’s note carried by Bloomberg.
OPEC+ could decide to add supply on the market in a move that could be “strategically disciplining non-OPEC supply,” Goldman Sachs’s analysts wrote.
“Prices could significantly undershoot in the short term, especially if OPEC were to strategically discourage US shale growth more forcefully, or if a recession were to reduce oil demand,” the bank’s analysts noted, referring to a scenario in which Brent could trade lower than its price forecast.
Morgan Stanley has also recently revised its oil price forecasts downward, reflecting expectations of increased supply from OPEC and non-OPEC producers amid signs of weakening global demand. The bank now anticipates that while the crude oil market will remain tight through the third quarter, it will begin to stabilize in the fourth quarter and potentially move into a surplus by 2025.
Morgan Stanley has cut its forecast for the fourth quarter to $80 per barrel, down from $85, and now expects prices to gradually decline to $75 per barrel by the end of 2025, slightly lower than their previous estimate of $76.
By Charles Kennedy for Oilprice.com
More Top Reads From Oilprice.com
The EUR/USD pair sees little action on Tuesday, trading in a tight range around the 1.1160 level, as market players await first-tier data scheduled for later in the week. Both the Eurozone and the United States (US) will publish inflation-related figures that could influence upcoming central banks’ decisions.
The market mood is generally positive, although with a dose of caution. Nevertheless and, regardless of the sentiment, the US Dollar remains unattractive as investors keep betting on a Federal Reserve (Fed) interest rate cut in September.
On the other hand, the Euro is having a hard time attracting speculative interest, as local macroeconomic data fails to impress. Germany released the September GfK Consumer Confidence Survey, which contracted to -22 from a revised -18.6 in August. Additionally, the country’s Q2 Gross Domestic Product (GDP) was confirmed at -0.1% QoQ, while the annual estimate was upwardly revised from -0.1% to 0%.
The US will release the June Housing Price Index, while after Wall Street’s opening, the country will publish CB Consumer Confidence, foreseen at 100.9 after printing 100.3 in July.
After closing Monday in the red, the EUR/USD pair trades near the weekly low at 1.1149, with intraday spikes being quickly rejected, somehow suggesting another leg south. Technical readings in the daily chart, however, show the pair is far from bearish. It keeps developing far above all its moving averages, with the 20 Simple Moving Average (SMA) heading firmly north over 100 pips below the current level while well above the 100 and 200 SMAs. At the same time, technical indicators remain directionless well into positive levels, far from suggesting a steeper slide.
The 4-hour chart shows that EUR/USD is pressuring a flat 20 SMA, while the 100 and 200 SMAs maintain their upward slopes well below the shorter one. Finally, technical indicators gyrated lower, gaining downward traction within positive levels. A test of the 1.1100 level seems likely once the aforementioned weekly low gives up, but additional slides are unlikely in the current scenario.
Support levels: 1.1145 1.1100 1.1065
Resistance levels: 1.1210 1.1250 1.1290
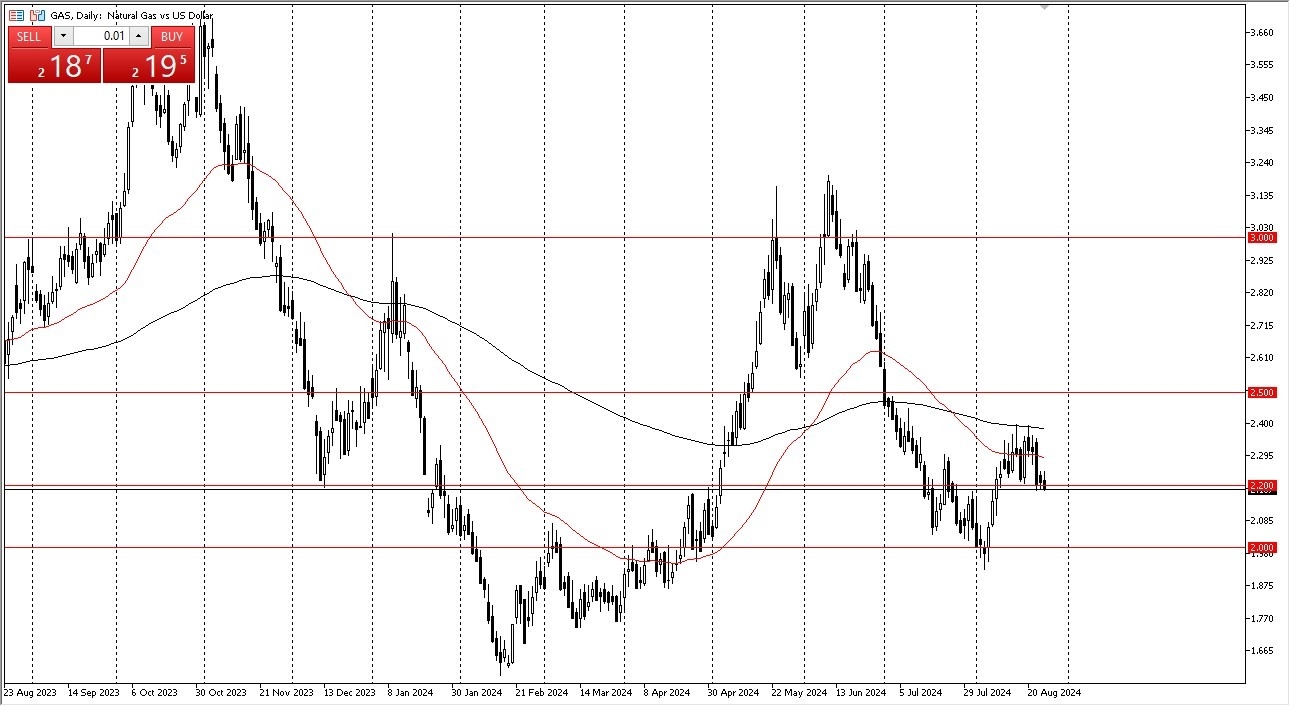
All things being equal, the market were to continue breaking down from here, it could very easily drop to the $2.00 level, which is a large, round, psychologically significant figure, and therefore I think it would make a lot of sense for us to test that area. The $2.00 level is an area that I think will continue to be crucial, as we had bounce from there and of course it is a large, round, psychologically significant figure, and an area where think you would see a lot of options barriers, and of course a lot of traders willing to “step in and pick up value.”
Cyclical trade at this point in time is obvious, and therefore I think a lot of people have to pay close attention to it. The market is likely to continue to see a lot of volatility, but I think at this point in time it’s also worth paying close attention to the idea that we are in the slowest part of the year as far as demand is concerned. That being said, as we get later in the year, it’s likely that natural gas will rally again, as we have seen time and time again. After all, as temperatures drop in the northeastern part of the United States, that does drive up the price and demand of natural gas in general. All things being equal, this is a market that I think is still in the process of bottoming out in trying to find enough support to turn things around.
Ready to trade daily Forex forecast? Here’s a list of some of the best commodities brokers to check out.