The main category of Forex News.
You can use the search box below to find what you need.
[wd_asp id=1]
The main category of Forex News.
You can use the search box below to find what you need.
[wd_asp id=1]
Spot Gold trades with modest gains in the American afternoon, having experienced some early volatility. XAU/USD fell to $2,432.04 ahead of Wall Street’s opening as a batch of United States (US) data pushed speculative interest away from the safe-haven metal. Financial markets welcomed news that US Retail Sales rose by 1% in July, far better than the 0.3% advance anticipated. Furthermore, Initial Jobless Claims rose by less than anticipated in the week ending August 9, up 227K vs the 235K forecast.
The US Dollar surged with the news against all major rivals, while US indexes also advanced, as the numbers spooked fears of a recession while maintaining unchanged the odds for an upcoming Federal Reserve (Fed) interest rate cut. Stock markets remained optimistic after the opening, extending gains to fresh weekly highs, but the USD retreated. The second batch of US data was less encouraging, as Capacity Utilization hit 77.8% in July while Industrial Production in the same month was down 0.6%, both worse than expected and below June figures.
The daily chart for the XAU/USD pair shows it remains within familiar levels, and while trading in the green, it posted a lower high and a lower low, usually seen as a bearish sign. Technical indicators have turned marginally lower but remain within positive levels, limiting the odds of a steeper decline. Finally, the pair keeps developing above all its moving averages, with the 20 Simple Moving Average (SMA) flat above bullish 100 and 200 SMAs. Overall, the case of a steeper leg lower seems unlikely.
In the near term, and according to the 4-hour chart, the pair is neutral-to-bullish. Technical indicators turned higher, but remain at around their midlines. Meanwhile, a mildly bullish 20 SMA provides dynamic resistance a few $ above the current level, while the longer moving averages extended their modest upward slopes below the current level. More relevantly, buyers defend the downside at around the 23.6% Fibonacci retracement of the June/July rally at $2,438.80.
Support levels: 2,438.80 2,4260.90 2,438.80
Resistance levels: 2,471.10 2,483.70 2,495.00
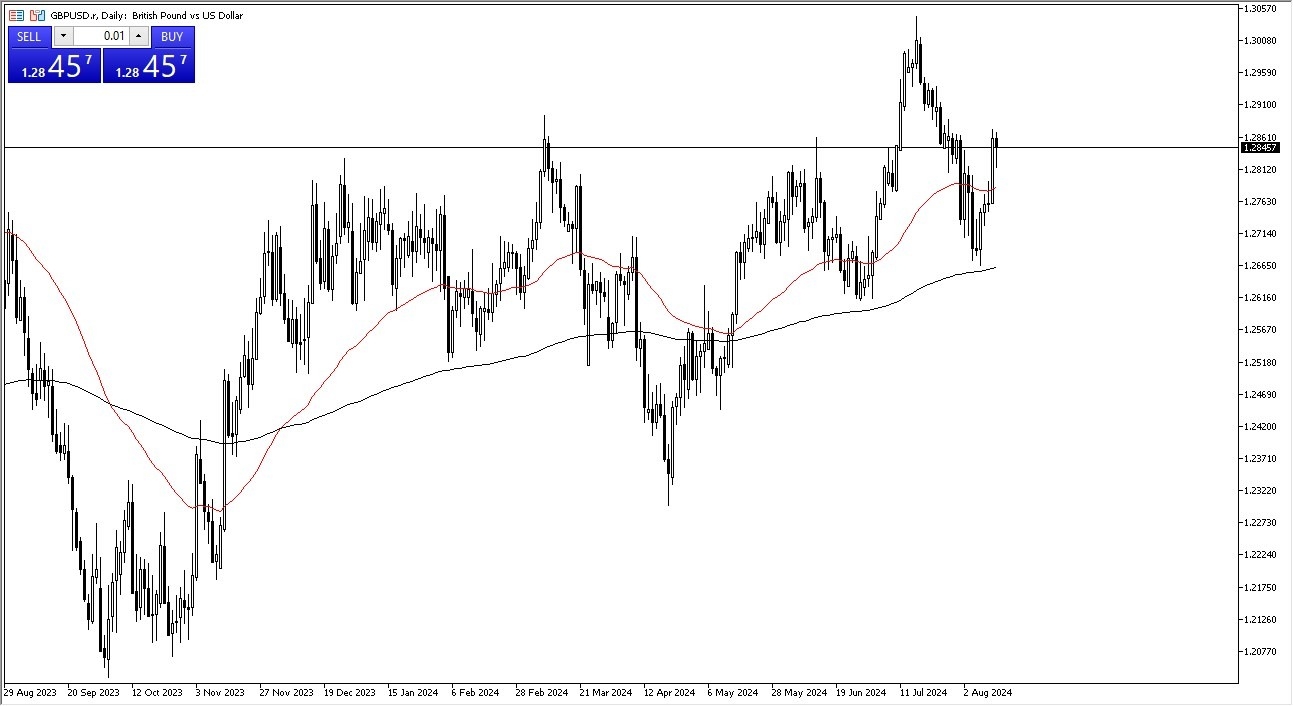
(MENAFN– Daily Forex) The first thing I see is that we had sold off early in the trading session, but we have turned around to show momentum yet again of this, it looks as if the market is going to continue to favor the upside in general, but I am aware that there are a few places that we need to pay close attention to on the chart first place that I am watching with great interest is the 1.2875 region, because we can break above there, then itu0026rsquo;s likely that more momentum will enter the market Sales and Unemployment ClaimsOn Thursday, we will get vital information coming from the United States that could greatly influence where this market goes. While the default scenario at this point in time is that the Federal Reserve cut rates in September, the Retail Sales figures and of course the Weekly Unemployment Claims number could give us a bit of a u0026ldquo;heads upu0026rdquo; as to whether or not the Federal Reserve will continue to cut rates beyond the September meeting. In other words, this is a situation where traders are more likely than not to continue to pay close attention to the directionality of the US economy. Top Forex Brokers 1 Get Started 74% of retail CFD accounts lose money Read Review BrokerGeoLists({ type: u0027MobileTopBrokersu0027, id: u0027mobile-top-5u0027, size: 5, getStartedText: u0060Get Startedu0060, readReviewText: u0060Read Reviewu0060, Logo: u0027broker_carrousel_iu0027, Button: u0027broker_carrousel_nu0027, });That being said, there does come a point where the US economy falling is actually a bad thing for all risk appetite, and you will more likely than not see money running back into the Treasury market, meaning that the US dollar could strengthen. Having said that, I donu0026rsquo;t think thatu0026rsquo;s the short term bias, and it looks as if we are going to eventually try to break to the upside, perhaps aiming for the crucial 1.30 level above 1.30 level of course is a large, round, psychologically significant figure, but itu0026rsquo;s also worth noting that it has been pierced previously over the last couple of months. Short-term pullbacks at this point in time should continue to see plenty of support near the 50-Day EMA, perhaps even down at the 200-Day EMA which is closer to the 1.2675 region.
MENAFN15082024000131011023ID1108559878

The US dollar rallied rather significantly during the early hours on Thursday as we are threatening the 149 yen level. This is a market that has jumped back over a trend line that had been so important previously and had been a little bit resistant on the way back up. Retail sales in the United States came out much hotter than anticipated. In fact, it came out four times what was anticipated. Unemployment claims are still lower than anticipated, and some of the other economic numbers were a bit better than anticipated also.
So, with all of that being said, it’s interesting how the ball might be back in the court of the Bank of Japan as they have to deal with the idea of whether or not they are going to continue to fight the depreciation of the yen. Remember, even if the Federal Reserve cuts interest rates, we’re looking at a difference between the United States and Japan, that is still something along the lines of 4.75% interest rate differential, maybe 4.5 if the Fed gets aggressive. In other words, you still get paid to hold this pair, and I think that’s going to be a big driver longer term.
If we can clear the 150 yen level, that will almost certainly bring in more buyers and could in fact kick off the overall “carry trade” around the world. The markets are certainly missing the ability to get paid at the end of each session, so I think we are starting to see the markets “dip their toes back into the water.”
For a look at all of today’s economic events, check out our economic calendar.
This article was originally posted on FX Empire
A one-day pullback was reversed yesterday leading to trend continuation signal. It was further confirmed with today’s advance to a high of 2.30. Resistance was seen off that high and was followed by a pullback to below the 2.27 pivot. At the time of this writing natural gas is poised to end Thursday’s trading session below the 2.27 level as it is trading within the lower half of the day’s range. Yet, a new higher daily higher and higher low should complete today.
Given the quick recovery of the bull trend following a one-day decline, it looks likely that natural gas may continue higher before a deeper pullback. Nonetheless, there are a couple potential support zones to be aware of. First, there is the pullback low of 2.13 from Tuesday. It is quickly followed by the 20-Day MA at 2.10. There is also the 50% retracement level at 2.07.
On the upside, natural gas has been rising following a -40.2% drop from the June 11 swing high of 3.16. That peak was a failed bullish breakout attempt above a prior trend line (blue dots). It remains on the chart only as an additional guide. The current advance has the potential to again attempt a breakout of the top trendline, which has been redrawn to account for the June 11 lower swing high. Therefore, the outlook for natural gas remains bullish.
Initial upside targets start with the 31.8% Fibonacci retracement at 2.37. Given the potential upside momentum it seems likely that this price level would be exceeded. The 50-Day MA is then at 2.40. Since the 20-Day MA was exceeded, the 50-Day line at 2.52 becomes the next moving average target, along with a previous pullback low at 2.475.
For a look at all of today’s economic events, check out our economic calendar.
(MENAFN– Daily Forex)
The British pound has initially fallen against the Japanese yen in the early hours on Wednesday, only to turn around and show signs of life again.
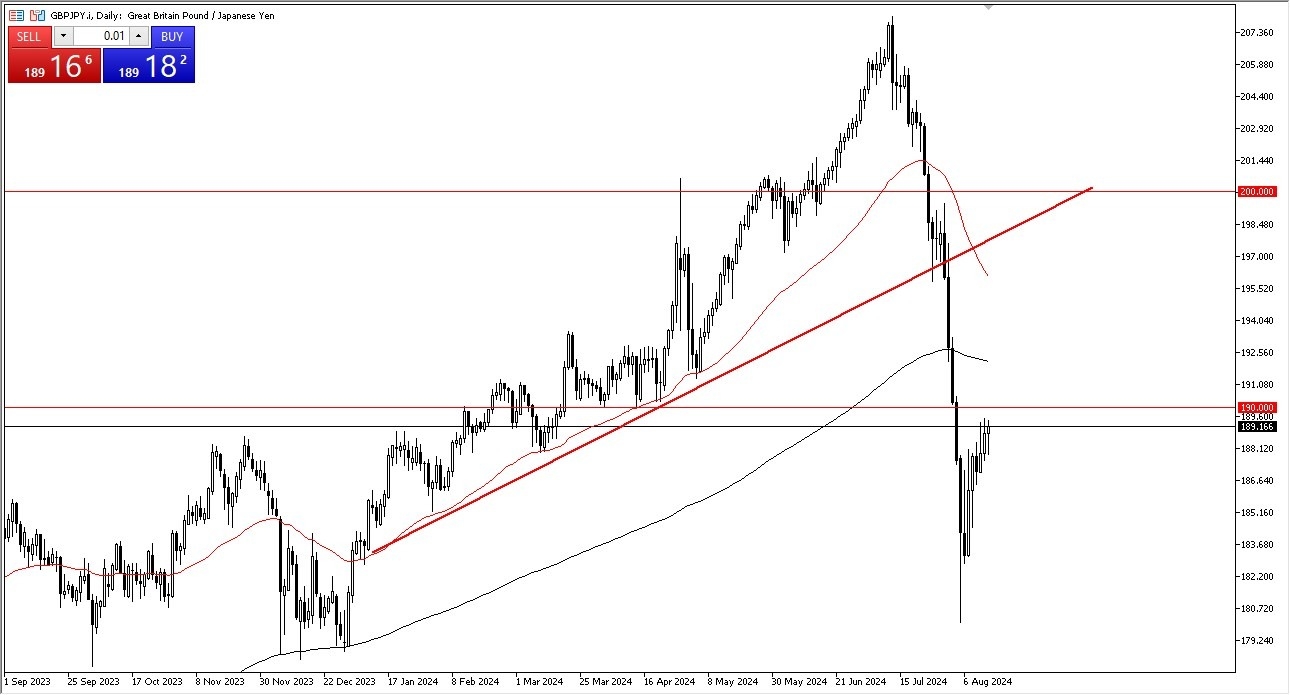
When I look at the pair, the first thing that I notice in my daily analysis is that the 190 yen level continues to offer a bit of a short-term ceiling.
It is because of this that I am paying close attention to this level because if we can break above it, I think it brings in more FOMO trading, at least for the short term.
Keep in mind, traders out there are still asking questions as to whether or not the carry trade can return, and that will be a big deal.
Potential Carry Trade Return?This is a pair that the interest rate is wide enough to drive a semi-truck through. So, you obviously get paid quite well to hang on to it. The Bank of Japan has recently started to tighten monetary policy, but the reality is that they probably can’t do it for a significant amount of time. So, I would anticipate that sooner or later the carry trade does come back into vogue. If and when that happens, then this is a pair that could make new highs.Top Forex Brokers1 Get Started 74% of retail CFD accounts lose money Do not get me wrong, though, I don’t think that happens easily, nor do I think it happens in the short term. In the short term, I would anticipate more of a buy on the dip attitude, but if we were to break down below the 182 yen level then I think we began the next leg lower. We have seen a lot of destruction in this pair and all Japanese yen related pairs So at the very least I think you’re going to see traders be a bit hesitant to get involved to the upside However, there will come a point where it becomes obvious that the momentum has picked back up and traders will almost certainly do what they normally do and take advantage of the interest rate differential in the currency pair.Ready to trade our daily Forex analysis? We’ve made a list of the best forex demo accounts worth trading withMENAFN15082024000131011023ID1108559873
(MENAFN– Daily Forex)
The bitcoin market initially rallied a bit during the trading session on Wednesday but continues to struggle with the crucial 50 day EMA.
The 50 day EMA indicator, of course, is an indicator that a lot of people pay close attention to.
The fact that we are currently stuck between the 50 day EMA indicator above and the 200 day EMA indicator underneath does suggest that perhaps we are in a situation where we are going to see a lot of back and forth and sideways action as traders don’t really know what to do.
The market has recently rallied pretty significantly from the $50,000 level after that major flash crash in risk assets a couple of weeks ago. And now it looks like we are trying to digest some of those gains. That being said, one thing that I cannot ignore at this point in time is that since we have the ETF all time high close to the $74,000 level, each successive swing high has been lower.Top Forex Brokers1 Get Started 74% of retail CFD accounts lose money Volatility ContinuesThat’s something that is very difficult to ignore. That doesn’t necessarily mean anything yet because overall we are somewhat sideways, close attention to. If we were to break down below the $50,000 level, I think the floor in this market comes completely out from underneath it and we plunge. In the meantime, though, I would postulate that Wall Street likes its new toy, and it won’t let it fall apart quite yet. They will let bag holders take their losses eventually, but right now they’re in the process of trying to stabilize the idea of having an ETF out there that follows Bitcoin. The Bitcoin market has had a couple of major influences recently with Mount Gox dumping all of its coins into the markets for traders due to the settlement. And then of course, Germany dumped its supply as well. So, the fact that we’re even up in this area is a fairly bullish sign, but I don’t think we’re out of the woods quite yet.Ready to trade Bitcoin forex forecast? Here’s a list of some of the best crypto brokers to check out.MENAFN15082024000131011023ID1108559885
Investing.com – The foreign exchange markets have seen a great deal of volatility over the last few weeks, and this has resulted in JPMorgan (NYSE:JPM) adjusting its dollar forecasts.
The months of July and August will go down as one of the more memorable macro&political volatility episodes in recent history, analysts at JPMorgan said, in a note, dated Aug. 14.
“Over the course of six weeks, investors witnessed the replacement of a U.S. presidential nominee, an assassination attempt, a +10% JPY TWI [trade-weighted index] rally, a pivot to jumbo Fed cuts in September, and the single-largest intraday spike in VIX since 1990, among others events,” the bank said.
The foreign exchange response has been pronounced though the dust has yet to fully settle, the bank added, but the broad contours point to low-yield short-covering, high-yielding / pro-cyclical underperformance, and a volatile but net-weaker U.S. dollar.
The main FX casualty in the volatility spike was FX carry, which will be hard-pressed to recover the dominant status it enjoyed throughout the last 12-18 months.
Year-to-date carry returns have since been erased, and the bank’s various proxies for the broader carry trade positioning point to 65%-75% of those positions having now been unwound.
The dollar’s response to all this falls somewhere between as-expected and slightly disappointing, the bank added, with the 100-basis-point rally in the U.S. short-end simply too large for the dollar to ignore.
JPMorgan has lowered its USD forecasts, particularly through the USD/JPY pair. It now sees its USD/JPY forecast across the horizon to 2024/4Q at 146 and 2025/2Q at 144, from 147.
“We still see reasons to be optimistic on USD’s overall prospects: 1) the U.S. labor market is weakening but other data since have been ok; 2) RoW cyclical data isn’t sufficiently strong to drive USD lower; 3) the USD historically tends to consolidate after such large rate swings; 4) USD-positive risks from the US election still linger; and 5) August seasonality tends to be supportive for USD,” JPMorgan added.
As such, traders are now pricing in two more quarter-point cuts by the end of the year. Meanwhile, economic data released earlier in the week showed surprising strength in the UK labor market. The unemployment rate fell to 4.2% in the three months to June, missing expectations for a rise, and wage growth slowed to 5.4% from 5.8%, although it was still slightly above the Bank of England’s forecast.
In other trading, the UK 10-year bond yield fell below 3.9%, nearing a six-month low hit earlier in the month, after consumer price inflation came below expectations. Also, UK inflation rose to 2.2% in July, below the 2.3% forecast, with services inflation slowing markedly. The lower-than-expected inflation, although slightly above the Bank of England’s 2% target, supports speculation that the BoE may cut interest rates at its next meeting.
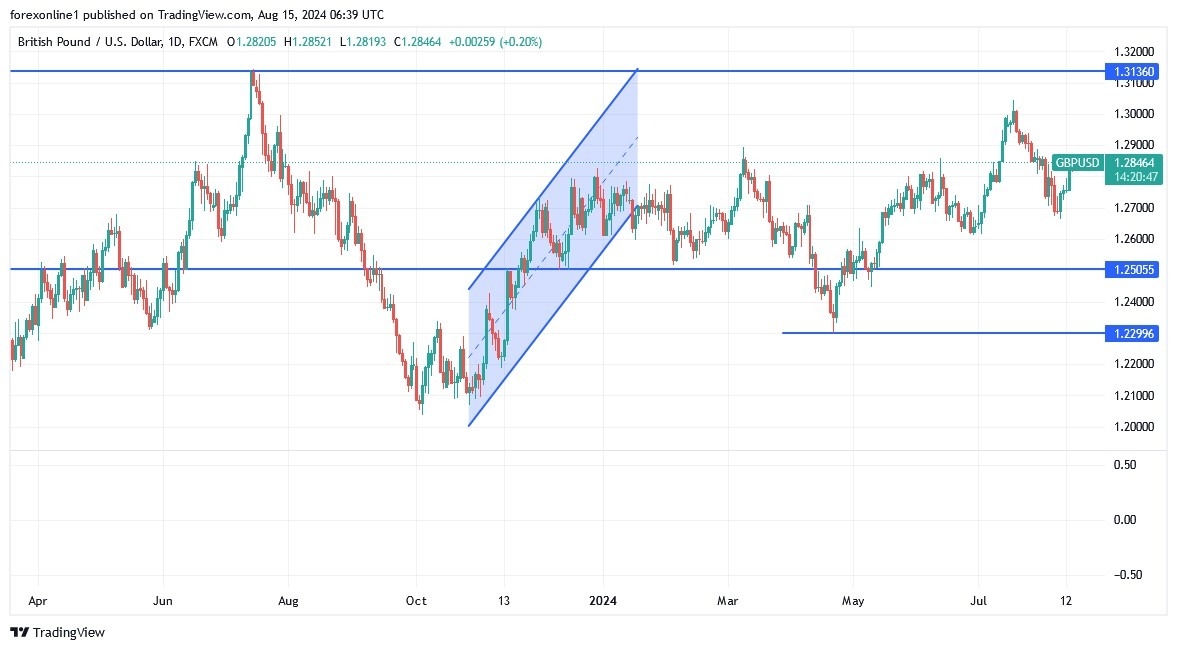
With the US trading session underway, bulls found an opportunity to push the GBP/USD pair towards the resistance of 1.2868 before quickly returning to stabilize around 1.2820 at the beginning of trading on Thursday, ahead of the release of a batch of important US and UK economic data. On the other hand, Bank of England officials are downplaying the significance of the unusual stall in the UK’s most important market interest rate, saying it remains effective in reflecting what’s happening in the markets. The overnight indexed swap rate, or SONIA, has remained at exactly five basis points below the Bank of England’s rate since May 7 – or 70 business days. The previous record for data dating back to 1997 was only four sessions.
For their part, Bank of England officials said in a blog on Wednesday: “The stability of the SONIA rate for a long period is unprecedented. Given that the rate continues to reflect what is happening in the market – a change in market behavior that affects the shape of the distribution of prices – it is not necessarily a cause for concern.”
SONIA, which is referenced in over £90 trillion ($116 trillion) of new transactions annually, represents the average interest rate at which British banks borrow sterling overnight from other financial institutions. Furthermore, it is a key tool in the Bank of England’s monetary policy transmission as it is used to price financial contracts ranging from derivatives to mortgages.

Based on the daily chart, GBP/USD is trying to break the downtrend and may succeed if it moves towards the resistance levels of 1.2890 and 1.3000 respectively. On the other hand, and in the same time frame, a move towards the support level of 1.2750 will be important for the strength of the bears’ control over the general trend again. Today’s GBP/USD pair will be affected by the announcement of the UK economic growth reading.
As for the US dollar, it will be affected by the announcement of the US retail sales figures, the US weekly jobless claims number, and the Philadelphia manufacturing index reading. Finally, this is in addition to indications from global central bank officials regarding the future of tightening or not.
Ready to trade our daily Forex forecast? Here’s a list of some of the top forex brokers UK to check out
This is a pair that the interest rate is wide enough to drive a semi-truck through. So, you obviously get paid quite well to hang on to it. The Bank of Japan has recently started to tighten monetary policy, but the reality is that they probably can’t do it for a significant amount of time. So, I would anticipate that sooner or later the carry trade does come back into vogue. If and when that happens, then this is a pair that could make new highs.
Do not get me wrong, though, I don’t think that happens easily, nor do I think it happens in the short term. In the short term, I would anticipate more of a buy on the dip attitude, but if we were to break down below the 182 yen level then I think we began the next leg lower.
We have seen a lot of destruction in this pair and all Japanese yen related pairs So at the very least I think you’re going to see traders be a bit hesitant to get involved to the upside However, there will come a point where it becomes obvious that the momentum has picked back up and traders will almost certainly do what they normally do and take advantage of the interest rate differential in the currency pair.
Ready to trade our daily Forex analysis? We’ve made a list of the best forex demo accounts worth trading with
On Thursday, we will get vital information coming from the United States that could greatly influence where this market goes. While the default scenario at this point in time is that the Federal Reserve cut rates in September, the Retail Sales figures and of course the Weekly Unemployment Claims number could give us a bit of a “heads up” as to whether or not the Federal Reserve will continue to cut rates beyond the September meeting. In other words, this is a situation where traders are more likely than not to continue to pay close attention to the directionality of the US economy.
That being said, there does come a point where the US economy falling is actually a bad thing for all risk appetite, and you will more likely than not see money running back into the Treasury market, meaning that the US dollar could strengthen. Having said that, I don’t think that’s the short term bias, and it looks as if we are going to eventually try to break to the upside, perhaps aiming for the crucial 1.30 level above.
The 1.30 level of course is a large, round, psychologically significant figure, but it’s also worth noting that it has been pierced previously over the last couple of months. Short-term pullbacks at this point in time should continue to see plenty of support near the 50-Day EMA, perhaps even down at the 200-Day EMA which is closer to the 1.2675 region.
Ready to trade our Forex daily analysis and predictions? Here’s the best forex trading company in UK to trade with.