The main category of Forex News.
You can use the search box below to find what you need.
[wd_asp id=1]
The main category of Forex News.
You can use the search box below to find what you need.
[wd_asp id=1]
From next week, fines for unauthorised absences will go up by as much as £40.
Under the new system, the cost of a penalty charge notice will rise from £60 to £80 if paid within 21 days, and from £120 to £160 if paid within 28 days.
This marks the first increases since the system was introduced in 2013.
Children are only allowed to miss school if they are unwell, or they have been given permission from the school in advance.
Parents can make an absence request to take their children out of school, but there needs to be “exceptional circumstances” and the headteacher needs to authorise it.
Currently, it’s the responsibility of the local authority to decide when to issue fines, meaning the process varies from council to council.
But, under the new rules which were created by the Conservative government, all schools will be required to consider a fine when a child has missed at least five days of school for unauthorised reasons.
What happens if you keep getting fined?
If a parent receives a second fine for the same child within any three-year period, this will be charged at the higher rate of £160.
A parent can only receive two fines within any three-year period, and once this has been met, other actions can be considered.
This includes a parenting order or prosecution.
Parents who are prosecuted and attend court because their child hasn’t been attending school, can be fined up to £2,500.
Where is the money spent?
Government guidance states any money collected from fines should be used by the local authority to cover the costs of administering the system.
Any surplus after that should be spent on “attendance support”.
Any cash remaining at the end of the year must be paid to the education secretary.
A Department for Education spokesperson said: “High and rising school standards are at the heart of our mission to break down barriers to opportunity and give every child the best start in life. Strong foundations of learning are grounded in attendance in the classroom.
“Tackling the root causes of absence is a major priority for the government.
“Our support-first approach outlined in our guidance is designed to help parents to meet their responsibility to ensure their child attends school.
“However, in some cases, including term-time holidays, it may be necessary to issue penalty notices.”
EUR/USD regains its traction and rises toward 1.1000 in the European session on Friday after snapping a three-day winning streak on Thursday.
The table below shows the percentage change of Euro (EUR) against listed major currencies this week. Euro was the strongest against the Japanese Yen.
| USD | EUR | GBP | JPY | CAD | AUD | NZD | CHF | |
|---|---|---|---|---|---|---|---|---|
| USD | -0.64% | -0.97% | 1.41% | -0.09% | -0.81% | -0.25% | 0.40% | |
| EUR | 0.64% | -0.30% | 2.06% | 0.55% | -0.29% | 0.39% | 1.06% | |
| GBP | 0.97% | 0.30% | 2.63% | 0.86% | 0.01% | 0.69% | 1.35% | |
| JPY | -1.41% | -2.06% | -2.63% | -1.47% | -2.26% | -1.64% | -1.04% | |
| CAD | 0.09% | -0.55% | -0.86% | 1.47% | -0.77% | -0.16% | 0.50% | |
| AUD | 0.81% | 0.29% | -0.01% | 2.26% | 0.77% | 0.68% | 1.34% | |
| NZD | 0.25% | -0.39% | -0.69% | 1.64% | 0.16% | -0.68% | 0.65% | |
| CHF | -0.40% | -1.06% | -1.35% | 1.04% | -0.50% | -1.34% | -0.65% |
The heat map shows percentage changes of major currencies against each other. The base currency is picked from the left column, while the quote currency is picked from the top row. For example, if you pick the Euro from the left column and move along the horizontal line to the US Dollar, the percentage change displayed in the box will represent EUR (base)/USD (quote).
The upbeat macroeconomic data releases from the US provided a boost to the US Dollar (USD) and caused EUR/USD to turn south. The US Department of Labor reported that the weekly Initial Jobless Claims declined by 7,000 to 227,000 in the week ending August 9. Other data from the US showed that Retail Sales rose 1% on a monthly basis in July, beating the market expectation for an increase of 0.3%.
Early Friday, the improving risk mood makes it difficult for the USD to build on Thursday’s gains and helps EUR/USD stretch higher.
The US economic docket will feature Housing Starts and Building Permits data for July. Additionally, the University of Michigan will release the preliminary Consumer Sentiment Index data for August. The market reaction to these data is likely to remain short-lived.
Meanwhile, US stock index futures are up between 0.2% and 0.3% in the European session. In case Wall Street’s main indexes open in positive territory and continue to push higher ahead of the weekend, the USD could stay on the back foot and open the door for another leg higher in the pair.
The Relative Strength Index (RSI) indicator on the 4-hour chart started to rise toward 60 after falling to 50 on Thursday, reflecting sellers’ hesitancy. On the upside, 1.1000 (psychological level, static level) aligns as immediate resistance ahead of 1.1050-1.1060 (static level) and 1.1100 (psychological level, static level).
Supports could be seen at 1.0960 (static level), 1.0940 (static level) and 1.0900 (psychological level, static level).
The Euro is the currency for the 20 European Union countries that belong to the Eurozone. It is the second most heavily traded currency in the world behind the US Dollar. In 2022, it accounted for 31% of all foreign exchange transactions, with an average daily turnover of over $2.2 trillion a day. EUR/USD is the most heavily traded currency pair in the world, accounting for an estimated 30% off all transactions, followed by EUR/JPY (4%), EUR/GBP (3%) and EUR/AUD (2%).
The European Central Bank (ECB) in Frankfurt, Germany, is the reserve bank for the Eurozone. The ECB sets interest rates and manages monetary policy. The ECB’s primary mandate is to maintain price stability, which means either controlling inflation or stimulating growth. Its primary tool is the raising or lowering of interest rates. Relatively high interest rates – or the expectation of higher rates – will usually benefit the Euro and vice versa. The ECB Governing Council makes monetary policy decisions at meetings held eight times a year. Decisions are made by heads of the Eurozone national banks and six permanent members, including the President of the ECB, Christine Lagarde.
Eurozone inflation data, measured by the Harmonized Index of Consumer Prices (HICP), is an important econometric for the Euro. If inflation rises more than expected, especially if above the ECB’s 2% target, it obliges the ECB to raise interest rates to bring it back under control. Relatively high interest rates compared to its counterparts will usually benefit the Euro, as it makes the region more attractive as a place for global investors to park their money.
Data releases gauge the health of the economy and can impact on the Euro. Indicators such as GDP, Manufacturing and Services PMIs, employment, and consumer sentiment surveys can all influence the direction of the single currency. A strong economy is good for the Euro. Not only does it attract more foreign investment but it may encourage the ECB to put up interest rates, which will directly strengthen the Euro. Otherwise, if economic data is weak, the Euro is likely to fall. Economic data for the four largest economies in the euro area (Germany, France, Italy and Spain) are especially significant, as they account for 75% of the Eurozone’s economy.
Another significant data release for the Euro is the Trade Balance. This indicator measures the difference between what a country earns from its exports and what it spends on imports over a given period. If a country produces highly sought after exports then its currency will gain in value purely from the extra demand created from foreign buyers seeking to purchase these goods. Therefore, a positive net Trade Balance strengthens a currency and vice versa for a negative balance.
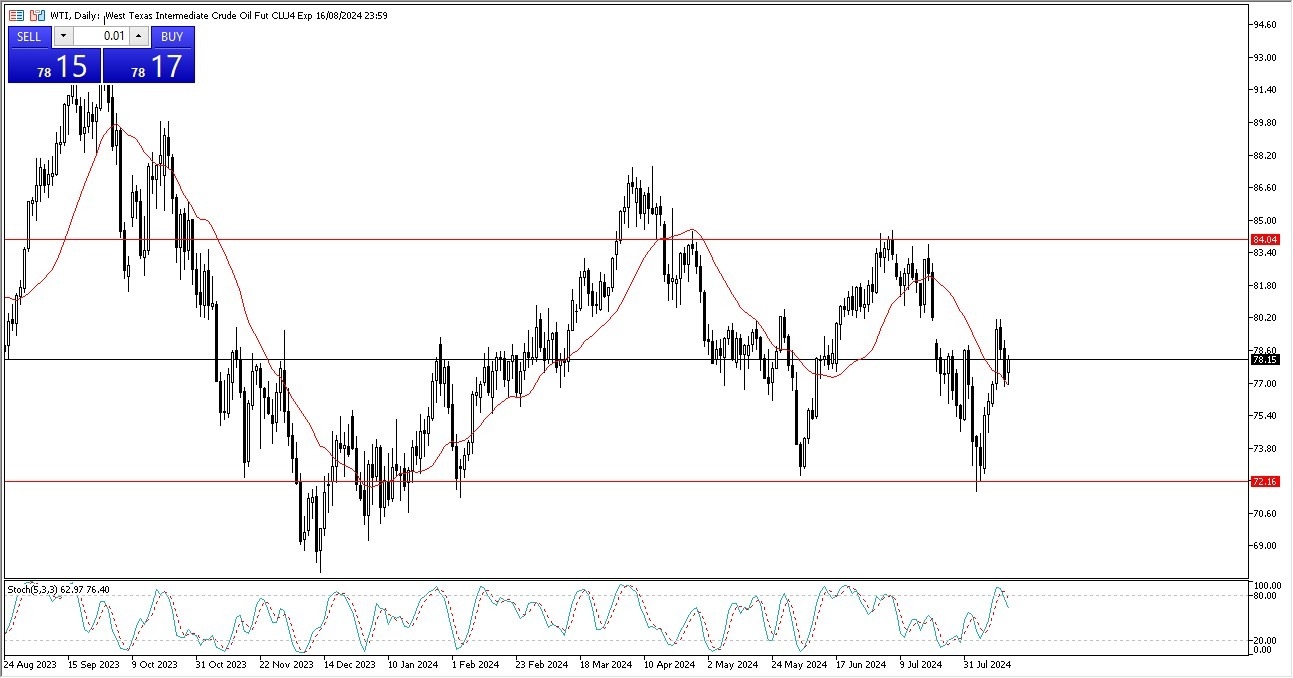
It’ll be a difficult market to trade in because I think at this point in time, you have a lot of external factors going on as well. For example, the tension in the Middle East will of course continue to work to support the price of crude oil, but at the same time, you also have to worry about the economy slowing down and therefore driving down demand.

We are getting towards the end of summer, which is the high season for crude oil demand. So really at this point in time, you would have to say that this has been a less than stellar summer. It hasn’t exactly been horrible. It just hasn’t been overly exciting for those bullish on crude oil. At this point in time, I think if you could break above the $80 level, then we could see the market go looking to the $84 level.
If we break down below the $77 level, the $75 level will be targeted. And then again, we could test the $72 level underneath there. The stochastic oscillator is overbought and crossing over to show signs of weakness. So, while I don’t necessarily place a trade based on that alone, it does suggest that perhaps it is going to be a little bit sluggish. In general, we have a handful of levels that we need to be watching and those will tell us where the market is more likely than not going to go.
Ready to trade crude oil Forex analysis? We’ve shortlisted the best Forex Oil trading brokers in the industry for you.
GBP/USD preserves its bullish momentum and trades at its highest level in three weeks slightly below 1.2900 in the European session on Friday. In the absence of high-impact data releases, the risk perception could impact the pair’s action in the second half of the day.
The table below shows the percentage change of British Pound (GBP) against listed major currencies this week. British Pound was the strongest against the Japanese Yen.
| USD | EUR | GBP | JPY | CAD | AUD | NZD | CHF | |
|---|---|---|---|---|---|---|---|---|
| USD | -0.63% | -1.04% | 1.40% | -0.14% | -0.95% | -0.36% | 0.47% | |
| EUR | 0.63% | -0.38% | 2.03% | 0.49% | -0.43% | 0.27% | 1.14% | |
| GBP | 1.04% | 0.38% | 2.68% | 0.88% | -0.05% | 0.65% | 1.52% | |
| JPY | -1.40% | -2.03% | -2.68% | -1.50% | -2.38% | -1.74% | -0.94% | |
| CAD | 0.14% | -0.49% | -0.88% | 1.50% | -0.86% | -0.22% | 0.62% | |
| AUD | 0.95% | 0.43% | 0.05% | 2.38% | 0.86% | 0.70% | 1.55% | |
| NZD | 0.36% | -0.27% | -0.65% | 1.74% | 0.22% | -0.70% | 0.86% | |
| CHF | -0.47% | -1.14% | -1.52% | 0.94% | -0.62% | -1.55% | -0.86% |
The heat map shows percentage changes of major currencies against each other. The base currency is picked from the left column, while the quote currency is picked from the top row. For example, if you pick the British Pound from the left column and move along the horizontal line to the US Dollar, the percentage change displayed in the box will represent GBP (base)/USD (quote).
On Thursday, the data from the US showed that the weekly Initial Jobless Claims declined by 7,000 to 227,000. Additionally, Retail Sales rose by 1% in July, surpassing the market expectation for an increase of 0.3%. Upbeat data releases provided a boost to the USD and caused GBP/USD to edge lower toward 1.2800.
As risk flows started to dominate the financial markets following the Wall Street’s opening bell on Thursday, however, GBP/USD regained its traction and closed the day in positive territory.
July Housing Starts and Building Permits data will be featured in the US economic calendar alongside the University of Michigan’s preliminary Consumer Sentiment Index for August. Investors are likely to ignore these figures and stay focused on the risk perception.
At the time of press, US stock index futures were up between 0.15% and 0.3%. A bullish opening in Wall Street could hurt the USD and allow GBP/USD to stretch higher. It’s also worth mentioning that profit-taking and week-end flows could cause inter-market correlations to weaken heading into the weekend.
1.2900 (Fibonacci 61.8% retracement of the latest downtrend) aligns as immediate resistance before 1.2950 (Fibonacci 78.6% retracement) and 1.3000 (psychological level, static level).
On the downside, first support is located at 1.2850-1.2840 (Fibonacci 50% retracement, 200-period Simple Moving Average (SMA)) ahead of 1.2800 (100-period SMA, Fibonacci 38.2% retracement) and 1.2760 (Fibonacci 23.6% retracement).
The Pound Sterling (GBP) is the oldest currency in the world (886 AD) and the official currency of the United Kingdom. It is the fourth most traded unit for foreign exchange (FX) in the world, accounting for 12% of all transactions, averaging $630 billion a day, according to 2022 data. Its key trading pairs are GBP/USD, aka ‘Cable’, which accounts for 11% of FX, GBP/JPY, or the ‘Dragon’ as it is known by traders (3%), and EUR/GBP (2%). The Pound Sterling is issued by the Bank of England (BoE).
The single most important factor influencing the value of the Pound Sterling is monetary policy decided by the Bank of England. The BoE bases its decisions on whether it has achieved its primary goal of “price stability” – a steady inflation rate of around 2%. Its primary tool for achieving this is the adjustment of interest rates. When inflation is too high, the BoE will try to rein it in by raising interest rates, making it more expensive for people and businesses to access credit. This is generally positive for GBP, as higher interest rates make the UK a more attractive place for global investors to park their money. When inflation falls too low it is a sign economic growth is slowing. In this scenario, the BoE will consider lowering interest rates to cheapen credit so businesses will borrow more to invest in growth-generating projects.
Data releases gauge the health of the economy and can impact the value of the Pound Sterling. Indicators such as GDP, Manufacturing and Services PMIs, and employment can all influence the direction of the GBP. A strong economy is good for Sterling. Not only does it attract more foreign investment but it may encourage the BoE to put up interest rates, which will directly strengthen GBP. Otherwise, if economic data is weak, the Pound Sterling is likely to fall.
Another significant data release for the Pound Sterling is the Trade Balance. This indicator measures the difference between what a country earns from its exports and what it spends on imports over a given period. If a country produces highly sought-after exports, its currency will benefit purely from the extra demand created from foreign buyers seeking to purchase these goods. Therefore, a positive net Trade Balance strengthens a currency and vice versa for a negative balance.
Gold price (XAU/USD) flat lines near $2,455 during the early Asian session on Friday. The yellow metal seesaws between gains and losses amid the consolidation of the US Dollar (USD). Traders will focus on the preliminary of the US Michigan Consumer Sentiment Index for August, along with the Building Permits and Housing Starts.
Following the release of encouraging employment-related data and strong retail sales, speculative interest in the world’s biggest economy decreased, easing fears about a potential recession. However, traders still see the US Federal Reserve (Fed) start easing the policy in September. According to the CME FedWatch Tool, the markets are now pricing in a nearly 80% chance of a September rate cut and expect 200 basis points (bps) of reduction in the next 12 months, though that will depend on incoming data.
Data released by the US Census Bureau on Thursday showed that Retail Sales in the United States rose by 1.0% MoM in July, compared to a decline of 0.2% in June. This figure surpassed the estimation of a 0.3 increase. Meanwhile, the Initial Jobless Claims for the week ending August 10 arrived at 227K, better than the expectation of 235K and down from the previous week of 234K. The recent stronger job data and upbeat Retail Sales have strengthened the USD broadly and weighed on the precious metal.
Nonetheless, the elevated geopolitical risks in the Middle East might provide some support to Gold price, a traditional safe-haven asset. Gaza’s Health Ministry says more than 40,000 Palestinians have been killed in Israeli attacks since October 7, with many more buried under rubble and threatened by illness, according to local news source Aljazeera.
Gold has played a key role in human’s history as it has been widely used as a store of value and medium of exchange. Currently, apart from its shine and usage for jewelry, the precious metal is widely seen as a safe-haven asset, meaning that it is considered a good investment during turbulent times. Gold is also widely seen as a hedge against inflation and against depreciating currencies as it doesn’t rely on any specific issuer or government.
Central banks are the biggest Gold holders. In their aim to support their currencies in turbulent times, central banks tend to diversify their reserves and buy Gold to improve the perceived strength of the economy and the currency. High Gold reserves can be a source of trust for a country’s solvency. Central banks added 1,136 tonnes of Gold worth around $70 billion to their reserves in 2022, according to data from the World Gold Council. This is the highest yearly purchase since records began. Central banks from emerging economies such as China, India and Turkey are quickly increasing their Gold reserves.
Gold has an inverse correlation with the US Dollar and US Treasuries, which are both major reserve and safe-haven assets. When the Dollar depreciates, Gold tends to rise, enabling investors and central banks to diversify their assets in turbulent times. Gold is also inversely correlated with risk assets. A rally in the stock market tends to weaken Gold price, while sell-offs in riskier markets tend to favor the precious metal.
The price can move due to a wide range of factors. Geopolitical instability or fears of a deep recession can quickly make Gold price escalate due to its safe-haven status. As a yield-less asset, Gold tends to rise with lower interest rates, while higher cost of money usually weighs down on the yellow metal. Still, most moves depend on how the US Dollar (USD) behaves as the asset is priced in dollars (XAU/USD). A strong Dollar tends to keep the price of Gold controlled, whereas a weaker Dollar is likely to push Gold prices up.
The USD/JPY pair struggles to build on the previous day’s breakout momentum and attracts fresh sellers on Friday, snapping a two-day winning streak to a nearly two-week high. The downtick is sponsored by a modest US Dollar (USD) downtick, though the prevalent risk-on environment could undermine the safe-haven Japanese Yen (JPY) and help limit deeper losses.
Investors turned optimistic after the US macro data published on Thursday showed that Retail Sales rose more than expected in July and a still resilient labor market, which eased fears about a possible recession in the world’s largest economy. In fact, the US Census Bureau reported that the total value of sales at the retail level in the US rose 1% in July and sales ex Autos grew 0.4%, beating estimates for an increase of 0.3% and 0.1%, respectively. Another report published by the US Department of Labor (DOL) revealed that there were 227K Initial Jobless Claims in the week ending August 10, lower than the 235K expected and the 234K previous.
Traders were quick to react and scaled back expectations for more aggressive policy easing by the Federal Reserve (Fed). The markets, however, still see a greater chance that the US central bank will begin its rate-cutting cycle in September. This, in turn, triggers a fresh leg down in the US Treasury bond yields and acts as a headwind for the USD. The JPY, on the other hand, draws support from the stronger second-quarter Gross Domestic Product (GDP) print from Japan on Thursday. This could encourage the Bank of Japan (BoJ) to continue raising interest rates, which, in turn, is seen exerting some pressure on the USD/JPY pair.
Nevertheless, the lack of any meaningful selling warrants some caution for bearish traders and before confirming that the recent sharp recovery from the 141.70-141.65 region, or the YTD low touched in July has run its course. Traders now look to the second-tier US macro data – Building Starts and Housing Permits, along with the Preliminary Michigan Consumer Sentiment Index – short-term opportunities later during the early North American session. The market focus, however, will remain glued to the FOMC meeting minutes, due for release next Tuesday, and Fed Chair Jerome Powell’s appearance at the Jackson Hole Symposium.
From a technical perspective, the overnight strong move up falters a resistance marked by the 38.2% Fibonacci retracement level of the July-August slump. The said barrier is pegged near the 149.35-149.40 region, which should now act as a key pivotal point for traders. A sustained strength beyond might trigger a short-covering rally and allow the USD/JPY pair to reclaim the 150.00 psychological mark. The momentum could extend further towards an intermediate resistance near the 150.75-150.80 region en route to the 151.00 round figure and the 151.50-151.70 confluence – comprising the 200-day Simple Moving Average (SMA) and the 50% Fibo. level.
On the flip side, weakness below the Asian session low, around the 148.75-148.70 region, could find some support near the 148.20 area. This is closely followed by the 148.00 mark, below which the USD/JPY pair could accelerate the fall towards the 147.30-147.25 intermediate support en route to the 147.00 round figure and the 23.6% Fibo. level, around the 146.50-146.45 region. Failure to defend the said support levels might shift the near-term bias back in favor of bearish traders and prompt aggressive technical selling, paving the way for a slide towards the 146.00 mark, the 145.45 area and the 145.00 psychological mark.
Silver price (XAG/USD) gives up some of its intraday gains in Thursday’s New York session after the release of the resilient United States (US) Retail Sales data for July and lower-than-expected number of individuals claiming jobless benefits for the first time in the week ending August 9.
The white metal struggles to hold the crucial support of $28.00 as upbeat US data has boosted the US Dollar (USD) and bond yields. The US Dollar Index (DXY), which tracks the Greenback’s value against six major currencies, bounces back above 103.00. 10-year US Treasury yields soar to near 3.96%. Higher yields on interest-bearing assets weigh on non-yielding assets, such as Silver, by increasing the opportunity cost of holding investment in them.
The Retail Sales, a key measure of consumer spending, returned to expansion and rose at a robust pace of 1% from the estimates of 0.3%. Meanwhile, Initial Jobless Claims came in in lower at 227K than estimates of 235K and the prior release of 234K, upwardly revised from 233K. This is the second consecutive time when number of jobless claims have come in lower than expectations, suggesting that labor market conditions are not as bad as they were indicated by the Nonfarm Payrolls (NFP) data for July.
Meanwhile, the near-term outlook of the Silver price remains firm as investors remain confident that the Federal Reserve (Fed) will begin reducing interest rates from the September meeting. However, upbeat data have dashed hopes the Fed will adopt an aggressive policy-easing stance.
Silver price bounced back after a negative divergence formation on a four-hour timeframe, which shapes when the momentum oscillator refuses to make lower lows, while the asset continues that formation. The 14-period Relative Strength Index (RSI) rebounded from 24.00 without hitting downside below previous low of 20.00.
However, the above-mentioned formation would trigger if the white metal breaks above the immediate swing high plotted from the August 2 high of $29.23.
The asset stays above the 20-period Exponential Moving Average (EMA) near $27.80, suggesting that the near-term trend has leaned on the upside.
The 14-period RSI has bounced back to near 60.00 and a decisive break above the same will trigger the upside momentum.
Silver is a precious metal highly traded among investors. It has been historically used as a store of value and a medium of exchange. Although less popular than Gold, traders may turn to Silver to diversify their investment portfolio, for its intrinsic value or as a potential hedge during high-inflation periods. Investors can buy physical Silver, in coins or in bars, or trade it through vehicles such as Exchange Traded Funds, which track its price on international markets.
Silver prices can move due to a wide range of factors. Geopolitical instability or fears of a deep recession can make Silver price escalate due to its safe-haven status, although to a lesser extent than Gold’s. As a yieldless asset, Silver tends to rise with lower interest rates. Its moves also depend on how the US Dollar (USD) behaves as the asset is priced in dollars (XAG/USD). A strong Dollar tends to keep the price of Silver at bay, whereas a weaker Dollar is likely to propel prices up. Other factors such as investment demand, mining supply – Silver is much more abundant than Gold – and recycling rates can also affect prices.
Silver is widely used in industry, particularly in sectors such as electronics or solar energy, as it has one of the highest electric conductivity of all metals – more than Copper and Gold. A surge in demand can increase prices, while a decline tends to lower them. Dynamics in the US, Chinese and Indian economies can also contribute to price swings: for the US and particularly China, their big industrial sectors use Silver in various processes; in India, consumers’ demand for the precious metal for jewellery also plays a key role in setting prices.
Silver prices tend to follow Gold’s moves. When Gold prices rise, Silver typically follows suit, as their status as safe-haven assets is similar. The Gold/Silver ratio, which shows the number of ounces of Silver needed to equal the value of one ounce of Gold, may help to determine the relative valuation between both metals. Some investors may consider a high ratio as an indicator that Silver is undervalued, or Gold is overvalued. On the contrary, a low ratio might suggest that Gold is undervalued relative to Silver.
The EUR/USD pair settled in the 1.0970 region on Thursday after losing the 1.1000 mark to upbeat United States (US) macroeconomic figures. The pair held within a tight range throughout the first half of the day but made a decisive bearish movement following the release of July Retail Sales, which unexpectedly increased by 1%, beating the 0.3% advance anticipated by market participants. Initial Jobless Claims for the week ended August 9 were up by 227K, better than the 235K expected.
The news brought relief and sent US indexes sharply up as investors decreased their bets on a potential recession in the country. Later in the day, the US released not-that-encouraging figures: Capacity Utilization hit 77.8% in July, while Industrial Production in the same month was down 0.6%, missing expectations. Nevertheless, stocks maintained positive momentum, while EUR/USD trimmed part of its early losses.
By the end of the day, investors kept believing the Federal Reserve (Fed) would deliver its first rate cut during the September meeting, although it is still unclear whether it would be 25 or 50 basis points (bps).
On Friday, the Eurozone will publish the June Trade Balance, while the US will release the preliminary estimate of the August Michigan Consumer Sentiment Index and the Michigan Consumer Inflation Expectations for the same month.
From a technical point of view, the daily chart for the EUR/USD pair shows it could extend its slide. Technical indicators retreated from near overbought readings, maintaining their downward slopes within positive levels ahead of the Asian opening. At the same time, the pair develops above all its moving averages, with the 20 Simple Moving Average (SMA) heading north at around 1.0890. Finally, the 100 and 200 SMAs offer modest upward slopes far below the shorter one, limiting the odds for a sustained slide, particularly if the 1.0950 support level holds.
The pair is neutral-to-bullish according to technical readings in the 4-hour chart. Technical indicators lack directional strength within positive levels, while EUR/USD battles to recover above a bullish 20 SMA after piercing it earlier in the day. The longer moving averages grind north below the 1.0900 mark, suggesting buyers moved to the sidelines but not yet abandoned the pair.
Support levels: 1.0950 1.0900 1.0860
Resistance levels: 1.0970 1.1005 1.1045
With the Israel Hamas conflict continuing to mount and even reports of the United States preparing to ship $750 million worth of bombs to Saudi Arabia, oil prices are trending lower due to Tuesday’s IEA report that forecast lower oil demand growth in 2025 than it was previously predicting.
The IEA didn’t change its 2024 forecast, but the oil markets recoiled at the prospect of smaller oil demand growth next year, rising only 950,000 bpd—just a 30,000 bpd reduction from its previous forecast.
At 11:46 pm CST, Brent crude was trading down 1.68% at $80.91 per barrel—a drop of $1.38 per barrel on the day. WTI crude was trading down 2 on the day at $78.62 per barrel. For Brent, the price is still $4 above where it was trading this same time last week.

Find more oil prices from around the world here
The demand growth outlook’s effect on oil prices was undaunted by reports of the United States lifting 2021 restrictions on the sale of bombs to Saudi Arabia and its subsequent shipment of more than $750 million worth of bombs to Saudi Arabia—a move that may improve relations between the United States and Saudi Arabia, but could heat up tensions in the Middle East, particularly the war Saudi Arabia against the Houthi rebels in Yemen. The Biden Administration has enjoyed a strained relationship with Saudi Arabia after The U.S. president shunned the Saudi royals due to its assassination of journalist and dissident Jamal Khashoggi.
Those deliveries of the bombs are likely to start in several months. Saudi Arabia’s military renewed its strikes on Houthi targets just yesterday, pro-Iranian media reported on Monday, with Saudi drones striking the Al-Ghor area and Kamaran Island near the port of Hodeida.
By Julianne Geiger
More Top Reads From Oilprice.com
(MENAFN– Daily Forex)
I recognize that this asset is testing the crucial 200-Day EMA, which of course a lot of people will pay close attention to, as it is one of the most widely followed technical indicators out there.
With this being the case, I think you get a situation where buyers could step back into the market, and we have already seen that during the early hours on Tuesday, they have at least tried to defend that moving averages.
Recent BreakoutThe recent breakout was rather brutal, and now it looks as if we are questioning whether or not there is going to be a continuation of the upward pressure. I think given enough time, the EUR/GBP pair almost certainly will see an attempt to go higher, but right now we’ve got a situation where a lot of people are looking at this through the prism of whether or not we can bounce hard enough to reach toward the 0.86 level again. That’s an area that previously had been resistant, so it’s not a huge surprise to see that the market has caused a bit in that general vicinity for short-term pullback.Top Forex Brokers1 Get Started 74% of retail CFD accounts lose money At this point in time, I look at the 0.85 level underneath as support as well, especially as the 50-Day EMA is starting to race toward that level. It’s also worth noting that the 0.84 level previously had been a massive support level on the monthly chart, so it’s not a huge surprise to see that we had bounce from there. In general, this is a market that I think continues to be very noisy, but that’s not a huge surprise considering that the two economies are so highly interlinked.On a break above the recent highs of the last week, then I think this is a pair that probably goes looking to the 0.8750 level, but it’s also a situation where the market is going to continue to be very noisy and choppy, so with that being said, the market is one that you will have to be very patient with as the moves tend to take quite a bit of time, generally speaking.Ready to trade our daily Forex analysis ? We’ve made a list of the best forex demo accounts worth trading with.MENAFN14082024000131011023ID1108553087