The main category of Forex News.
You can use the search box below to find what you need.
[wd_asp id=1]
The main category of Forex News.
You can use the search box below to find what you need.
[wd_asp id=1]
The GBP/USD forecast leans slightly bearish as easing UK consumer inflation data boosts expectations for Bank of England rate cuts. Nevertheless, the larger bullish trend remains intact as the dollar weakens after downbeat US wholesale inflation data.
–Are you interested in learning more about STP brokers? Check our detailed guide-
Data on Wednesday revealed that the UK consumer price index rose by 2.2% in July. The value rose above the Bank of England’s 2% target for the first time in two months. Nevertheless, it was a more minor increase than the forecast of 2.3%.
Meanwhile, service inflation increased by 5.2% in July after a 5.7% increase in the previous month. This decline is a significant relief for the BoE. Notably, policymakers have remained cautious due to high service inflation.
Although headline inflation reached the central bank’s target, few were ready to lower borrowing costs because service inflation was a concern. Therefore, July’s figures might give more policymakers the confidence to continue cutting interest rates. After the CPI report, traders raised the chances of a BoE cut in September to 48%. Meanwhile, they expect 46 bps in total of rate cuts this year.
On the other hand, the dollar remained fragile after softer-than-expected US wholesale inflation figures. The PPI increased by 0.1% in July, missing forecasts of a 0.2% increase. As a result, investors are pricing a higher chance of a super-sized 50 bps Fed rate cut in September. Later today, the CPI report will further shape the outlook for Fed monetary policy.
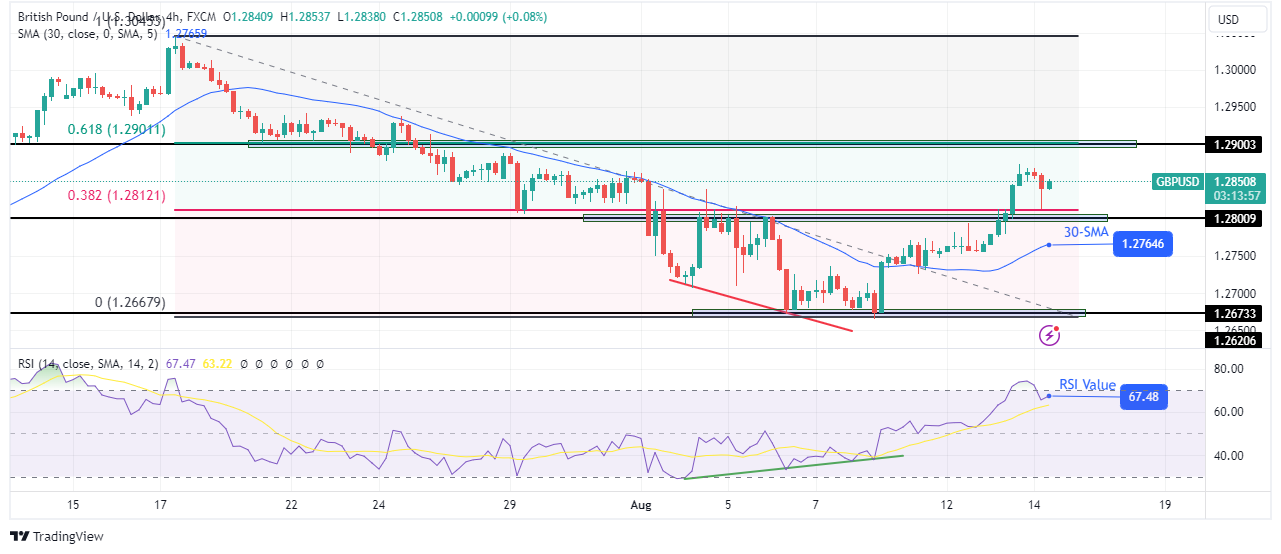
On the technical side, the GBP/USD price has broken above a strong barrier comprising the 0.382 Fib and the 1.2800 key resistance level. As a result, the price has risen far above the 30-SMA to make a new high. Meanwhile, the RSI trades near the overbought region.
–Are you interested in learning more about making money with forex? Check our detailed guide-
Furthermore, after the rally, bears resurfaced and pushed the price to retest the recently broken barrier. Since the bullish bias remains strong, the next target might be at the 1.2900 level near the 0.618 Fib.
Looking to trade forex now? Invest at eToro!
67% of retail investor accounts lose money when trading CFDs with this provider. You should consider whether you can afford to take the high risk of losing your money.
The USD/JPY pair reverses an intraday dip to the 146.00 mark, or a fresh weekly low touched earlier this Wednesday and builds on its steady intraday ascent through the early European session. Spot prices, however, remain confined in a familiar range held over the past week or so as traders await more cues about the Federal Reserve’s (Fed) rate-cut path before positioning for a firm near-term direction. Hence, the market focus will remain glued to the release of the closely-watched US Consumer Price Index (CPI) report, due later today, which is expected to infuse some volatility in the markets and provide some meaningful impetus to the currency pair.
The headline CPI is expected to rise 0.2% MoM in July and at an annual rate of 2.9% in July, down slightly from the 3% in the previous month. Meanwhile, the core CPI, which excludes volatile food and energy prices, is seen ticking lower to 3.2% from 3.3% in June. Against the backdrop of last Friday’s disappointing US jobs report, a softer-than-expected US CPI print will lift bets for a 50 basis points (bps) interest rate cut at the September FOMC policy meeting. This might prompt fresh selling around the USD, which dropped to over a one-week low on Wednesday in reaction to a weaker US Producer Price Index (PPI) report, and drag the USD/JPY pair lower.
Ahead of the high-impact macro data, some repositioning trade assists the USD Index (DXY), which tracks the Greenback against a basket of currencies, to regain some positive traction and reverse a part of the previous day’s losses. Furthermore, a generally positive tone around the equity markets, along with diminishing odds of the Bank of Japan (BoJ) hiking interest rates again this year, undermines the safe-haven Japanese Yen (JPY) and lends support to the USD/JPY pair. BoJ Deputy Governor Shinichi Uchida said last week that the central bank won’t hike rates when markets are unstable. Apart from this, geopolitical risks should limit losses for the JPY.
Meanwhile, investors remain worried about the risk of a further escalation of geopolitical tensions in the Middle East. This could keep a lid on any optimism in the market and further contribute to limiting the downside for the JPY. Hence, it will be prudent to wait for strong follow-through buying before positioning for an extension of the USD/JPY pair’s recent goodish recovery from the 141.70-14.65 area, or the lowest level since early January touched last week.
From a technical perspective, the USD/JPY pair seems to have found acceptance above the 23.6% Fibonacci retracement level of the recent steep decline from a multi-decade high. This, along with the emergence of some dip-buying on Wednesday, supports prospects for some near-term appreciating move. That said, it will be prudent to wait for a breakout through a short-term trading range resistance, around the 147.80 area, before placing fresh bullish bets. Spot prices might then accelerate move beyond the 148.00 mark and the weekly swing high, around the 148.20 region, towards reclaiming the 149.00 mark. The momentum could extend further towards the 38.2% Fibo. level, around the 149.30 zone.
Meanwhile, oscillators on the daily chart are holding deep in negative territory and also seem to have recovered from the oversold zone. This, in turn, suggests that any meaningful recovery attempt is more likely to attract fresh sellers and remain capped. In the meantime, the Asian session low, around the 146.00 mark, now seems to protect the immediate downside ahead of the 145.50-145.45 region. Some follow-through selling has the potential to drag the USD/JPY pair below the 145.00 psychological mark, towards testing the next relevant support near the 144.20-144.15 horizontal zone. The latter should act as a key pivotal point, which if broken decisively will be seen as a fresh trigger for bearish traders and pave the way for deeper losses.
Gold price is defending the $2,450 psychological level, looking to the one-week high of $2,477 on the US Consumer Price Index (CPI) inflation day.
Gold buyers remain expectant of a softer US CPI report, following a bigger-than-expected cool-off in the Producer Price Index (PPI) inflation data published a day ago.
The US will hog attention later on Tuesday while the US Consumer Price Index (CPI) inflation release will stand out on Wednesday. The US Labor Department’s Bureau of Labor Statistics reported Tuesday that the headline PPI increased 2.2%, a sharp drop from the 2.7% reading in June, coming in below the expected 2.3% rise.
The data triggered a risk rally on Wall Street, as it reinforced dovish US Federal Reserve (Fed) expectations, smashing the US Dollar across the board in tandem with the US Treasury bond yields. Increased dovish Fed bets cushioned the corrective downside in the non-interest-bearing Gold price, as markets resorted to profit-taking after the bright metal reverted toward all-time highs in the lead-up to the US CPI showdown.
Markets are currently pricing in a 54% chance of a 50 basis points (bps) interest-rate cut by the Fed in September, according to the CME Group’s FedWatch Tool.
Meanwhile, the US annual CPI is seen rising 2.9% in July, compared to the 3% figure recorded in June. The annual core CPI inflation is set to ease to 3.2% in the same period vs. June’s 3.3%. Over the month, the CPI is expected to rebound 0.2% in July while the core CPI will likely inch a tad higher to 0.2%.
A softer-than-expected headline annual CPI print could confirm bets of aggressive and big Fed rate cuts, providing extra legs to the US Dollar downtrend. Gold price, in turn, could clinch fresh record highs.
Besides, Gold price will continue to find support from the rife Middle East geopolitical tensions, with markets bracing for an imminent Iranian attack on Israel. Additionally, speeches from Fed policymakers will also help influence the Gold price action.
As observed on the daily chart, Gold price is challenging the upper boundary of a symmetrical triangle formation, now at $2,471.
Gold buyers look to the US CPI data to secure a daily candlestick closing above that level, which could then trigger a fresh advance to the $2,500 mark.
However, Gold price needs to take out the all-time high of $2,484, at first.
The key leading indicator, the 14-day Relative Strength Index (RSI) points lower but stays above the 50 level, suggesting that Gold price will continue to see dip demand.
On the other hand, an upside surprise in the US CPI data could revive the selling interest, dragging Gold price back toward the 21-day Simple Moving Average (SMA) support at $2,420 holds.
Ahead of that, the August 9 high of $2,437 could lend some support to Gold buyers.
Should the selling momentum intensify, with the 21-day SMA giving way, the next relevant support is seen at $2,380, where the lower boundary of the triangle and the 50-day SMA converge.
Inflationary or deflationary tendencies are measured by periodically summing the prices of a basket of representative goods and services and presenting the data as The Consumer Price Index (CPI). CPI data is compiled on a monthly basis and released by the US Department of Labor Statistics. The YoY reading compares the prices of goods in the reference month to the same month a year earlier.The CPI is a key indicator to measure inflation and changes in purchasing trends. Generally speaking, a high reading is seen as bullish for the US Dollar (USD), while a low reading is seen as bearish.
Gold price (XAU/USD) trades with mild gains near $2,465 during the early Asian session on Wednesday. The upside of the yellow metal might be underpinned by the safe-haven flows amid ongoing tensions in the Middle East. Traders will closely watch the release of the US July Consumer Price Index (CPI), which is due later on Wednesday.
Safe-haven demand from heightened tensions in the Middle East might lift the precious metal in the near term. The BBC reported on Tuesday that the United States sent a guided missile submarine to the Middle East as tensions rise in the region. The action comes in response to fears of a wider regional conflict after the recent assassination of senior Hezbollah and Hamas leaders. Analysts from Saxo Bank A/S noted that gold remains “supported by geopolitical risks and anticipated Federal Reserve rate cuts amid heightened tensions” involving Iran and Israel as well as Ukraine.
On Tuesday, Atlanta Fed President Raphael Bostic said that recent economic data made him “more confident” that the Fed can get inflation back to its 2% target. Still, more evidence is needed before he’s ready to support lowering interest rates.
The US CPI inflation report on Wednesday could offer some hints about the Federal Reserve’s (Fed) interest rate cut path. The CPI is expected to increase 0.2% MoM in July, compared to the previous month of a 0.1% decline. On an annual basis, the CPI inflation is estimated to ease to 2.9% in July from 3.0% in June.
The softer reading could fuel the chance of a Fed rate cut in September. On the other hand, a hotter inflation outcome might diminish the odds of a Fed easing policy, which is likely to exert some selling pressure on the non-yielding Gold.
Gold has played a key role in human’s history as it has been widely used as a store of value and medium of exchange. Currently, apart from its shine and usage for jewelry, the precious metal is widely seen as a safe-haven asset, meaning that it is considered a good investment during turbulent times. Gold is also widely seen as a hedge against inflation and against depreciating currencies as it doesn’t rely on any specific issuer or government.
Central banks are the biggest Gold holders. In their aim to support their currencies in turbulent times, central banks tend to diversify their reserves and buy Gold to improve the perceived strength of the economy and the currency. High Gold reserves can be a source of trust for a country’s solvency. Central banks added 1,136 tonnes of Gold worth around $70 billion to their reserves in 2022, according to data from the World Gold Council. This is the highest yearly purchase since records began. Central banks from emerging economies such as China, India and Turkey are quickly increasing their Gold reserves.
Gold has an inverse correlation with the US Dollar and US Treasuries, which are both major reserve and safe-haven assets. When the Dollar depreciates, Gold tends to rise, enabling investors and central banks to diversify their assets in turbulent times. Gold is also inversely correlated with risk assets. A rally in the stock market tends to weaken Gold price, while sell-offs in riskier markets tend to favor the precious metal.
The price can move due to a wide range of factors. Geopolitical instability or fears of a deep recession can quickly make Gold price escalate due to its safe-haven status. As a yield-less asset, Gold tends to rise with lower interest rates, while higher cost of money usually weighs down on the yellow metal. Still, most moves depend on how the US Dollar (USD) behaves as the asset is priced in dollars (XAU/USD). A strong Dollar tends to keep the price of Gold controlled, whereas a weaker Dollar is likely to push Gold prices up.
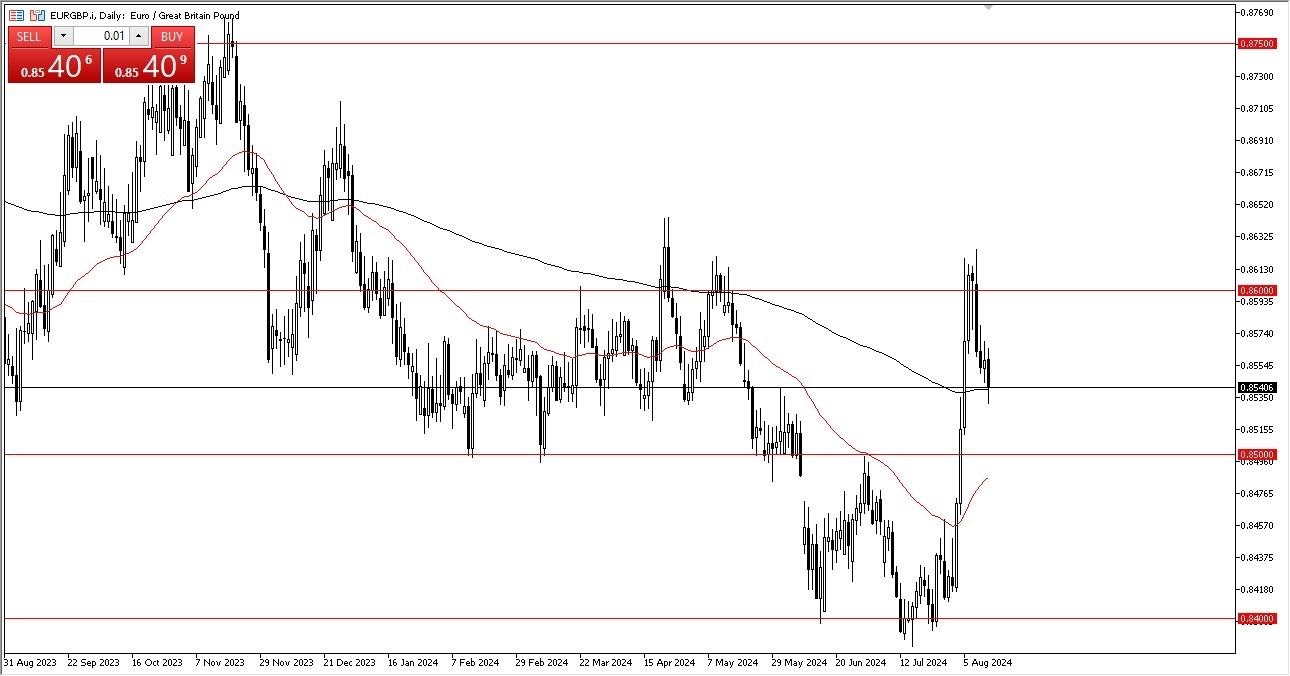
The recent breakout was rather brutal, and now it looks as if we are questioning whether or not there is going to be a continuation of the upward pressure. I think given enough time, the EUR/GBP pair almost certainly will see an attempt to go higher, but right now we’ve got a situation where a lot of people are looking at this through the prism of whether or not we can bounce hard enough to reach toward the 0.86 level again. That’s an area that previously had been resistant, so it’s not a huge surprise to see that the market has caused a bit in that general vicinity for short-term pullback.

At this point in time, I look at the 0.85 level underneath as support as well, especially as the 50-Day EMA is starting to race toward that level. It’s also worth noting that the 0.84 level previously had been a massive support level on the monthly chart, so it’s not a huge surprise to see that we had bounce from there. In general, this is a market that I think continues to be very noisy, but that’s not a huge surprise considering that the two economies are so highly interlinked.
On a break above the recent highs of the last week, then I think this is a pair that probably goes looking to the 0.8750 level, but it’s also a situation where the market is going to continue to be very noisy and choppy, so with that being said, the market is one that you will have to be very patient with as the moves tend to take quite a bit of time, generally speaking.
Ready to trade our daily Forex analysis? We’ve made a list of the best forex demo accounts worth trading with.
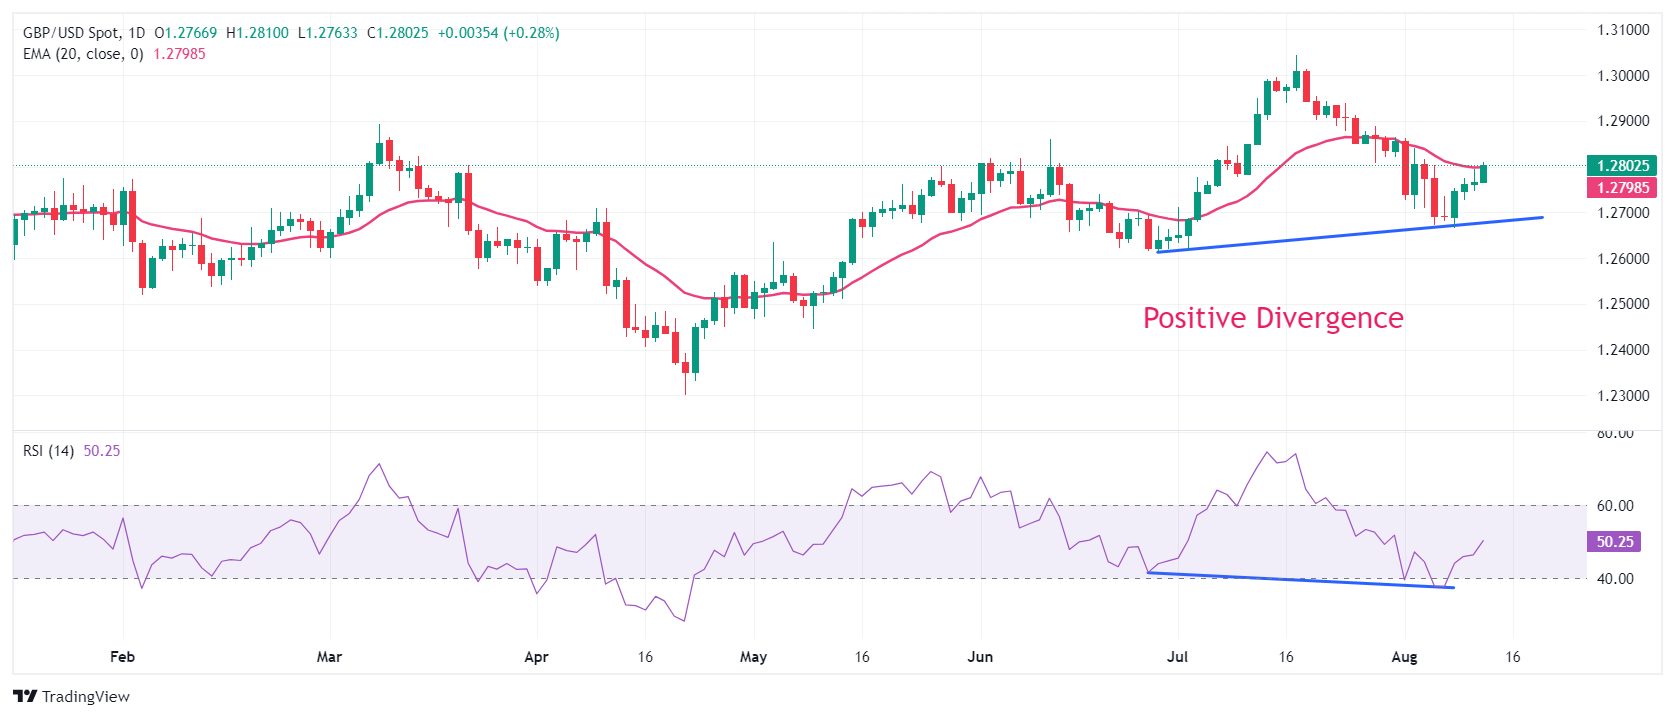
GBP/USD gained traction in the early European session on Tuesday and climbed above 1.2800 for the first time in a week. The pair could stretch higher if it manages to clear the resistance area located at 1.2810-1.2820.
The UK’s Office for national Statistics reported on Tuesday that the ILO Unemployment Rate declined to 4.2% in the three months to June from 4.4%. This reading came in below the market expectation of 4.5%. Additionally, the annual wage inflation, as measured by the change in the Average Earnings Excluding Bonus, edged lower to 5.4% in the same period from 5.7%, coming in above analysts’ estimate of 4.6%. With the immediate reaction, Pound Sterling gathered strength against its major rivals. Read more…
The Pound Sterling (GBP) delivers a sharp upside move against its major peers in Tuesday’s London session. The British currency strengthens as the United Kingdom (UK) Office for National Statistics (ONS) reported upbeat labor market data for the three months ending in June, which has weighed on market expectations of subsequent interest-rate cuts by the Bank of England (BoE).
The agency reported that the ILO Unemployment Rate unexpectedly declined to 4.2%. Economists expected the jobless rate to have increased to 4.5% from the prior release of 4.4%. Read more…
“They won’t be able to hike again, at least for the rest of the year. It’s a toss-up whether they can do one hike by next March.”
On July 31, the Bank of Japan unexpectedly raised interest rates to around 0.25% while announcing the anticipated cut to Japanese Government Bond (JGB) purchases (quantitative tightening). Significantly, the BoJ Governor hinted at further rate hikes and a neutral interest rate of around 1%. The monetary policy decision and forward guidance contributed to the Yen rally and the Nikkei 225’s brief collapse.
Economists have warned that the Yen carry trade unwind may not be over, exposing the USD/JPY and the global markets to more volatility.
On August 8, the Kobeissi Letter, an industry-leading commentary on global capital markets, stated that Deutsche Bank put the Yen carry trade at $20 trillion.
With US inflation and labor market data due this week, the data could signal a further narrowing of the interest rate differential between the US and Japan, possibly triggering another Yen carry trade unwind.
Goldman Sachs Private Wealth Management Investment Strategy Managing Director Matheus Dibo commented on market conditions, stating,
“Volatility could remain elevated for quite a while. We have some key data points this week. We were talking about earlier, retail sales CPI, Jackson Hole next week, so a lot of things that could move markets over the next few days.”
ARK Invest Founder, CEO, and CIO Cathie Wood recently commented on Treasury yields and the Fed Funds Rate, stating,
“The metal-to-gold ratio suggests that the 10-year Treasury bond yield should be around 2% today, not where it is at 3.8% or last October’s 5%. If the 10-year Treasury should yield ~2% today, should the Fed funds rate be closer to 1%?”
The Bank of Japan’s Summary of Opinions revealed an intention to return the policy interest rate to a neutral rate of 1% over time.
If interest rate differentials matter, the outlook is bearish for the USD/JPY, even if the BoJ keeps interest rates on hold.
On Wednesday, August 14, the heavily anticipated US CPI Report will be in focus.
Economists expect the core annual inflation rate to drop from 3.3% year-on-year in June to 3.2% in July.
Softer-than-expected numbers could fuel speculation about a possible 50 basis point September Fed rate cut and multiple 25 basis point cuts in November and December.
A softer CPI Report could allow the Fed to focus on the waning US labor market. Deteriorating labor market conditions could lead to further cuts in Q1 2025.
A decline below today’s low of 2.14 will trigger a bearish continuation of today’s pullback. The 20-Day MA at 2.09 looks to be the first area to watch for support. If it fails to hold, there is a price zone to watch from around 2.03 to 2.02, and it includes the 61.8% Fibonacci retracement at 2.025. One of the reasons that natural gas is anticipated to continue higher following a pullback is that it triggered a bullish weekly reversal signal last week on a rally above the three-week high at 2.15.
A reversal week completed last week, and the week ended strong, in the top quarter of the week’s trading range. Also, the week ended above 2.15 at 2.16. Moreover, Monday’s rally triggered a bullish continuation of the weekly chart. This was the first time in eight weeks that natural gas exceeded the high of a prior week. These signs of strength should lead to further upside.
Since the 20-Day MA was cleared last week with a rally above 2.10, natural gas is showing strength that may result in a continuation of the current advance up to the 50-Day MA, now at 2.42. Prior to that price level there is the 38.2% Fibonacci retracement at 2.37, while the 50% retracement is at 2.42.
Characteristics of the current pullback should assist in determining short-term underlying strength in natural gas. A bullish reversal following a test of support at the 20-Day line would be a stronger sign than a drop to test support around the 61.8% Fibonacci level at 2.025, for example.
For a look at all of today’s economic events, check out our economic calendar.
Silver price (XAG/USD) faces pressure in Tuesday’s American session even though the United States (US) producer inflation remained soft in July. The US Bureau of Labor Statistics (BLS) showed that the core Producer Price Inflation (PPI), which strips off volatile food and energy prices, remains flat month-on-month. Annually, the underlying PPI decelerated at a faster-than-expected pace to 2.4% from expectations of 2.7% and the former release of 2.4%.
Soft US producer inflation has affirmed confidence among investors that price pressures continue to moderate. This has weighed on the US Dollar (USD) and bond yields by boosting expectations of a big interest-rate cut announcement by the Federal Reserve (Fed) in September.
The US Dollar Index (DXY), which tracks the Greenback’s value against six major currencies, skids below the crucial support of 103.00. 10-year US Treasury Yields tumble to near 3.87%. Historically, lower yields on interest-bearing assets reduce the opportunity cost of holding investment in non-yielding assets, such as Silver. However, the Silver price declines too as investors await for more evidence to confirm that inflation is on track to return to the desired rate of 2%.
For more evidence, investors will focus on the US Consumer Price Index (CPI) data for July, which will be published on Wednesday. The CPI report is expected to show that monthly headline and core inflation rose by 0.2%. Annual headline and core CPI are estimated to have decelerated by one-tenth to 2.9% and 3.2%, respectively.
Meanwhile, geopolitical risks continue to limit the downside in the Silver price. Investors expect an all-out war in the Middle East between Iran and Israel after the killing of Hamas leader in Tehran.
Silver price finds an interim support near the 200-day Exponential Moving Average (EMA) near $26.90, suggesting that the overall trend is uncertain. The major cushion for the Silver price will be the horizontal support plotted from May 5 high at $26.14.
The 14-day Relative Strength Index (RSI) hovers near 40.00. A decisive break below the same will trigger a bearish momentum.
Silver is a precious metal highly traded among investors. It has been historically used as a store of value and a medium of exchange. Although less popular than Gold, traders may turn to Silver to diversify their investment portfolio, for its intrinsic value or as a potential hedge during high-inflation periods. Investors can buy physical Silver, in coins or in bars, or trade it through vehicles such as Exchange Traded Funds, which track its price on international markets.
Silver prices can move due to a wide range of factors. Geopolitical instability or fears of a deep recession can make Silver price escalate due to its safe-haven status, although to a lesser extent than Gold’s. As a yieldless asset, Silver tends to rise with lower interest rates. Its moves also depend on how the US Dollar (USD) behaves as the asset is priced in dollars (XAG/USD). A strong Dollar tends to keep the price of Silver at bay, whereas a weaker Dollar is likely to propel prices up. Other factors such as investment demand, mining supply – Silver is much more abundant than Gold – and recycling rates can also affect prices.
Silver is widely used in industry, particularly in sectors such as electronics or solar energy, as it has one of the highest electric conductivity of all metals – more than Copper and Gold. A surge in demand can increase prices, while a decline tends to lower them. Dynamics in the US, Chinese and Indian economies can also contribute to price swings: for the US and particularly China, their big industrial sectors use Silver in various processes; in India, consumers’ demand for the precious metal for jewellery also plays a key role in setting prices.
Silver prices tend to follow Gold’s moves. When Gold prices rise, Silver typically follows suit, as their status as safe-haven assets is similar. The Gold/Silver ratio, which shows the number of ounces of Silver needed to equal the value of one ounce of Gold, may help to determine the relative valuation between both metals. Some investors may consider a high ratio as an indicator that Silver is undervalued, or Gold is overvalued. On the contrary, a low ratio might suggest that Gold is undervalued relative to Silver.
Gold price moved one step closer to its record high on Tuesday, hitting $2,476.81 during Asian trading hours. XAU/USD, however, spent most of the day stuck to its daily opening level at around $2,470 as market players turned cautious ahead of first-tier headlines. Following a relatively quiet week in terms of macroeconomic releases, the focus returns to inflation.
The United Kingdom (UK) and the United States (US) will publish fresh Consumer Price Index (CPI) figures on Wednesday. The numbers will affect the respective central banks’ decisions and, hence, affect both currencies in the near term. Clearly, US figures will have a larger impact on the bright metal, as the Federal Reserve (Fed) has yet to decide on an interest rate cut.
Financial markets have had erratic sentiments about what and when the Fed may act. The central bank, however, has just recently shifted into a more dovish stance, paving the way for a September rate cut. Just recently, tepid growth related data boosted speculation the Fed has no choice but to trim interest rates next month.
Indeed, inflation figures will have a saying, as softer-than-anticipated CPI numbers will further pave the way towards lower rates. Ahead of the event, the US published the July Producer Price Index (PPI), which rose 0.1% MoM in July as expected, while the annual increase resulted at 2.2%, below the 2.3% anticipated and the previous 2.7%. The core annual inflation at wholesale levels eased from 3% in June to 2.4%.
From a technical point of view, the daily chart for XAU/USD shows bulls retain control. The pair holds well above all its moving averages, with the 20 Simple Moving Average (SMA) partially losing its bullish strength but still providing dynamic support at around 2,420.00. At the same time, the Momentum indicator keeps grinding higher well above its midline, while the Relative Strength (RSI) indicator consolidates at around 61, skewing the risk to the upside.
XAU/USD is poised to retest its record high at $2,483.68. The pair trades well above all its moving averages, with a bullish 20 SMA accelerating north above the 100 and 200 SMA, which slowly gain upward traction. Finally, technical indicators maintain modest upward slopes well above their midlines, reflecting the ongoing consolidation yet maintaining the risk skewed to the upside.
Support levels: 2,458.30 2,442.90 2,438.80
Resistance levels: 2,483.70 2,495.10 2,510.00