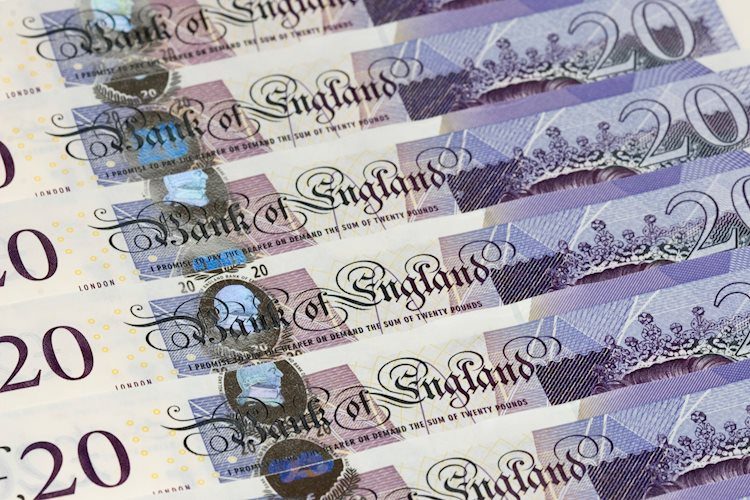
The main category of Forex News.
You can use the search box below to find what you need.
[wd_asp id=1]
The main category of Forex News.
You can use the search box below to find what you need.
[wd_asp id=1]
Gold price moved one step closer to its record high on Tuesday, hitting $2,476.81 during Asian trading hours. XAU/USD, however, spent most of the day stuck to its daily opening level at around $2,470 as market players turned cautious ahead of first-tier headlines. Following a relatively quiet week in terms of macroeconomic releases, the focus returns to inflation.
The United Kingdom (UK) and the United States (US) will publish fresh Consumer Price Index (CPI) figures on Wednesday. The numbers will affect the respective central banks’ decisions and, hence, affect both currencies in the near term. Clearly, US figures will have a larger impact on the bright metal, as the Federal Reserve (Fed) has yet to decide on an interest rate cut.
Financial markets have had erratic sentiments about what and when the Fed may act. The central bank, however, has just recently shifted into a more dovish stance, paving the way for a September rate cut. Just recently, tepid growth related data boosted speculation the Fed has no choice but to trim interest rates next month.
Indeed, inflation figures will have a saying, as softer-than-anticipated CPI numbers will further pave the way towards lower rates. Ahead of the event, the US published the July Producer Price Index (PPI), which rose 0.1% MoM in July as expected, while the annual increase resulted at 2.2%, below the 2.3% anticipated and the previous 2.7%. The core annual inflation at wholesale levels eased from 3% in June to 2.4%.
From a technical point of view, the daily chart for XAU/USD shows bulls retain control. The pair holds well above all its moving averages, with the 20 Simple Moving Average (SMA) partially losing its bullish strength but still providing dynamic support at around 2,420.00. At the same time, the Momentum indicator keeps grinding higher well above its midline, while the Relative Strength (RSI) indicator consolidates at around 61, skewing the risk to the upside.
XAU/USD is poised to retest its record high at $2,483.68. The pair trades well above all its moving averages, with a bullish 20 SMA accelerating north above the 100 and 200 SMA, which slowly gain upward traction. Finally, technical indicators maintain modest upward slopes well above their midlines, reflecting the ongoing consolidation yet maintaining the risk skewed to the upside.
Support levels: 2,458.30 2,442.90 2,438.80
Resistance levels: 2,483.70 2,495.10 2,510.00
The EUR/USD pair remains stuck on Tuesday, trading within a well-limited range around the 1.0920 mark since the day started. The absence of relevant data and upcoming first-tier United States (US) first-tier headlines keeps investors in cautious mode, with little action across the FX board.
Stock markets, however, tell a different story. Speculative interest is still worried and moving away from high-yielding equities, as most European indexes trade in the red and weigh on US futures. Other than that, weaker government bond yields limit US Dollar’s demand. The 10-year Treasury note offers 3.89% after flirting with the 4% level a couple of days ago.
Data-wise, Germany published the August ZEW Survey on Economic Sentiment, which fell by more than anticipated. The country’s index printed at 19.2 following a reading of 41.8 in July, while the Eurozone Economic Sentiment shrank to 17.9 from the previous 43.7. Additionally, the assessment of the current situation in Germany fell to -77.3, worse than the -68.9 posted in July. Across the pond, the US published the NFIB Business Optimism Index, which rose in July to 93.7, beating expectations.
Finally, the US Producer Price Index (PPI) rose 0.1% MoM in July as expected, while the annual increase was 2.2%, below the anticipated 2.3% and the previous 2.7%. Core annual inflation at wholesale levels eased from 3% in June to 2.4%. The encouraging figures put some pressure on the USD, with EUR/USD hovering around 1.0940 ahead of Wall Street’s opening.
Technically, the daily chart for the EUR/USD pair shows the risk skews to the upside, although the momentum is missing. The pair keeps developing above all its moving averages, with the 20 Simple Moving Average (SMA) gaining upward traction well above the 100 and 200 SMAs. At the same time, technical indicators gyrated north within positive levels, although with tepid slopes.
In the near term, and according to the 4-hour chart, the pair has room to extend its advance. Buyers are defending the downside around a flat 20 SMA while, despite the prevalent range, EUR/USD manages to post sporadic higher highs. At the same time, technical indicators remain within positive levels, although with uneven upward strength.
Support levels: 1.0890 1.0845 1.0800
Resistance levels: 1.0950 1.1005 1.1045
(This story was corrected on August 13 at 14:06 GMT to say that the ZEW’s indicator about the current situation in Germany was -68.9 in July, not 68.9.)
Last week, the Japanese yen rose to a seven-month high against the dollar as the Bank of Japan’s hawkish shift led to a rapid unwinding of yen-denominated carry trades. Furthermore, the move fueled fears of a US recession and bets on further rate cuts by the Fed. However, sentiment has since stabilized, with Bank of Japan Deputy Governor Shinichi Uchida saying the BOJ would not raise interest rates when the market is unstable. Meanwhile, a summary of views from the Bank of Japan’s July policy meeting revealed that some members called for interest rate hikes to continue, with one suggesting they should eventually be raised to at least 1%.
According to Forex Markets, the US Dollar steadies ahead of inflation data. On Monday, the US dollar index DXY held steady at 103.1 as investors look ahead to key inflation data this week for confirmation that price growth is continuing to stabilize. Today “Tuesday”, US producer inflation data is due, followed by consumer inflation on Wednesday. Additionally, US retail sales figures are due on Thursday.

Last week, the US dollar fell to a seven-month low after a weak July jobs report sparked recession fears in the US, with markets speculating on an emergency cut by the Federal Reserve. Also, a stronger yen fueled by government intervention and interest rate hikes by the Bank of Japan exacerbated the dollar’s slide. However, sentiment has since stabilized as subsequent US economic data eased fears of a slowdown, causing the dollar to recover most of the losses it suffered last week.
Also, markets have eased bets on a Fed rate cut. Although, the expectations for more than 100 basis points of rate cuts this year remain intact.
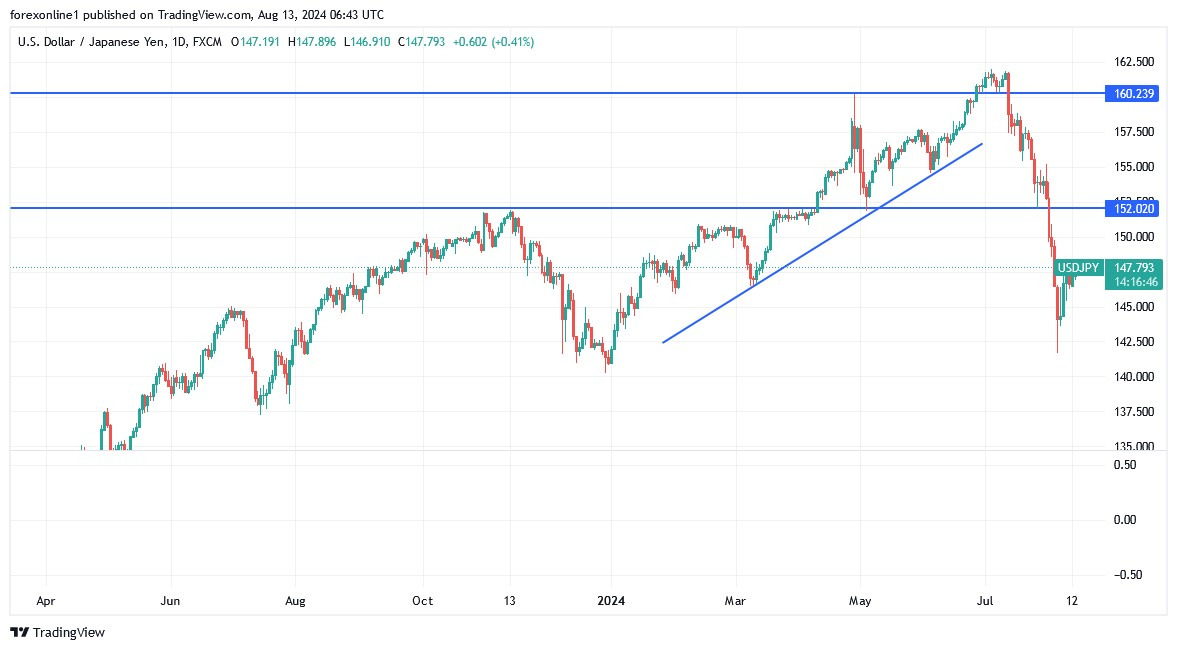
Based on the daily chart below, the USD/JPY currency pair is attempting to break out of a steep downtrend that pushed it towards its 2024 low. Technically, a successful break above the psychological resistance of 150.00 will be crucial for initiating a reversal of the recent bearish trend. Clearly, the price of the US dollar against the Japanese yen will continue to react to the course of global central bank policies and investor risk appetite. Overall, the most prominent support levels for the currency pair are currently 143.65 and 142.00, respectively.
Ready to trade our daily forex forecast? Here are the best forex brokers in Japan to choose from.
EUR/USD closed the first trading day of the week marginally higher but failed to gather further bullish momentum. The pair holds above 1.0900 and continues to trade within its week-old range.
The table below shows the percentage change of Euro (EUR) against listed major currencies last 7 days. Euro was the weakest against the New Zealand Dollar.
| USD | EUR | GBP | JPY | CAD | AUD | NZD | CHF | |
|---|---|---|---|---|---|---|---|---|
| USD | 0.28% | -0.17% | 2.56% | -0.66% | -1.58% | -1.59% | 1.81% | |
| EUR | -0.28% | -0.42% | 2.26% | -0.95% | -1.87% | -1.93% | 1.53% | |
| GBP | 0.17% | 0.42% | 2.71% | -0.51% | -1.45% | -1.50% | 1.91% | |
| JPY | -2.56% | -2.26% | -2.71% | -3.15% | -4.02% | -4.11% | -0.60% | |
| CAD | 0.66% | 0.95% | 0.51% | 3.15% | -0.93% | -1.00% | 2.44% | |
| AUD | 1.58% | 1.87% | 1.45% | 4.02% | 0.93% | -0.04% | 3.42% | |
| NZD | 1.59% | 1.93% | 1.50% | 4.11% | 1.00% | 0.04% | 3.52% | |
| CHF | -1.81% | -1.53% | -1.91% | 0.60% | -2.44% | -3.42% | -3.52% |
The heat map shows percentage changes of major currencies against each other. The base currency is picked from the left column, while the quote currency is picked from the top row. For example, if you pick the Euro from the left column and move along the horizontal line to the US Dollar, the percentage change displayed in the box will represent EUR (base)/USD (quote).
The pullback seen in the US Treasury bond yields limited the US Dollar’s (USD) gains on Monday and helped EUR/USD edge higher. Early Tuesday, the benchmark 10-year US T-bond yield clings to small gains above 3.9% and allows the USD to stay resilient against its major rivals, capping the pair’s upside.
The US Bureau of Labor Statistics will release the Producer Price Index (PPI) data for July later in the day. On a monthly basis, the PPI is forecast to rise 0.1% following the 0.2% increase recorded in June, while the core PPI is seen rising 0.2%. In case the monthly core PPI increases more than expected, the immediate reaction could provide a boost to the USD. Investors, however, could refrain from taking large positions ahead of the July Consumer Price Index, which will be released on Wednesday.
Meanwhile, the data from Germany showed that the ZEW Survey – Economic Sentiment declined sharply to 17.9 in August from 41.8 in July. Similarly, the Economic Sentiment for the Eurozone dropped to 17.9 from 43.7 in the same period, making it hard for the Euro to find demand.
“The economic outlook for Germany is breaking down,” the ZEW Institute said. “In the current survey, we observe the strongest decline of the economic expectations over the past two years.”
EUR/USD continues to trade in the one-week-old horizontal range between 1.0900 and 1.0940. Additionally, the Relative Strength Index (RSI) indicator on the 4-hour chart retreats toward 50 early Tuesday, reflecting a lack of directional momentum.
In case EUR/USD breaks below 1.0900, 1.0880-1.0870, where the 100-period and the 20-day Simple Moving Averages (SMA) are located, could be seen as next support before 1.0850 (200-period SMA).
On the upside, resistances are located at 1.0940 (static level), 1.0960 (static level) and 1.1000 (psychological level, static level).
The Euro is the currency for the 20 European Union countries that belong to the Eurozone. It is the second most heavily traded currency in the world behind the US Dollar. In 2022, it accounted for 31% of all foreign exchange transactions, with an average daily turnover of over $2.2 trillion a day. EUR/USD is the most heavily traded currency pair in the world, accounting for an estimated 30% off all transactions, followed by EUR/JPY (4%), EUR/GBP (3%) and EUR/AUD (2%).
The European Central Bank (ECB) in Frankfurt, Germany, is the reserve bank for the Eurozone. The ECB sets interest rates and manages monetary policy. The ECB’s primary mandate is to maintain price stability, which means either controlling inflation or stimulating growth. Its primary tool is the raising or lowering of interest rates. Relatively high interest rates – or the expectation of higher rates – will usually benefit the Euro and vice versa. The ECB Governing Council makes monetary policy decisions at meetings held eight times a year. Decisions are made by heads of the Eurozone national banks and six permanent members, including the President of the ECB, Christine Lagarde.
Eurozone inflation data, measured by the Harmonized Index of Consumer Prices (HICP), is an important econometric for the Euro. If inflation rises more than expected, especially if above the ECB’s 2% target, it obliges the ECB to raise interest rates to bring it back under control. Relatively high interest rates compared to its counterparts will usually benefit the Euro, as it makes the region more attractive as a place for global investors to park their money.
Data releases gauge the health of the economy and can impact on the Euro. Indicators such as GDP, Manufacturing and Services PMIs, employment, and consumer sentiment surveys can all influence the direction of the single currency. A strong economy is good for the Euro. Not only does it attract more foreign investment but it may encourage the ECB to put up interest rates, which will directly strengthen the Euro. Otherwise, if economic data is weak, the Euro is likely to fall. Economic data for the four largest economies in the euro area (Germany, France, Italy and Spain) are especially significant, as they account for 75% of the Eurozone’s economy.
Another significant data release for the Euro is the Trade Balance. This indicator measures the difference between what a country earns from its exports and what it spends on imports over a given period. If a country produces highly sought after exports then its currency will gain in value purely from the extra demand created from foreign buyers seeking to purchase these goods. Therefore, a positive net Trade Balance strengthens a currency and vice versa for a negative balance.
Silver price (XAG/USD) surges to near $28.00 in Monday’s North American session. The white metal gains amid geopolitical risks and firm speculation that the Federal Reserve (Fed) will start reducing interest rates from the September meeting.
Conflicts between Iran and Israel in the Middle East are expected to widen further as the former is expected to retaliate for the assassination of the Hamas leader by an Israeli air strike in Tehran. The appeal of Silver as a safe haven improves amid geopolitical uncertainty.
Meanwhile, market speculation for the Fed rate cuts in September remain robust but uncertainty over the size has deepened significantly. According to the CME FedWatch tool, 30-day Federal Funds Futures pricing data shows that traders see a 46.5% chance that interest rates will be reduced by 50 basis points (bps) in September. The likelihood of a 50 bp rate reduction has weakened significantly from 85%, recorded a week ago.
A sharp decline in the Fed’s big interest-rate cut prospects has offered some support to the US Dollar (USD) and bond yields. The US Dollar Index (DXY), which tracks the Greenback’s value against six major currencies, steadies above 103.00. 10-year US Treasury yields hover near 3.95%.
Going forward, investors will focus on the United States (US) Consumer Price Index (CPI) data for July, which will be published Wednesday. Headline and core CPI, which strips off volatile food and energy prices, are expected to have decelerated to 2.9% and 3.2%, respectively.
Silver price rises to near the upward boundary of the Falling Channel formation in a four-hour timeframe. Usually, investors see pullbacks in the above-mentioned chart pattern as selling opportunities by market participants. The asset remains below the 200-period Exponential Moving Average (EMA) near $28.76, suggesting that the overall outlook is bullish.
The 14-period Relative Strength Index (RSI) attempts to break above 60.00. Sustenance above the same would improve Silver’s appeal.
Silver is a precious metal highly traded among investors. It has been historically used as a store of value and a medium of exchange. Although less popular than Gold, traders may turn to Silver to diversify their investment portfolio, for its intrinsic value or as a potential hedge during high-inflation periods. Investors can buy physical Silver, in coins or in bars, or trade it through vehicles such as Exchange Traded Funds, which track its price on international markets.
Silver prices can move due to a wide range of factors. Geopolitical instability or fears of a deep recession can make Silver price escalate due to its safe-haven status, although to a lesser extent than Gold’s. As a yieldless asset, Silver tends to rise with lower interest rates. Its moves also depend on how the US Dollar (USD) behaves as the asset is priced in dollars (XAG/USD). A strong Dollar tends to keep the price of Silver at bay, whereas a weaker Dollar is likely to propel prices up. Other factors such as investment demand, mining supply – Silver is much more abundant than Gold – and recycling rates can also affect prices.
Silver is widely used in industry, particularly in sectors such as electronics or solar energy, as it has one of the highest electric conductivity of all metals – more than Copper and Gold. A surge in demand can increase prices, while a decline tends to lower them. Dynamics in the US, Chinese and Indian economies can also contribute to price swings: for the US and particularly China, their big industrial sectors use Silver in various processes; in India, consumers’ demand for the precious metal for jewellery also plays a key role in setting prices.
Silver prices tend to follow Gold’s moves. When Gold prices rise, Silver typically follows suit, as their status as safe-haven assets is similar. The Gold/Silver ratio, which shows the number of ounces of Silver needed to equal the value of one ounce of Gold, may help to determine the relative valuation between both metals. Some investors may consider a high ratio as an indicator that Silver is undervalued, or Gold is overvalued. On the contrary, a low ratio might suggest that Gold is undervalued relative to Silver.
GBP/USD gained traction in the early European session on Tuesday and climbed above 1.2800 for the first time in a week. The pair could stretch higher if it manages to clear the resistance area located at 1.2810-1.2820.
The table below shows the percentage change of British Pound (GBP) against listed major currencies today. British Pound was the strongest against the Japanese Yen.
| USD | EUR | GBP | JPY | CAD | AUD | NZD | CHF | |
|---|---|---|---|---|---|---|---|---|
| USD | 0.07% | -0.28% | 0.37% | -0.08% | -0.22% | 0.13% | 0.21% | |
| EUR | -0.07% | -0.36% | 0.29% | -0.18% | -0.31% | -0.45% | 0.14% | |
| GBP | 0.28% | 0.36% | 0.64% | 0.19% | 0.05% | -0.07% | 0.52% | |
| JPY | -0.37% | -0.29% | -0.64% | -0.48% | -0.59% | -0.74% | -0.15% | |
| CAD | 0.08% | 0.18% | -0.19% | 0.48% | -0.14% | -0.29% | 0.31% | |
| AUD | 0.22% | 0.31% | -0.05% | 0.59% | 0.14% | -0.13% | 0.51% | |
| NZD | -0.13% | 0.45% | 0.07% | 0.74% | 0.29% | 0.13% | 0.60% | |
| CHF | -0.21% | -0.14% | -0.52% | 0.15% | -0.31% | -0.51% | -0.60% |
The heat map shows percentage changes of major currencies against each other. The base currency is picked from the left column, while the quote currency is picked from the top row. For example, if you pick the British Pound from the left column and move along the horizontal line to the US Dollar, the percentage change displayed in the box will represent GBP (base)/USD (quote).
The UK’s Office for national Statistics reported on Tuesday that the ILO Unemployment Rate declined to 4.2% in the three months to June from 4.4%. This reading came in below the market expectation of 4.5%. Additionally, the annual wage inflation, as measured by the change in the Average Earnings Excluding Bonus, edged lower to 5.4% in the same period from 5.7%, coming in above analysts’ estimate of 4.6%. With the immediate reaction, Pound Sterling gathered strength against its major rivals.
In the second half of the day, the US Bureau of Labor Statistics will release Producer Price Index (PPI) data for July. The immediate reaction to producer inflation data could be straightforward, with a stronger-than-forecast increase in the monthly PPI supporting the USD.
Nevertheless, investors could refrain from taking large positions ahead of the Consumer Price Index data from the UK and the US, which will be released on Wednesday.
The Relative Strength Index (RSI) indicator on the 4-hour chart stays above 60, highlighting a bullish bias in the near term. The Fibonacci 38.2% retracement level of the latest downtrend, the 100-period Simple Moving Average (SMA) and the 200-SMA form a stiff resistance area 1.2810-1.2820. In case GBP/USD rises above this area and starts using it as support, 1.2850 (Fibonacci 50% retracement) and 1.2900 (Fibonacci 61.8% retracement) could be seen as next resistance levels.
On the downside, supports are located at 1.2750 (Fibonacci 23.6% retracement, 50 period SMA), 1.2700 (psychological level, static level) and 1.2660 (end point of downtrend).
The Pound Sterling (GBP) is the oldest currency in the world (886 AD) and the official currency of the United Kingdom. It is the fourth most traded unit for foreign exchange (FX) in the world, accounting for 12% of all transactions, averaging $630 billion a day, according to 2022 data. Its key trading pairs are GBP/USD, aka ‘Cable’, which accounts for 11% of FX, GBP/JPY, or the ‘Dragon’ as it is known by traders (3%), and EUR/GBP (2%). The Pound Sterling is issued by the Bank of England (BoE).
The single most important factor influencing the value of the Pound Sterling is monetary policy decided by the Bank of England. The BoE bases its decisions on whether it has achieved its primary goal of “price stability” – a steady inflation rate of around 2%. Its primary tool for achieving this is the adjustment of interest rates. When inflation is too high, the BoE will try to rein it in by raising interest rates, making it more expensive for people and businesses to access credit. This is generally positive for GBP, as higher interest rates make the UK a more attractive place for global investors to park their money. When inflation falls too low it is a sign economic growth is slowing. In this scenario, the BoE will consider lowering interest rates to cheapen credit so businesses will borrow more to invest in growth-generating projects.
Data releases gauge the health of the economy and can impact the value of the Pound Sterling. Indicators such as GDP, Manufacturing and Services PMIs, and employment can all influence the direction of the GBP. A strong economy is good for Sterling. Not only does it attract more foreign investment but it may encourage the BoE to put up interest rates, which will directly strengthen GBP. Otherwise, if economic data is weak, the Pound Sterling is likely to fall.
Another significant data release for the Pound Sterling is the Trade Balance. This indicator measures the difference between what a country earns from its exports and what it spends on imports over a given period. If a country produces highly sought-after exports, its currency will benefit purely from the extra demand created from foreign buyers seeking to purchase these goods. Therefore, a positive net Trade Balance strengthens a currency and vice versa for a negative balance.
Gold price is retreating from near a one-week high of $2,473 set on Monday, as traders lock in gains ahead of the key US inflation reports. The US Producer Price Index (PPI) data will hog attention later on Tuesday while the US Consumer Price Index (CPI) inflation release will stand out on Wednesday.
Markets eagerly await the high-impact inflation data from the US to gauge whether a big interest-rate hike by the US Federal Reserve (Fed) is in the offing, especially following the weak jobs report, which triggered recessionary fears and ramped up aggressive Fed rate cut bets.
Markets are now pricing in about 50% chance of a 50 bps rate cut in September by the Fed, according to the CME Group’s FedWatch Tool. Meanwhile, the headline annual CPI is set to rise 2.9% in July afte increasing by 3.0% in June. Meanwhile, the core inflation is expected to edge a tad lower to 3.2% YoY in July versus June’s 3.3% print.
That said, the US headline annual PPI is seen rising 2.3% in July after reporting a 2.6% growth in June. The core PPI inflation is set to decline from 3.0% YoY in June to 2.7% in July. The likely progress in disinflation will pave the way for a notable easing by the Fed, which could bode well for the non-interest-bearing Gold price.
Amidst increased dovish Fed expecttions, the US Treasury bond yields remain on the losing end, also hit by the rife Middle East tensions, which drive risk-off flows into the safe-haven assets such as the US government bonds and Gold price.
The traditonal safety bet, Gold price, jumped over 1% on risk aversion, courtesy of the from heightened tensions in the Middle East. White House spokesman John Kirby said late Monday that Iran could launch ‘significant’ attack on Israel this week and that the timing could affect Gaza ceasefire talks, currently scheduled to resume on August 15.
“Israel’s military and Lebanon’s Hezbollah militant group have traded strikes since the current war in Gaza began, but tensions have escalated since an Israeli strike in a Beirut suburb killed a top Hezbollah commander last month. Hezbollah has vowed to retaliate,”per CNBC News.
On Sunday, Axios reported that the Israeli intelligence community is put on a high alert, as it is believed that Iran has decided to attack Israel directly and may do so within days.
Looking ahead, geopolitical developments between Israel and Iran-backed militant groups – Hamas and Hezbollah will continue to lead sentiment and impact the value of Gold price. US inflation data and speeches from Fed policymakers will be also closely followed.
As observed on the daily chart, Gold price accelerated its recovery mode and tested the upper boundary of a symmetrical triangle formation, then pegged at $2,473.
Hwever, Gold buyers fail to secure a daily candlestick closnig above that level triggernig a fresh pullback from near a weekly high.
The key leading indicator, the 14-day Relative Strength Index (RSI) has turned south but stays above the 50 level, suggesting that any pullback in Gold price is likely to be bought into so long as the 21-day Simple Moving Average (SMA) at $2,421 holds.
However, if the pullback extends, the 21-day SMA could give way to unleash further downside, with the immediate support then seen at $2,380, where the lower boundary of the triangle and the 50-day SMA converge.
Ahead of that demand area, the $2,400 threshold could rescue buyers.
Alternatively, acceptance above the aforesaid triangle resistance, now at $2,475, is critical to taking on the record high of $2,484, above which a test of the $2,500 mark will be inevitable.
The Producer Price Index released by the Bureau of Labor statistics, Department of Labor measures the average changes in prices in primary markets of the US by producers of commodities in all states of processing. Changes in the PPI are widely followed as an indicator of commodity inflation. Generally speaking, a high reading is seen as positive (or bullish) for the USD, whereas a low reading is seen as negative (or bearish).
Silver price (XAG/USD) retraces its recent gains from the previous session, trading around $27.70 during the Asian session on Tuesday. This downside could be attributed to diminished expectations for a 50-basis point interest rate cut by the US Federal Reserve in September.
US Federal Reserve (Fed) in September. According to CME’s FedWatch Tool, the probability of 50 basis points (bps) cut in September has dropped to 50%, down from 85% last week. However, the rate markets continue to price in a 100% chance of at least a 25 bps cut at the upcoming meeting.
Traders are likely to focus on US producer inflation data due on Tuesday and consumer inflation figures on Wednesday, looking for confirmation that price growth remains stable in the United States (US).
The downside of safe-haven metals like Silver could be restrained due to rising geopolitical tensions in the Middle East. Israeli forces pressed on with their operations near the southern Gaza city of Khan Younis on Monday. CBC News cited Palestinian medics saying Israeli military strikes on Khan Younis on Monday killed at least 18 people.
On Monday, Israel Defense Forces (IDF) intercepted around 30 “projectiles” crossing from Lebanon into northern Israel early Monday. The IDF stated that some projectiles landed in open areas, and no injuries were reported, as reported by ABC News.
Silver is a precious metal highly traded among investors. It has been historically used as a store of value and a medium of exchange. Although less popular than Gold, traders may turn to Silver to diversify their investment portfolio, for its intrinsic value or as a potential hedge during high-inflation periods. Investors can buy physical Silver, in coins or in bars, or trade it through vehicles such as Exchange Traded Funds, which track its price on international markets.
Silver prices can move due to a wide range of factors. Geopolitical instability or fears of a deep recession can make Silver price escalate due to its safe-haven status, although to a lesser extent than Gold’s. As a yieldless asset, Silver tends to rise with lower interest rates. Its moves also depend on how the US Dollar (USD) behaves as the asset is priced in dollars (XAG/USD). A strong Dollar tends to keep the price of Silver at bay, whereas a weaker Dollar is likely to propel prices up. Other factors such as investment demand, mining supply – Silver is much more abundant than Gold – and recycling rates can also affect prices.
Silver is widely used in industry, particularly in sectors such as electronics or solar energy, as it has one of the highest electric conductivity of all metals – more than Copper and Gold. A surge in demand can increase prices, while a decline tends to lower them. Dynamics in the US, Chinese and Indian economies can also contribute to price swings: for the US and particularly China, their big industrial sectors use Silver in various processes; in India, consumers’ demand for the precious metal for jewellery also plays a key role in setting prices.
Silver prices tend to follow Gold’s moves. When Gold prices rise, Silver typically follows suit, as their status as safe-haven assets is similar. The Gold/Silver ratio, which shows the number of ounces of Silver needed to equal the value of one ounce of Gold, may help to determine the relative valuation between both metals. Some investors may consider a high ratio as an indicator that Silver is undervalued, or Gold is overvalued. On the contrary, a low ratio might suggest that Gold is undervalued relative to Silver.
That being said though, if we can break above the 190 yen level, that could be a very bullish sign. At that point, we could go look into the 200 day EMA, perhaps even towards the previous uptrend line.
On the other hand, if the market were to fall from here, I think we could go looking to the 182 yen level. This is all about risk appetite and that will continue to be the case going forward. Looking at the chart, it’s obvious that volatility has been a major factor in this market, and I think we also have to keep an eye on whether or not the Bank of Japan has to give up its idea of doing everything it can to tighten monetary policy and save the end in the short term they’ve done a really good job but the question then becomes how long can they continue to tighten monetary policy without damaging their own economy which is essentially a bug looking for a windshield I do think eventually we get a bounce but in the meantime I expect to see a lot of noisy behavior
Ultimately, this is a market that is highly sensitive to risk parameters of the interest rate markets, and as a result, I think you will have to watch multiple markets at the same time, as the global markets continue to show a lot of concerns in general.
Want to begin trading our daily Forex forecasts? Get our most recommended Forex brokers to open a demo account with.
“June producer price inflation was a bit stronger than expected, but most of the strength came from a jump in trade services prices (i.e., wholesaler margins). Still not likely enough for a Fed rate cut in a couple weeks, but it certainly should be enough to get the Fed to start setting the stage at the July FOMC meeting for the first rate cut of this cycle in Sept.”
Producer prices were up 0.2% in June after stalling in May.
USD/JPY trends will hinge on the producer price data from Japan and the US. Diverging trends favoring the Yen could signal a USD/JPY drop toward 145. However, central bank comments may influence the USD/JPY pairing more. The USD/JPY may fall toward the August 5 low of 141.648 if support increases for multiple Fed rate cuts or recession fears intensify.
Investors should remain alert. Monitor real-time data, central bank insights, and expert commentary to adjust your trading strategies accordingly. Stay updated with our latest news and analysis to manage USD/JPY volatility.
The USD/JPY hovered below the 50-day and 200-day EMAs, confirming the bearish price trends.
A USD/JPY breakout from the 148.529 resistance level and the top trend line could signal a move toward 150. Furthermore, a break above 150 could bring the 151.685 resistance level into play.
Producer prices and central bank commentary require consideration on Tuesday.
Conversely, a drop below 147 could give the bears a run at the 145.891 support level. A fall through the 145.891 support level may bring the 143.495 support level into play.
The 14-day RSI at 31.37 indicates a USD/JPY drop below 147 before entering oversold territory.