The main category of Forex News.
You can use the search box below to find what you need.
[wd_asp id=1]
The main category of Forex News.
You can use the search box below to find what you need.
[wd_asp id=1]
You have reached your limit of 5 free articles for this month.
Access all our articles, insights, and analysts.
Your coupon code
Gold price struggles to regain the $2,400 mark on Tuesday, hovering just below the threshold with a modest intraday positive tone. XAU/USD trades rangebound as speculative interest assesses news from the United States (US) ahead of the Federal Reserve (Fed) monetary policy decision on Wednesday.
Meanwhile, the US Bureau of Labor Statistics (BLS) released the June Job Openings and Labor Turnover Survey (JOLTS) report, which showed that openings on the last business day of the month stood at 8.184 million, below the upwardly revised 8.23 million posted in May. Additionally, the Conference Board (CB) revealed that the Consumer Confidence Index rose in July to 100.3 from a downwardly revised 97.8 in June.
Anyway, the focus remains on upcoming central banks’ decisions. Ahead of the Asian opening, market talks suggest the Bank of Japan (BoJ) could discuss raising rates to 0.25%. Expectations also point to a reduction in government bond purchases. The one thing clear is that the BoJ can no longer remain on hold.
Later on Wednesday, the Fed will take the stage. The US central bank is widely anticipated to keep interest rates unchanged, although market participants hope policymakers will provide clues on a September rate cut. Ever since Chairman Jerome Powell adopted a more dovish speech, hopes for two interest rate cuts before year-end have skyrocketed.
From a technical point of view, the bearish potential for XAU/USD seems limited. In the daily chart, the pair is trading just below a still bullish 20 Simple Moving Average (SMA) while the longer moving averages maintain their upward slopes far below the current level. Technical indicators, in the meantime, remain directionless just above their midlines, as the bright metal remains confined to a tight range for a second consecutive day.
In the near term, and according to the 4-hour chart, XAU/USD is neutral-to-bullish. The pair is trading just above the 50% Fibonacci retracement of the June/July rally at $2,388.25 while still contained between directionless moving averages. However, technical indicators have picked up modestly within positive levels, skewing the risk to the upside.
Support levels: 2,388.25 2,366.30 2,353.00
Resistance levels: 2,403.10 2,418.15 2,431.30
Gold price struggles to regain the $2,400 mark on Tuesday, hovering just below the threshold with a modest intraday positive tone. XAU/USD trades rangebound as speculative interest assesses news from the United States (US) ahead of the Federal Reserve (Fed) monetary policy decision on Wednesday.
Meanwhile, the US Bureau of Labor Statistics (BLS) released the June Job Openings and Labor Turnover Survey (JOLTS) report, which showed that openings on the last business day of the month stood at 8.184 million, below the upwardly revised 8.23 million posted in May. Additionally, the Conference Board (CB) revealed that the Consumer Confidence Index rose in July to 100.3 from a downwardly revised 97.8 in June.
Anyway, the focus remains on upcoming central banks’ decisions. Ahead of the Asian opening, market talks suggest the Bank of Japan (BoJ) could discuss raising rates to 0.25%. Expectations also point to a reduction in government bond purchases. The one thing clear is that the BoJ can no longer remain on hold.
Later on Wednesday, the Fed will take the stage. The US central bank is widely anticipated to keep interest rates unchanged, although market participants hope policymakers will provide clues on a September rate cut. Ever since Chairman Jerome Powell adopted a more dovish speech, hopes for two interest rate cuts before year-end have skyrocketed.
From a technical point of view, the bearish potential for XAU/USD seems limited. In the daily chart, the pair is trading just below a still bullish 20 Simple Moving Average (SMA) while the longer moving averages maintain their upward slopes far below the current level. Technical indicators, in the meantime, remain directionless just above their midlines, as the bright metal remains confined to a tight range for a second consecutive day.
In the near term, and according to the 4-hour chart, XAU/USD is neutral-to-bullish. The pair is trading just above the 50% Fibonacci retracement of the June/July rally at $2,388.25 while still contained between directionless moving averages. However, technical indicators have picked up modestly within positive levels, skewing the risk to the upside.
Support levels: 2,388.25 2,366.30 2,353.00
Resistance levels: 2,403.10 2,418.15 2,431.30
The Australian dollar has gone back and forth during the last couple of days and as we currently stand, it looks like the 0.6550 level remains a bit of a magnet for price. Quite frankly, the market is taking a break after a severe beating over the last couple of trading sessions, going back really about two and a half weeks where we plunged from the 0.6790 region. At this point, we have to question whether or not the market is able to continue this type of downward pressure, or will we get a relief rally?
As things stand right now, it looks like we’re just content to go sideways. We could be forming a little bit of a basing pattern, but we would need to see the 0.6575 level taken to the upside to even start to think about that. Furthermore, we have a Federal Reserve meeting on Wednesday, which will probably be the catalyst, regardless of which direction we go.
Once we get a read on the Federal Reserve monetary policy, that will affect the dollar, and of course the Australian dollar will react in kind against that greenback. So, we’ll just have to wait and see. I suspect we probably have another 24 hours or so of this sideways action. After that, I would hope that things become much clearer. This is a market that also has a lot of input from risk appetite, so make sure you understand that as well.
For a look at all of today’s economic events, check out our economic calendar.
This article was originally posted on FX Empire
As for the outlook for the currency pair, we look for a gentle pullback to the 50-day moving average at 1.0811 in the coming days. Also, note that this is the approximate location of the 38.2% Fibonacci retracement from the 2024 high to low. Technically, a break of the EUR/USD support level of 1.0780 would reinforce the bears’ position of control over the trend.
We expect potential volatility in the euro exchange rate from Tuesday when the eurozone CPI inflation figures start to come in, with the initial focus on the German figure. According to the economic calendar, the state-level figures are released from 7am German time, which could give early guidance for the full German figure due later in the day. This, along with the Spanish CPI release, could give some direction for how the eurozone inflation figure will turn out mid-week. The eurozone is expected to post a 2.3% year-on-year figure, which is consistent with an ongoing process of deflation. The European Central Bank is expected to cut interest rates again in September, meaning it would take a big surprise in the data to have a lasting impact on the euro. Instead, it is the US dollar side of the equation that will provide the volatility this week. The Federal Reserve is due to release its policy decision on Wednesday. Moreover, there will be no change in US interest rates. We expect dovish guidance in line with expectations for the first interest rate in September. Now, the market is “fully priced in” for such an outcome, meaning the US dollar will rally if the Fed casts any doubt on the shot at starting its rate-cutting cycle in September. Furthermore, we expect the Fed to continue its new strategy of highlighting concerns that keeping interest rates unchanged for too long could negatively impact the labor market.
Concurrently, this is consistent with the Fed saying it believes it can afford to cut US interest rates before inflation falls to its 2.0% target. On Friday, the most important event for the US dollar comes when the US jobs report is released. If the data comes in below expectations, the market will price in more policy easing from the US Federal Reserve in the coming months, which will weigh on the dollar.
The US non-farm payrolls data for July is expected to show an increase of +178K jobs, with the unemployment rate remaining at 4.1%. This comes after a stronger-than-expected reading of +206K jobs in June.

There is no change in my technical view of the performance of the Euro against the US Dollar EUR/USD as the general trend will remain bearish and breaking the support 1.0800 is possible and will strengthen the bears’ control of the trend and thus prepare for stronger losses. Furthermore, the technical indicators will move towards strong oversold levels on the daily chart if the Euro Dollar price moves towards the support levels 1.0735 and 1.0600 respectively. On the other hand, and for the same time period, the psychological resistance 1.1000 will remain the most important for the upward shift of the general trend.
Ready to start trading the EUR/USD daily forecasts? Get our top Forex brokers list we recommend here.
According to the economic calendar, the Bank of England decision this week will be the main focus for the pound, and the market is currently split 50/50 on whether the bank will go ahead with a rate cut. The heightened uncertainty means that markets will be sensitive to the outcome, and as such, we could see some high volatility this week.
Our general outlook for this week is for weakness in the near term as traders position themselves for potential volatility. Thus, this caution could reflect GBP/USD weakness, and a pullback towards 1.28 cannot be ruled out in the near term. A pullback to this level is likely to be more likely if global equity markets continue to struggle; last week we saw the pound come under pressure amid a broad sell-off in equity markets, a reminder that the exchange rate is sensitive to broader sentiment.
Currently, financial markets are pricing in just over a 50% chance of a rate cut on Thursday. Sterling’s weakness last week certainly reflects a rebuilding of this expectation, with the odds of a cut now closer to 40%. Also, the market has built up a record long position in sterling over recent weeks as investors look for further outperformance. Meanwhile, the risk is that this crowded positioning will be eroded by any disappointment, exposing sterling to a deeper pullback. Even in the case of a hawkish cut, we tend to think that markets will continue to sell sterling on a cut as positions are pared back, a “hawkish cut” being when the Bank cuts interest rates but signals to the markets that further cuts are not guaranteed and are dependent on upcoming economic data.
This could provide some upward relief for the GBP, which could rebound towards the end of the week, especially if the US jobs report on Friday falls short of expectations. However, the rise in GBP/USD is likely to be limited as the bank will surely “pave the way” for a rate cut in September. According to analysts at Oxford Economics, “the conditions are ripe for the MPC to cut, but we think it will wait until September to avoid surprising the markets.” A strong commitment to a rate cut in September would make this a “dovish hold,” which does not entirely align with a GBP recovery.
Beyond short-term weakness prospects, Bank of America sees the structural backdrop still supportive for the GBP: “Excluding event risks and with the new government in a hurry to announce policy, we look for further GBP appreciation in the coming months. Asset investment remains supportive, but near-term positioning is crowded.”
Furthermore, this fits into the broader theme of near-term weakness before a resumption of the rally sometime in the coming weeks.
Turning to the US dollar, the Federal Reserve is expected to release its policy decision on Wednesday. No change in US interest rates will be made. Instead, we expect a dovish tone in line with expectations for the first rate cut in September. Concurrently, the market is now “fully priced in” for such an outcome, meaning the US dollar will rally if the Fed casts any doubt on the launch of a rate-cutting cycle in September. Moreover, we expect the Fed to continue its new strategy of highlighting concerns that keeping rates on hold for too long could be detrimental to the labor market.
This aligns with the Fed’s statement that it believes it can afford to cut interest rates before inflation falls back to its 2.0% target. Decisively, the most important event for the US dollar comes on Friday when the US jobs report is released. If the data comes in below expectations, the market will price in further policy easing from the Fed in the coming months, which will weigh on the dollar.
We believe that any weakness in the GBP/USD from here could lead to a decline in the exchange rate back to the 1.2760 area. Technically, this aligns with the 38.2% Fibonacci retracement of the April to July rise and considers the 50-day moving average (DMA) at 1.2780. The 50-day moving average halted the decline in June, where the uptrend was confirmed again.
Get ready to trade the GBP/USD daily forecasts. Open a Forex account with a broker that works for UK traders here.
The USD/JPY outlook shows a mild bullish move as the pair recovers ahead of monetary policy meetings in Japan and the US. Investors are eyeing a potential rate hike from the Bank of Japan on Wednesday. Meanwhile, expectations suggest the Fed will maintain its current rates.
–Are you interested in learning more about Forex robots? Check our detailed guide-
Last week, the yen gained over 2% against the US dollar amid increased expectations for a BoJ rate hike. Investors have gained confidence in a hike because of increased pressure to support the weak yen. As a result, there is a 63% chance that Japan’s central bank will announce a 10bps rate hike tomorrow.
However, experts have warned that there is a risk the central bank might disappoint. The BoJ has surprised markets many times before. If there is no rate hike tomorrow, it might be a dark day for the yen.
Meanwhile, traders also anticipate the BoJ’s announcement of plans to reduce its bond purchases. Such an outcome would show confidence that Japan’s economy is on steadier ground, which could propel the yen higher.
On the Fed’s side, investors will focus on economic projections and Powell’s message. At the last meeting, the Fed projected one rate cut in December, which led to a decline in September’s rate cut expectations. If policymakers maintain this outlook, rate-cut bets will fall again, boosting the dollar. However, market participants expect a more dovish outlook given the recent cooler inflation. Notably, policymakers could signal the first cut in September.
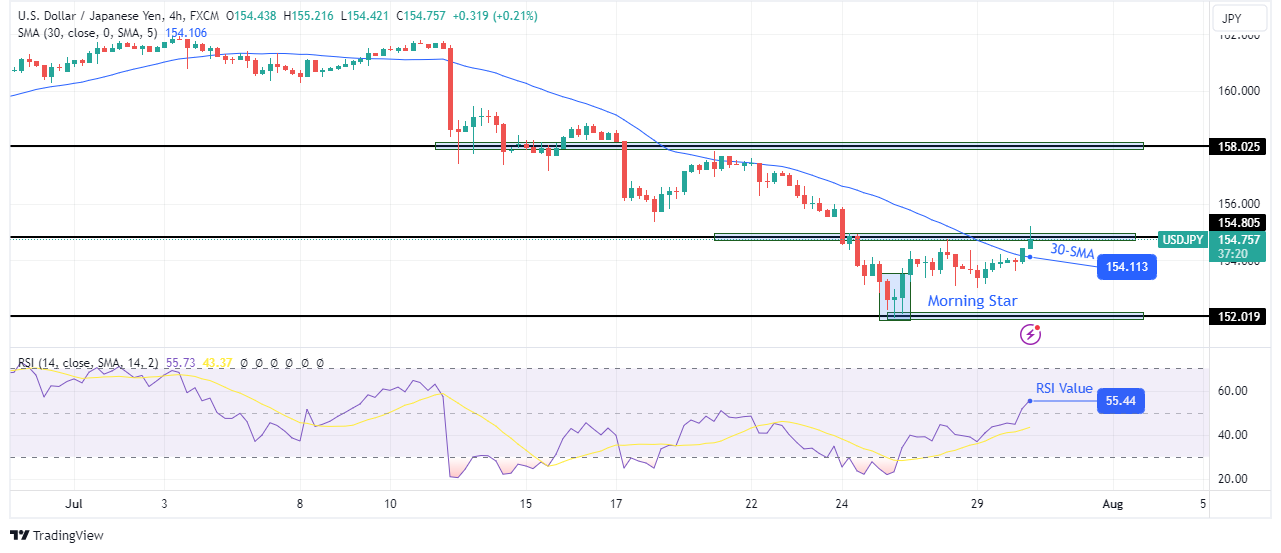
On the technical side, the USD/JPY price has broken above the 30-SMA, indicating a shift in control from bears to bulls. The RSI also shows a shift in sentiment, having broken above 50. This new move comes after the downtrend paused at the 152.01 support level.
–Are you interested in learning more about XRP price prediction? Check our detailed guide-
At this point, the price made a Morning Star candlestick pattern, signaling a looming bullish reversal. Since then, bulls have taken charge and broken above the 30-SMA. However, they face a solid barrier at the 154.80 key level. A break above would clear the path to the next resistance at 158.02.
Looking to trade forex now? Invest at eToro!
68% of retail investor accounts lose money when trading CFDs with this provider. You should consider whether you can afford to take the high risk of losing your money.
You have reached your limit of 5 free articles for this month.
Access all our articles, insights, and analysts.
Your coupon code
EUR/USD came under renewed bearish pressure on Monday and fell to its weakest level in three weeks near 1.0800. Although the pair managed to erase a small portion of its losses, it is having a tough time gathering recovery momentum ahead of Tuesday’s key macroeconomic data releases.
The table below shows the percentage change of Euro (EUR) against listed major currencies this week. Euro was the weakest against the New Zealand Dollar.
| USD | EUR | GBP | JPY | CAD | AUD | NZD | CHF | |
|---|---|---|---|---|---|---|---|---|
| USD | 0.31% | 0.08% | 0.67% | 0.10% | -0.09% | -0.09% | 0.32% | |
| EUR | -0.31% | -0.26% | 0.35% | -0.18% | -0.36% | -0.40% | 0.03% | |
| GBP | -0.08% | 0.26% | 0.58% | 0.05% | -0.10% | -0.13% | 0.29% | |
| JPY | -0.67% | -0.35% | -0.58% | -0.58% | -0.73% | -0.75% | -0.30% | |
| CAD | -0.10% | 0.18% | -0.05% | 0.58% | -0.17% | -0.22% | 0.23% | |
| AUD | 0.09% | 0.36% | 0.10% | 0.73% | 0.17% | -0.01% | 0.39% | |
| NZD | 0.09% | 0.40% | 0.13% | 0.75% | 0.22% | 0.01% | 0.43% | |
| CHF | -0.32% | -0.03% | -0.29% | 0.30% | -0.23% | -0.39% | -0.43% |
The heat map shows percentage changes of major currencies against each other. The base currency is picked from the left column, while the quote currency is picked from the top row. For example, if you pick the Euro from the left column and move along the horizontal line to the US Dollar, the percentage change displayed in the box will represent EUR (base)/USD (quote).
The cautious mood at the beginning of the week helped the US Dollar (USD) stay resilient against its major rivals. In the second half of the day, the mixed action seen in Wall Street allowed the USD to preserve its strength and limited EUR/USD’s rebound.
Early Tuesday, the data from Germany showed that the Gross Domestic Product contracted at an annual rate of 0.1% in the second quarter. This reading, however, failed to trigger a noticeable market reaction.
Germany’s Destatis will release Consumer Price Index (CPI) data for July later in the session. Investors expect the CPI to rise 0.2% on a monthly basis following the 0.1% increase recorded in June. A stronger-than-forecast monthly CPI reading could help the Euro find demand with the immediate reaction. Nevertheless, investors could refrain from taking large positions based on this data alone, especially ahead of the Federal Reserve’s monetary policy announcements on Wednesday.
On Tuesday, the US economic docket will feature Conference Board’s Consumer Confidence data for July and JOLTS Job Openings for June. If there is a significant increase in job openings, the USD could hold its ground and weigh on EUR/USD.
The Relative Strength Index (RSI) indicator on the 4-hour chart stays well below 50 despite edging slightly higher in the European morning on Tuesday.
EUR/USD holds above the 1.0800-1.0810 support area, where the 100-day and the 200-day SMAs are located. If this support fails, 1.0740 (Fibonacci 78.6% retracement of the latest uptrend) could be seen as next bearish target before 1.0700 (psychological level, static level).
On the upside, first resistance aligns at 1.0840 (Fibonacci 38.2% retracement) ahead of 1.0860 (100-period SMA) and 1.0880 (Fibonacci 23.6% retracement).
A country’s Gross Domestic Product (GDP) measures the rate of growth of its economy over a given period of time, usually a quarter. The most reliable figures are those that compare GDP to the previous quarter e.g Q2 of 2023 vs Q1 of 2023, or to the same period in the previous year, e.g Q2 of 2023 vs Q2 of 2022. Annualized quarterly GDP figures extrapolate the growth rate of the quarter as if it were constant for the rest of the year. These can be misleading, however, if temporary shocks impact growth in one quarter but are unlikely to last all year – such as happened in the first quarter of 2020 at the outbreak of the covid pandemic, when growth plummeted.
A higher GDP result is generally positive for a nation’s currency as it reflects a growing economy, which is more likely to produce goods and services that can be exported, as well as attracting higher foreign investment. By the same token, when GDP falls it is usually negative for the currency. When an economy grows people tend to spend more, which leads to inflation. The country’s central bank then has to put up interest rates to combat the inflation with the side effect of attracting more capital inflows from global investors, thus helping the local currency appreciate.
When an economy grows and GDP is rising, people tend to spend more which leads to inflation. The country’s central bank then has to put up interest rates to combat the inflation. Higher interest rates are negative for Gold because they increase the opportunity-cost of holding Gold versus placing the money in a cash deposit account. Therefore, a higher GDP growth rate is usually a bearish factor for Gold price.
EUR/USD came under renewed bearish pressure on Monday and fell to its weakest level in three weeks near 1.0800. Although the pair managed to erase a small portion of its losses, it is having a tough time gathering recovery momentum ahead of Tuesday’s key macroeconomic data releases.
The table below shows the percentage change of Euro (EUR) against listed major currencies this week. Euro was the weakest against the New Zealand Dollar.
| USD | EUR | GBP | JPY | CAD | AUD | NZD | CHF | |
|---|---|---|---|---|---|---|---|---|
| USD | 0.31% | 0.08% | 0.67% | 0.10% | -0.09% | -0.09% | 0.32% | |
| EUR | -0.31% | -0.26% | 0.35% | -0.18% | -0.36% | -0.40% | 0.03% | |
| GBP | -0.08% | 0.26% | 0.58% | 0.05% | -0.10% | -0.13% | 0.29% | |
| JPY | -0.67% | -0.35% | -0.58% | -0.58% | -0.73% | -0.75% | -0.30% | |
| CAD | -0.10% | 0.18% | -0.05% | 0.58% | -0.17% | -0.22% | 0.23% | |
| AUD | 0.09% | 0.36% | 0.10% | 0.73% | 0.17% | -0.01% | 0.39% | |
| NZD | 0.09% | 0.40% | 0.13% | 0.75% | 0.22% | 0.01% | 0.43% | |
| CHF | -0.32% | -0.03% | -0.29% | 0.30% | -0.23% | -0.39% | -0.43% |
The heat map shows percentage changes of major currencies against each other. The base currency is picked from the left column, while the quote currency is picked from the top row. For example, if you pick the Euro from the left column and move along the horizontal line to the US Dollar, the percentage change displayed in the box will represent EUR (base)/USD (quote).
The cautious mood at the beginning of the week helped the US Dollar (USD) stay resilient against its major rivals. In the second half of the day, the mixed action seen in Wall Street allowed the USD to preserve its strength and limited EUR/USD’s rebound.
Early Tuesday, the data from Germany showed that the Gross Domestic Product contracted at an annual rate of 0.1% in the second quarter. This reading, however, failed to trigger a noticeable market reaction.
Germany’s Destatis will release Consumer Price Index (CPI) data for July later in the session. Investors expect the CPI to rise 0.2% on a monthly basis following the 0.1% increase recorded in June. A stronger-than-forecast monthly CPI reading could help the Euro find demand with the immediate reaction. Nevertheless, investors could refrain from taking large positions based on this data alone, especially ahead of the Federal Reserve’s monetary policy announcements on Wednesday.
On Tuesday, the US economic docket will feature Conference Board’s Consumer Confidence data for July and JOLTS Job Openings for June. If there is a significant increase in job openings, the USD could hold its ground and weigh on EUR/USD.
The Relative Strength Index (RSI) indicator on the 4-hour chart stays well below 50 despite edging slightly higher in the European morning on Tuesday.
EUR/USD holds above the 1.0800-1.0810 support area, where the 100-day and the 200-day SMAs are located. If this support fails, 1.0740 (Fibonacci 78.6% retracement of the latest uptrend) could be seen as next bearish target before 1.0700 (psychological level, static level).
On the upside, first resistance aligns at 1.0840 (Fibonacci 38.2% retracement) ahead of 1.0860 (100-period SMA) and 1.0880 (Fibonacci 23.6% retracement).
A country’s Gross Domestic Product (GDP) measures the rate of growth of its economy over a given period of time, usually a quarter. The most reliable figures are those that compare GDP to the previous quarter e.g Q2 of 2023 vs Q1 of 2023, or to the same period in the previous year, e.g Q2 of 2023 vs Q2 of 2022. Annualized quarterly GDP figures extrapolate the growth rate of the quarter as if it were constant for the rest of the year. These can be misleading, however, if temporary shocks impact growth in one quarter but are unlikely to last all year – such as happened in the first quarter of 2020 at the outbreak of the covid pandemic, when growth plummeted.
A higher GDP result is generally positive for a nation’s currency as it reflects a growing economy, which is more likely to produce goods and services that can be exported, as well as attracting higher foreign investment. By the same token, when GDP falls it is usually negative for the currency. When an economy grows people tend to spend more, which leads to inflation. The country’s central bank then has to put up interest rates to combat the inflation with the side effect of attracting more capital inflows from global investors, thus helping the local currency appreciate.
When an economy grows and GDP is rising, people tend to spend more which leads to inflation. The country’s central bank then has to put up interest rates to combat the inflation. Higher interest rates are negative for Gold because they increase the opportunity-cost of holding Gold versus placing the money in a cash deposit account. Therefore, a higher GDP growth rate is usually a bearish factor for Gold price.
I think we’ve got a situation where if we can break above the top of the candlestick, we could go looking to the 1.30 level. In general, I do think that this is a pair that probably looks to the upside, but this is a market that has a lot to pay attention to this week, especially as we have central bank meetings coming up from the Federal Reserve, several others, including the Bank of England.
So, GBP/USD is a pair that I think continues to be very volatile, but right now looks as if it is trying to do everything it can to continue the overall uptrend. Because of that, if we break down below the bottom of the candlestick for the day, perhaps breaking below the 1.28 level, it’s really not until we get underneath air that I start to think about shorting, but even then, I’d have to see what was going on.
After all, then you have to start to ask questions about whether or not the US dollar is strengthening due to something going on in America, or if it is a concern about risk appetite in general. Furthermore, the Bank of England could say or do something to throw the markets into disarray. As things stand right now, it looks like we are trying to grind higher, and the phrase “grind” might be the best way to describe what’s going on period.
Ready to trade our Forex daily analysis and predictions? Here are the top UK forex trading platforms to choose from.
You have reached your limit of 5 free articles for this month.
Access all our articles, insights, and analysts.
Your coupon code
Spot Gold turned south after Wall Street’s opening and after spending the first half of the day consolidating just below $2,400. XAU/USD fell towards $2,369.57 and trades nearby as investors gear up for critical events spread throughout the week. Financial markets started the week with a firm footing, with Asian stocks posting substantial gains. European indexes, on the contrary, lost ground, leading to a tepid performance among their United States (US) counterparts.
US indexes hold on to modest intraday gains at the moment, with speculative interest focused on upcoming earnings reports and central banks’ decisions. The Bank of Japan (BoJ) will announce its decision on monetary policy early on Wednesday, followed later in the day by the US Federal Reserve (Fed). Finally, the Bank of England (BoE) will unveil its decision on Thursday.
Ahead of the announcements, financial markets are pricing in some adjustments. The BoJ is foreseen to reduce the monthly purchases of Japan Government Bonds (JGB), while the Fed is likely to pave the way for a September cut. As for the BoE, market players anticipate a 25 basis point (bps) rate cut.
The daily chart for XAU/USD shows the risk skews to the downside, although additional confirmation is required. The bright metal trades below a still bullish 20 Simple Moving Average (SMA), but technical indicators turned back south within neutral levels. At the same time, the pair is approaching the 61.8% Fibonacci retracement of its June/July run at $2,366.30, the immediate support level. The 50% retracement at 2,403.10 acts as near-term resistance.
Technical readings in the 4-hour chart offer a neutral-to-bearish stance. XAU/USD is currently trading below a bearish 20 SMA, while a mildly bearish 200 SMA reinforces the support at around $2,366.00. Technical indicators, in the meantime, lack directional strength, with the Relative Strength Index (RSI) indicator currently consolidating at around 42, skewing the risk to the downside without confirming it.
Support levels: 2,366.30 2,353.00 2,339.65
Resistance levels: 2,388.25 2,403.10 2,418.15
Spot Gold turned south after Wall Street’s opening and after spending the first half of the day consolidating just below $2,400. XAU/USD fell towards $2,369.57 and trades nearby as investors gear up for critical events spread throughout the week. Financial markets started the week with a firm footing, with Asian stocks posting substantial gains. European indexes, on the contrary, lost ground, leading to a tepid performance among their United States (US) counterparts.
US indexes hold on to modest intraday gains at the moment, with speculative interest focused on upcoming earnings reports and central banks’ decisions. The Bank of Japan (BoJ) will announce its decision on monetary policy early on Wednesday, followed later in the day by the US Federal Reserve (Fed). Finally, the Bank of England (BoE) will unveil its decision on Thursday.
Ahead of the announcements, financial markets are pricing in some adjustments. The BoJ is foreseen to reduce the monthly purchases of Japan Government Bonds (JGB), while the Fed is likely to pave the way for a September cut. As for the BoE, market players anticipate a 25 basis point (bps) rate cut.
The daily chart for XAU/USD shows the risk skews to the downside, although additional confirmation is required. The bright metal trades below a still bullish 20 Simple Moving Average (SMA), but technical indicators turned back south within neutral levels. At the same time, the pair is approaching the 61.8% Fibonacci retracement of its June/July run at $2,366.30, the immediate support level. The 50% retracement at 2,403.10 acts as near-term resistance.
Technical readings in the 4-hour chart offer a neutral-to-bearish stance. XAU/USD is currently trading below a bearish 20 SMA, while a mildly bearish 200 SMA reinforces the support at around $2,366.00. Technical indicators, in the meantime, lack directional strength, with the Relative Strength Index (RSI) indicator currently consolidating at around 42, skewing the risk to the downside without confirming it.
Support levels: 2,366.30 2,353.00 2,339.65
Resistance levels: 2,388.25 2,403.10 2,418.15
After an erosion of platinum stockpiles in 2023 as industrial demand hit record highs, while demand outstripped mine supply by 851,000 ounces. Halfway through 2024, these trends are still playing out.
Read on to find out more about how platinum performed in the first half of this year.
How did platinum perform in H1 2024?
Platinum prices spent much of the first quarter in decline, falling from US$987.50 per ounce on January 1 to a year-to-date low of US$871.67 on February 9. The start of March saw increasing volatility in the platinum market, with prices moving up slightly during the month as prices for gold and silver improved.
Chart via Trading Economics.
Platinum started the second quarter at US$901.64 and climbed as high as US$980 before pulling back to US$900 by late April. The price ran even higher in May and reached a year-to-date high of US$1,094.50 on May 17.
While platinum prices pulled back again, the floor hit on June 13 was higher this time, at US$949.34.
After climbing above US$1,000 again in late June, platinum ended Q2 at US$994.40 on June 28. The start of Q3 has seen the platinum price fall further, moving as low as US$932.74 on July 25. It was around US$950 as of July 29.
What factors drove platinum demand in H1 2024?
The World Platinum Investment Council’s (WPIC) first quarter update shows that the market was in deficit by 369,000 ounces during the period, with a full-year shortfall of 476,000 ounces forecast.
According to the report, these dynamics are in part due to strong automotive demand, which reached a seven year high in Q1. Platinum has been increasingly substituted for palladium in autocatalysts due to palladium’s high price.
Despite increased demand for platinum from the automotive sector, its use in the coming years is facing headwinds as consumers continue to move to electric vehicles, which don’t require platinum or palladium. To platinum’s benefit, the WPIC notes that market share of battery electric vehicles is now forecast to grow only from 11 percent in 2023 to 14 percent in 2024 — down from the 15 percent initially predicted.
In a mid-July platinum-group metals webinar hosted by CPM Group, Rohit Savant, CPM’s vice president of research, indicated that despite increased platinum demand, the needle on prices hasn’t budged.
Additionally, Savant explained that massive amounts of inventories have built up over the past decade, which has led to “investor reluctance to add metal aggressively to holdings due to risk of loss of demand from the auto sector.”
He noted that these inventories can provide further headwinds when supply and demand fundamentals are not strong, which has been the situation for the past several years.
According to the WPIC, these inventories accounted for 4.1 million ounces at the end of 2023. With forecast deficits, the group is expecting those inventories to fall to 3.62 million ounces by the end of 2024.
Meanwhile, investment demand is changing. Savant noted that 2023 saw platinum exchange-traded funds (ETFS) in decline. This is supported by WPIC data showing that the last half of the year saw more than 215,000 ounces of ETF outflows. Bar and coin demand was relatively stable during the period, with net inflows of 147,000 ounces.
The first quarter of 2024 saw a reversal of this trend, with platinum ETFs adding 11,000 ounces, and bar and coin investment for the precious metal growing by 64,000 ounces.
Savant acknowledged this reversal with data that extends into the second quarter.
“Investors were solid buyers of the metal,” he said. “These investors have been seen buying when prices fall and pulling back when prices rise. This tells us that these investors do not necessarily see too much downside from here, but are still nervous about chasing (the) platinum price higher.”
What factors impacted platinum supply in H1 2024?
Total platinum supply for Q1 was 1.625 million ounces from all sources, marking the second lowest quarterly supply on WPIC records, behind Q2 2020’s 1.3 million ounces. In its report, the WPIC states that it expects supply risks to remain a theme through 2024; it predicts that total mine supply will decrease by 3 percent on an annual basis.
Mine production increased in the first quarter on an annualized basis, rising to 1.24 million ounces from 1.19 million ounces during the same period in 2023. The rise came from higher output from mines in top-producer South Africa, which produced 816,000 ounces versus 778,000 ounces in Q1 2023.
The WPIC data also suggests that recycled supply during the quarter was stable, with 390,000 ounces entering the market, slightly lower than Q1 2023’s 400,000 ounces. The bulk of recycled platinum was generated by autocatalyst recycling, which produced 275,000 ounces of the metal.
What will happen to the platinum price in 2024?
Despite the platinum market imbalance, overall sentiment remains positive. Even as an overhang in stockpiled inventories provides headwinds, the metal still has strong demand from industrial sources.
With the platinum to palladium ratio above 1, some investors are wondering whether automakers will begin to swap palladium for platinum again. However, Savant doesn’t see this materializing until the ratio gets higher.
“The reality is that autocatalyst manufacturers are unable to and do not make changes to autocatalysts and chemistry on the turn of a dime,” he explained during CPM’s webinar.
“There’s a lot of money and time required to make these changes and align them with emission regulations and auto insurance. So it will take a much higher ratio than what we’re seeing, and a ratio that remains consistently high.”
As automotive demand is expected to remain high, potentially allowing inventories to start depleting, the physical market could begin to tighten and provide support for upward price momentum. However, it may be some time before these inventories draw down sufficiently to provide that support.
Don’t forget to follow us @INN_Resource for real-time updates!
Securities Disclosure: I, Dean Belder, hold no direct investment interest in any company mentioned in this article.
From Your Site Articles
Related Articles Around the Web
The CB Consumer Confidence Index will draw investor interest on Tuesday, July 30. Economists forecast the Index to fall from 100.4 in June to 99.9 in July.
Downward trends in consumer confidence could affect consumer spending, dampening demand-driven inflation. Softer inflation may enable the Fed to cut interest rates more often than expected to deliver price stability.
Beyond the headline number, the Expectations Index also requires consideration. The Index considers consumers’ outlook for income, business, and labor market conditions. Concerns about the economy and labor market conditions may impact consumer confidence further.
The Expectations Index fell from 74.9 in May to 73.0 in June. According to The Conference Board, the Index has been below 80 for five months. An Index below 80 is usually a recession warning, supporting a USD/JPY fall toward 150.
Private consumption contributes about 70% to the US economy. The US economy could falter if consumers tighten their purse strings.
However, investors should also consider labor market data.
Economists predict JOLTs Job Openings will drop from 8.14 million in May to 8.05 million in June. A fall below 8.00 million could fuel speculation about multiple 2024 Fed rate cuts.
A deteriorating labor market may also impact wage growth and lower disposable income.
A marked deterioration in US labor market conditions could support a USD/JPY drop below 150.