The main category of Forex News.
You can use the search box below to find what you need.
[wd_asp id=1]
The main category of Forex News.
You can use the search box below to find what you need.
[wd_asp id=1]
Gold price remains on the defensive for the third day in a row, kicking off the week cautiously early Monday. Gold traders are now looking for more US economic data, including the ISM Services PMI due later Monday for fresh trading impetus.
Despite risk-off sentiment in full swing in Asian trading on Monday, Gold price struggles to benefit, as markets resort to ‘sell everything’ mode. Risk-aversion is mainly triggered by growing concerns that the US economy is headed for recession, in the aftermath of a weak jobs report on Friday.
Nonfarm payrolls increased by 114,000 jobs last month after rising by a downwardly revised 179,000 in June, the US Bureau of Labor Statistics (BLS) said on Friday. The Unemployment Rate climbed to 4.3% from 4.1% in June while the Labor Force Participation Rate advanced slightly to 62.7% from 62.6%.
Mounting US recession fears prompted markets wager aggressive US Federal Reserve (Fed) easing in September. Markets are predicting 115 bps of cuts this year, with traders pricing in a 74% chance of the Fed lowering rates by 50 bps in September, compared to an 11.5% chance a week earlier, according to the CME FedWatch tool.
Risk-aversion heightened in Asia also after US Secretary of State Tony Blinken during the G7 meeting on Sunday that an attack by Iran and Hezbollah against Israel could start as early as Monday, Axios reported, citing three sources.
The US S&P 500 futures, a risk barometer, are down 0.55% on the day, as of writing. Asian markets are on a downward spiral, led by a 6% slump in the Japanese Nikkei 225 index.
Dovish Fed expectations are offsetting the risk-off mood, not allowing the US Dollar to attract some haven buying. The US Treasury bond yields also extend the previous week’s downtrend, weighing further on Greenback.
In light of a broad US Dollar weakness and negative US Treasury bond yields, the Gold price downside appears capped. Dovish Fed expectations will continue to underpin the non-interest-rate-bearing Gold price in the near term.
However, traders turn cautious and refrain from placing fresh bets on the bright metal in the lead-up to the ISM Services PMI data release while closely monitoring the developments on the Middle East geopolitical tensions. The headline ISM Services PMI is set to rise to 51.0 in July from June’s 48.8.
Meanwhile, US President Joe Biden will convene the National Security Council on Monday to discuss developments in the Middle East.
As observed on the daily chart, Gold price needs a daily candlestick close above the previous record highs of $2,450 to successfully resume the uptrend toward the lifetime highs of $2,484, reached on July 17.
Ahead of that, Friday’s high of $2,478 could be challenged, if buyers regain poise.
The 14-day Relative Strength Index (RSI) is holding steady while above the 50 level, currently near 60, suggesting that the bullish potential remains in place for Gold price.
Conversely, Gold sellers need to crack the 21-day Simple Moving Average (SMA) at $2,411 to carve a sustained downside. Additional declines could challenge the confluence support near $2,370, where rising trendline support meets with the 50-day SMA.
Gold has played a key role in human’s history as it has been widely used as a store of value and medium of exchange. Currently, apart from its shine and usage for jewelry, the precious metal is widely seen as a safe-haven asset, meaning that it is considered a good investment during turbulent times. Gold is also widely seen as a hedge against inflation and against depreciating currencies as it doesn’t rely on any specific issuer or government.
Central banks are the biggest Gold holders. In their aim to support their currencies in turbulent times, central banks tend to diversify their reserves and buy Gold to improve the perceived strength of the economy and the currency. High Gold reserves can be a source of trust for a country’s solvency. Central banks added 1,136 tonnes of Gold worth around $70 billion to their reserves in 2022, according to data from the World Gold Council. This is the highest yearly purchase since records began. Central banks from emerging economies such as China, India and Turkey are quickly increasing their Gold reserves.
Gold has an inverse correlation with the US Dollar and US Treasuries, which are both major reserve and safe-haven assets. When the Dollar depreciates, Gold tends to rise, enabling investors and central banks to diversify their assets in turbulent times. Gold is also inversely correlated with risk assets. A rally in the stock market tends to weaken Gold price, while sell-offs in riskier markets tend to favor the precious metal.
The price can move due to a wide range of factors. Geopolitical instability or fears of a deep recession can quickly make Gold price escalate due to its safe-haven status. As a yield-less asset, Gold tends to rise with lower interest rates, while higher cost of money usually weighs down on the yellow metal. Still, most moves depend on how the US Dollar (USD) behaves as the asset is priced in dollars (XAU/USD). A strong Dollar tends to keep the price of Gold controlled, whereas a weaker Dollar is likely to push Gold prices up.
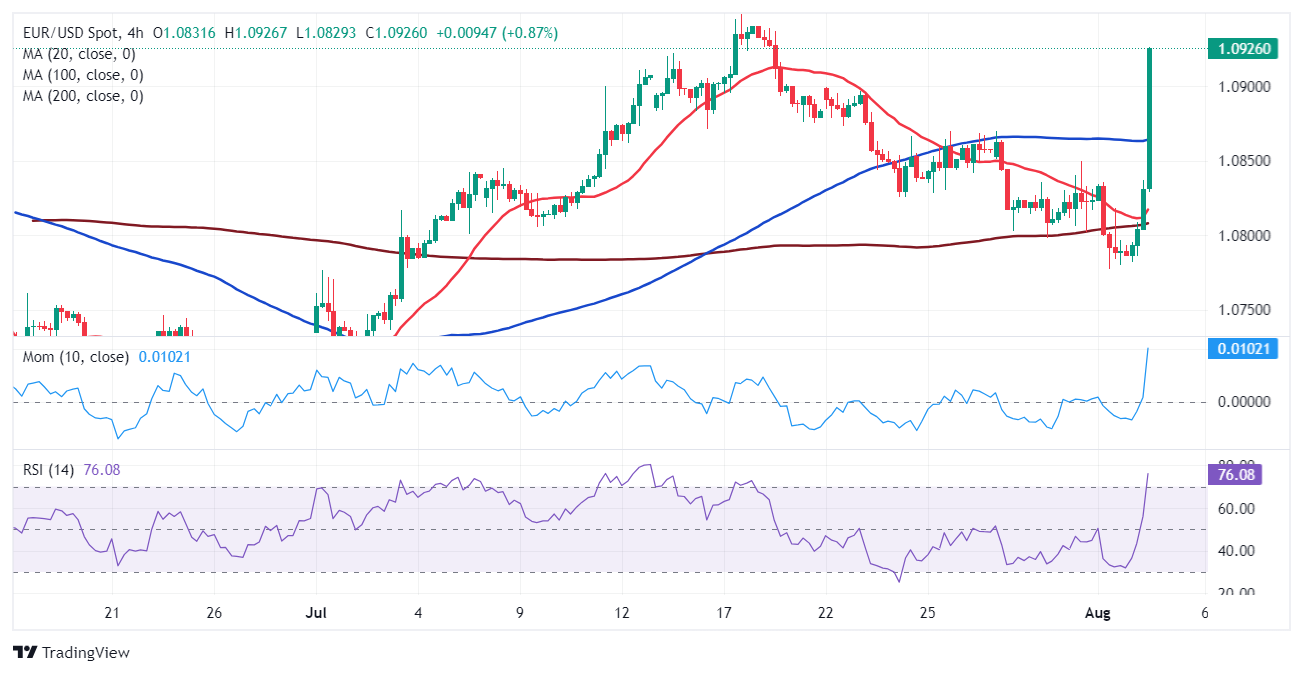
The EUR/USD pair fell to a fresh three-week low of 1.0776 on Thursday but managed to finish the week in the green above the 1.0900 threshold. Market players had loads to digest throughout the week, but in the end, mounting speculation that the Federal Reserve (Fed) will trim interest rates aggressively and tepid United States (US) data fueling recession fears weighed more.
The Euro had the chance to rally mid-week, but local data undermined its strength. Macroeconomic figures highlighted softer growth extended into the third quarter of the year, as the final Hamburg Commercial Bank (HCOB) Manufacturing PMI was confirmed at 45.8 in July, matching June’s reading. “The eurozone’s manufacturing sector suffered yet another setback at the start of the third quarter as a steeper reduction in new orders led contractions in output and employment to accelerate,” the official report reads.
Furthermore, Germany reported that the economy contracted in the second quarter of the year, as the Gross Domestic Product (GDP) fell 0.1% in the three months to June, according to preliminary estimates. The EU economy, however, expanded a modest 0.3% in the same period, slightly better than the 0.2% anticipated by market participants.
Finally, both economies reported the preliminary estimates of the July Harmonized Index of Consumer Prices (HICP). The German annual index was up by 2.6%, higher than the previous 2.5% and above the 2.4% anticipated. In Europe, the core annual HICP rose by 2.9%, also above the market’s expectations.
As widely anticipated, the Fed left the federal funds rate unchanged at 5.25%- 5.5% in its July policy meeting.
The Fed introduced some changes to its statement, which grabbed investors’ attention. On the one hand, policymakers acknowledged that job gains have moderated, while inflation is now seen as “somewhat elevated.” Additionally, the Fed noted that it is attentive to risks on both sides of its dual mandate, a change from the June statement, in which it said it was “highly attentive” to inflation risks. Finally, the Committee judged that the risks to achieving its employment and inflation goals continued to move into better balance.
The US Dollar came under selling pressure as Chairman Jerome Powell delivered a speech and said that a September rate cut is on the table, particularly if macroeconomic data keeps moving in the current direction. However, he clearly remarked that policymakers have made no future decision on monetary policy, and that they will remain data-dependant. As a result, financial markets moved into pricing in at least two rate cuts before year-end, while there are mounting expectations the Fed will deliver three cuts in 2024.
However, USD’s weakness was short-lived. The Greenback quickly trimmed losses and extended gains against major rivals as markets turned risk-averse. The reason behind the latter was a mixture of central banks’ announcements and tepid US data, fueling concerns about the health of the world’s largest economy.
On the one hand, the Bank of Japan (BoJ) and the Bank of England (BoE) announced their decisions on monetary policy. The first hiked interest rates by 15 basis points (bps), while the second trimmed its benchmark rate by 25 bps. Both decisions were widely anticipated, although only the BoJ is seen continuing its recent policy, putting local stocks in sell-off mode and spurring demand for the safe-haven USD. Meanwhile, tepid earnings reports also weighed on stock markets, fueling USD demand.
Stock markets tumbled after the US released the ISM Manufacturing PMI on Thursday. The index fell in July to 46.8 from 48.5 in the previous month, missing expectations of 48.8. The ISM report also showed a concerning uptick in Prices Paid, as the sub-index jumped to 52.9, higher than the 51.8 anticipated.
US employment-related data supported the case for rate cuts. The ADP report showed that the private sector added 122K new jobs in July, missing the 150K expected. Also, Initial Jobless Claims for the week ended July 26 unexpectedly rose to 249K, worse than anticipated. Additionally, US-based employers announced 25,885 job cuts in July, a 47% decrease from the 48,786 cuts announced one month prior, according to the Challenger Job Cuts report, while hiring fell to its lowest point in over a decade. Finally, Nonfarm Productivity rose 2.3% in the second quarter of the year, while Unit Labor Cost in the same period printed at 0.9%, much lower than the previous 3.8%.
Finally, the US released the July Nonfarm Payrolls (NFP) report on Friday. The report showed the country added 114,000 new jobs in July, missing the 175,000 expected. Furthermore, the Unemployment Rate rose to 4.3% from 4.1% in the previous month, while the Labor Force Participation Rate ticked up to 62.7% from 62.6%. Finally, Average Hourly Earnings declined to 3.6% from 3.8% in the same period, indicating easing inflationary pressures from that side. Also, Factory Orders fell 3.3% MoM in June, worse than anticipated.
By the end of the week, speculative interest believed the Fed could cut up to 50 bps at the September meeting, while the odds for three rate cuts before year-end continued to increase. Before the NFP release, the chances of a 50 bps cut in September stood at 30%, soaring to roughly 90% afterwards.
The upcoming week will bring some interesting economic indicators, but for the most, financial markets are expected to trade on sentiment, with the Fed’s future actions in the eye of the storm.
On Monday, the US will publish the July ISM Services PMI, foreseen at 51.0, improving from 48.8 in June. Other than that, HCOB and S&P Global will release the final estimates of the Services and Composite PMIs for most major economies.
Germany will report June Factory Orders and Industrial Production for the same month. By the end of the week, the country will publish the final calculation of July inflation figures. The Eurozone will offer June Retail Sales and August Sentix Investor Confidence.
The scheduled data has a limited potential to impact their respective currencies but would be a good barometer of economic health on both shores of the Atlantic.
From a technical point of view, the weekly chart for EUR/USD offers a neutral-to-bullish stance. The pair met buyers around a flat 20 Simple Moving Average (SMA), while the 100 SMA grinds higher below the shorter one. Technical indicators, in the meantime, tick higher within positive levels but lack clear directional strength. Finally, a mildly bearish 200 SMA stands at around 1.1080, a critical level to overcome to anticipate a sustained advance in the long term.
Technical readings in the daily chart support a bullish extension, particularly if the pair closes the week above the 1.0900 threshold. EUR/USD has accelerated above all its moving averages after meeting buyers around a mildly bearish 100 SMA and currently stands roughly 50 pips above a mildly bullish 20 SMA. At the same time, technical indicators head north almost vertically, with the Relative Strength Index (RSI) indicator currently standing at 59 but the Momentum indicator battling to overcome its 100 line.
July monthly high provides immediate resistance at 1.0947, with gains beyond this level aiming to test the 1.1000 psychological level. A break above the latter exposes the 1.1080 area. Near-term support can be found at 1.0880, with a more relevant one at 1.0800. A downward acceleration through the latter opens the door for a test of 1.0720.
Monetary policy in the US is shaped by the Federal Reserve (Fed). The Fed has two mandates: to achieve price stability and foster full employment. Its primary tool to achieve these goals is by adjusting interest rates. When prices are rising too quickly and inflation is above the Fed’s 2% target, it raises interest rates, increasing borrowing costs throughout the economy. This results in a stronger US Dollar (USD) as it makes the US a more attractive place for international investors to park their money. When inflation falls below 2% or the Unemployment Rate is too high, the Fed may lower interest rates to encourage borrowing, which weighs on the Greenback.
The Federal Reserve (Fed) holds eight policy meetings a year, where the Federal Open Market Committee (FOMC) assesses economic conditions and makes monetary policy decisions. The FOMC is attended by twelve Fed officials – the seven members of the Board of Governors, the president of the Federal Reserve Bank of New York, and four of the remaining eleven regional Reserve Bank presidents, who serve one-year terms on a rotating basis.
In extreme situations, the Federal Reserve may resort to a policy named Quantitative Easing (QE). QE is the process by which the Fed substantially increases the flow of credit in a stuck financial system. It is a non-standard policy measure used during crises or when inflation is extremely low. It was the Fed’s weapon of choice during the Great Financial Crisis in 2008. It involves the Fed printing more Dollars and using them to buy high grade bonds from financial institutions. QE usually weakens the US Dollar.
Quantitative tightening (QT) is the reverse process of QE, whereby the Federal Reserve stops buying bonds from financial institutions and does not reinvest the principal from the bonds it holds maturing, to purchase new bonds. It is usually positive for the value of the US Dollar.
A country’s Gross Domestic Product (GDP) measures the rate of growth of its economy over a given period of time, usually a quarter. The most reliable figures are those that compare GDP to the previous quarter e.g Q2 of 2023 vs Q1 of 2023, or to the same period in the previous year, e.g Q2 of 2023 vs Q2 of 2022. Annualized quarterly GDP figures extrapolate the growth rate of the quarter as if it were constant for the rest of the year. These can be misleading, however, if temporary shocks impact growth in one quarter but are unlikely to last all year – such as happened in the first quarter of 2020 at the outbreak of the covid pandemic, when growth plummeted.
A higher GDP result is generally positive for a nation’s currency as it reflects a growing economy, which is more likely to produce goods and services that can be exported, as well as attracting higher foreign investment. By the same token, when GDP falls it is usually negative for the currency. When an economy grows people tend to spend more, which leads to inflation. The country’s central bank then has to put up interest rates to combat the inflation with the side effect of attracting more capital inflows from global investors, thus helping the local currency appreciate.
When an economy grows and GDP is rising, people tend to spend more which leads to inflation. The country’s central bank then has to put up interest rates to combat the inflation. Higher interest rates are negative for Gold because they increase the opportunity-cost of holding Gold versus placing the money in a cash deposit account. Therefore, a higher GDP growth rate is usually a bearish factor for Gold price.
Spot activities were limited for copper cathode units heading into the Chinese and Southeast Asian markets in the week to Tuesday June 25, with many participants in Asia leaving for the London Metals Exchange’s LME Asia Week in Hong Kong on Thursday June 27.
Fastmarkets assessed the daily benchmark copper grade A cathode premium, cif Shanghai at $(20)-0 per tonne on Tuesday, flat on a weekly basis.
Fastmarkets assessed the weekly copper grade A cathode premium, cif Southeast Asia at $50-65 per tonne on Tuesday, unchanged from a week prior.
Overall trading sentiment stayed low, with participants gathering in Hong Kong for more direction in spot trading, Fastmarkets learned.
“All traders are being hit badly at current market price level, which is unprecedently at discounts, and demand in China stays weak,” a trader from Shanghai said in Hong Kong.
“The market is so bad, [and] people are looking for some ‘comfort’ by talking to peers, with no one making money under current conditions,” a second trader from Singapore said.
In the equivalent-grade (EQ) copper cathodes market, minimal spot activity was noted in both the Shanghai and Southeast Asian copper markets, Fastmarkets learned.
Fastmarkets assessed the weekly copper EQ cathode premium, cif Shanghai at $(60)-(50) per tonne on Tuesday, narrowing upwards from $(70)-(50) per tonne week on week.
Fastmarkets’ assessment of the weekly copper EQ cathode premium, cif Southeast Asia was at $(20)-(10) per tonne on the same day, unchanged from a week prior.
The European copper market was quiet, with sources noting poor demand and slow summer conditions.
“The cathode market is very quiet,” one producer source said, adding that demand was weak.
Fastmarkets’ fortnightly assessment of the copper grade A cathode premium delivered Germany was $190-210 per tonne, unchanged this session.
Participants noted that the market continued to be quiet, with high borrowing costs and approaching summer holidays.
Some sources noted that lower LME prices had added a little extra demand.
“It is quiet, but not as quiet as last month,” one trader source said, noting a slight increase in demand due to LME prices coming off.
Fastmarkets’ fortnightly assessment of the copper grade A cathode premium, cif Leghorn was $130-160 per tonne on Tuesday, unchanged from the previous session.
Fastmarkets’ fortnightly assessment of the copper grade A cathode premium, cif Rotterdam was $120-135 per tonne June 25, flat from the week before.
Import markets into Europe remained quiet and disrupted, with a large amount of liquidity heading to the US due to better premiums and also higher exchange prices, according to sources.
“The market is still a bit disrupted with material being shipped to the US,” a second trader said.
Sources noted there was little liquidity due to low demand and a wide spread between selling and buying interest levels.
The fortnightly copper EQ cathode premium, cif Europe was assessed at $90-100 per tonne, unchanged from the assessment prior.
Sources agreed that there is not much activity in the market, which appears to be stabilizing after May’s historic highs.
One seller said the market “has stabilized for now, which I don’t think we have seen since pre-COVID days.”
But “there are some early warning signs that the market is looking to soften, so some renewed volatility showing by or before mid-July would not be a huge surprise,” they added.
“There has not been much activity in the market,” another trader said.
All source assessments were within the previous week’s range, with market activity confirmed on the high end.
The copper grade 1 cathode premium, ddp Midwest US remained flat at 10-14 cents per lb on Tuesday, unchanged since June 11.
LME copper inventory has risen by 51% so far in June; now at 175,475 tonnes from 116,000 tonnes at the beginning of the month.
Despite a stronger dollar weighing on the commodities complex, the LME three-month copper contract edged higher on Wednesday.
Inform your base metals strategy with metals price forecasts and analysis for the global base metals industry. Get a free sample of our base metals price forecast today.
After all, the Japanese barely offer any interest in, even with the interest rate cut coming out of the Bank of England, the market will still see the overnight rate at 5%. So, you’re earning well over 4.5% to simply hang on to this pair, and traders will be paying close attention to that. And of course, the pair is oversold.

So, I think it’s probably due to bounce anyway. If we can recapture the 200 day EMA, I think a lot of traders will jump in based on FOMO and we’ll have to see how things work out from there. The other side of the equation of course is that we break down below the crucial 190 yen level. And I think at that point in time, you probably have a scenario where you end up just completely retracing the entire move, basically from Christmas of last year. The 190 yen level is also the 61.8% Fibonacci retracement level, so that comes into play as well, as a lot of traders will look at that as some type of guidepost.
Another factor that you need to pay close attention to is risk appetite. After all, the interest rate differential does favor more of a “risk on move”, as traders try to look for stable currency markets to pay swap at the end of each day. After all, even if you do get a little bit of a swap and at the same time the currency moves 300 pips against you, that doesn’t do much good. Stabilization will begin more buying before it is all said and done.
Ready to trade our Forex daily analysis and predictions? Here are the top UK forex trading platforms to choose from.
The metal declined steeply through the first two months of 2024, reaching a yearly low of US$859.15 on February 9. However, palladium saw momentum in March, trending upward alongside gold, silver and platinum.
At the start of April, the price of palladium was US$996.28, and it quickly accelerated to reach a year-to-date high of US$1,098 on April 9. However, the metal once again pulled back after hitting that level, plunging below the US$900 mark at the start of June. Palladium then surged to end the second quarter at US$963.50 on June 28.
The price has since regressed again, approaching a near yearly low of US$881 on July 29. Read on to learn what’s been driving palladium so far this year, and what factors may impact its performance moving forward.
Auto sector demand key for palladium price
Palladium and platinum are both used for investment, but have important industrial uses that claim the majority of demand. Auto sector demand has a strong impact on palladium in particular as it has few other uses.
According to a May report from the World Platinum Investment Council (WPIC), auto demand for palladium will remain steady in 2024 at 8.45 million ounces, while demand from all sources is projected to be 10.03 million ounces.
Chart via Trading Economics.
The WPIC is expecting palladium mine supply to remain relatively stable, with around 6.5 million ounces per year entering the market over the next five years. Meanwhile, the organization predicts that palladium recycling supply will increase from 2.64 million ounces in 2024 to 3.83 million ounces in 2028.
Overall, the WPIC is calling for palladium demand to outstrip supply in 2024 by 1.28 million ounces, and by 234,000 ounces in 2025 before entering surplus territory.
What factors drove palladium supply and demand in H1 2024?
The WPIC says the increase in recycled palladium supply is coming as a higher number of “PGM-rich vehicles” reach the end of their lives. These are expected to boost annual palladium recycling by over 1.3 million ounces by 2028.
Because platinum and palladium are interchangeable, manufacturers will often swap one out for the other as they try to find the best price. After breaking above US$3,000 in February 2022, palladium has been on a downward slide as auto manufacturers did exactly that, opting to use platinum, which was trading at around the US$1,000 per ounce level.
Though the two metals are now trading at near parity, there hasn’t been any desire to swap the two, even as platinum begins to edge higher. These dynamics are creating further headwinds in the palladium market.
In a mid-July platinum-group metals webinar hosted by CPM Group, Rohit Savant, CPM’s vice president of research, explained that given the costs associated with changing chemistries, the disparity between palladium and platinum prices will need to increase and be sustained before manufacturers consider a swap.
Savant went on to say that even though vehicle sales are expected to remain strong in 2024, gas-powered cars continue to lose market share to electric vehicles (EVs), which don’t require palladium.
This has been particularly impactful in the Chinese market, where there is higher EV demand.
“Even though you are seeing a substantial increase in vehicle sales, it may not necessarily translate into stronger demand for palladium,” Savant commented during the webinar. “That’s primarily because of the ongoing strength in the EV market share in China, and also the government incentivizing the Chinese market to either buy EVs or to buy smaller passenger vehicles, both of which are not supportive of palladium demand.”
What will happen to the palladium price in 2024?
Although some palladium demand comes from electronics production and investment, the auto industry is the metal’s primary driver. As increased recycling and higher supply begin to take hold, the price is not likely to increase; in addition, substitution isn’t likely to occur unless the price of platinum rises more substantially.
However, while near-term prospects don’t look strong, palladium’s low price may provide less risk-averse investors with opportunities, especially if the precious metal’s price continues to retreat.
Don’t forget to follow us @INN_Resource for real-time updates!
Securities Disclosure: I, Dean Belder, hold no direct investment interest in any company mentioned in this article.
From Your Site Articles
Related Articles Around the Web
These trades gave a total loss of 23.18%, averaging a loss of 4.64% per asset.
Last week’s key takeaways were:
It will be a relatively quiet week in terms of data, with the most important items this coming week expected to be:
Last month, I forecasted that the USD/JPY currency pair would increase in value. The performance of this forecast is as follows:

For the month of August, I forecast that the EUR/USD currency pair will rise in value.
Last week, I forecasted that the following Japanese Yen crosses would rise in value:
I was wrong, as all decreased in value.
This week, I forecast that the following currency crosses will rise in value:
Directional volatility in the Forex market rose again last week, with 67% of the most important currency pairs and crosses fluctuating by more than 1%.
Last week, the Japanese Yen was again the strongest major currency, and the Australian Dollar was again the weakest.
You can trade these forecasts in a real or demo Forex brokerage account.

The US Dollar Index printed a large bearish engulfing candlestick last week, which closed right near its low, at the lowest price seen in almost 5 months. The price is now below its levels of both 3 months ago and 6 months ago, indicating a new long-term bearish trend in the greenback. These are all bearish signs.
The technical slip matches the dovish change in fundamentals, with the Federal Reserve making clear that it will soon begin cutting interest rates, and with US treasury yields falling very quickly and sharply after the Fed’s meeting last week. There was also economic data released Friday which clearly indicated that the US economy is slowing significantly.
I am bearish on the US Dollar this week. However, it is worth noting that technically, the price is not very far from both a horizontal support level, and an ascending trend line marking the lower edge of the narrowing triangle chart pattern that has contained the US Dollar for about the past year.

The EUR/USD currency pair rose strongly last week to print a fairly large engulfing candlestick which closed near its high. This is the highest weekly close seen in this currency pair in almost 5 months. These are bullish signs, but bulls should not that according to the price chart below, the price action over the past several months has been rather consolidative.
The Euro tends to trend quite reliably, but often does so slowly, with deep retracements. Nevertheless, I see the current technical situation as justifying entering a new long trade, it just might well take a long time to pay off.
A long position here is supported by the bearish picture both technically and fundamentally in the US Dollar, it is more the Euro which needs to start moving.

I expected the USD/CHF currency pair to have potential resistance at $0.8875.
The H1 price chart below shows how the price action rejected this resistance level with a large bearish engulfing candlestick, marked by the down arrow within the price chart below, rejecting this resistance level during last Tuesday’s London session, signaling the timing of this bearish rejection.
This trade could still be open, but it has been extremely profitable so far, giving a maximum reward-to-risk ratio of approximately 14 to 1.
Along with the Japanese Yen, the Swiss Franc is a very strong currency, gaining firmly in value over the past week.

The AUD/JPY currency cross fell extremely strongly last week for the second consecutive week to close lower by more than 4%. In fact, the week’s decline was greater than 5%. This is an unusually large price movement that has not been seen for years. It was a very bearish weekly candle, with the price closing right on its low.
Although the Australian Dollar traded significantly lower last week on declining risk appetite, the Japanese Yen remains the real story. It enjoyed yet another week of dramatic strengthening but by even more than the previous week’s strong advance. This was driven by the Bank of Japan’s divergent rate hike, and tighter monetary policy of halving its bond purchase program.
The Yen and Aussie are the two biggest movers in the Forex market, putting this currency cross in focus.
Technically, the drop shown in the price chart is fascinating – the move looks like a knife cutting through hot butter, as it overcomes months of grinding, advancing price action. This is a sign of fundamental change.
Although we can say that there is strong bearish momentum, I expect that with the price so oversold and trading near a cluster of key support levels, and with so many currency crosses having outsized movements last week, the price of this currency cross will advance over the coming week, at least by a little.
Therefore, I expect this currency pair’s price to rise over the coming week, along with several other Yen crosses.

Gold rose last week to print a normally sized bullish candlestick which made the highest ever weekly close. However, it must be noted that the candlestick has a large upper wick which has rejected two key resistance levels, and the price action last week did not make a new record high.
I do not think Gold is looking bullish enough to justify a new long trade entry, but it is threatening to make a technically significant bullish breakout, so it is worth watching.
The US Dollar is looking bearish, which may help the price of Gold to advance.
Bulls will be looking for a daily close above $2,466 or, even better, the big quarter-number at $2,500.

The S&P 500 Index fell again last week, after the previous two weeks when the major stock market index posted its biggest loss in months.
The move down was reasonably strong, but nothing out of the ordinary. Most trend traders won’t be in a long trade here any longer despite the recent strong bullish run, as the price has retraced by more than three times the long-term daily average true range.
Technology stock indices like the NASDAQ 100 have performed even more bearishly over the past week, suggesting that the stock market has made a rotational shift. Broader market investments now look likely to outperform leading technology stocks.
Despite the recent bearishness, it cannot yet be said that the bull market is over here. The price area that stands out as most likely to be pivotal is the big quarter-number at 5,250. If we see a strong daily or weekly close below that level, we will likely be in for an even deeper retracement, and maybe also a technical end to the bull market that comes when the price is more than 20% off its peak.

US Treasury Yields fell very dramatically and strongly last week. The weekly drop was the largest seen in over one year. Treasury yields had already been falling in recent days, but the Fed meeting which resulted in a dovish tilt really sent the yields tumbling. It is notable that both the 2-year and the 10-year yields tumbled and ended up well below 4%, suggesting a major shift in the market’s expectation towards a deeper path of rate cuts going forward.
It may be a bit too late to enter a new short trade here, however. Nevertheless, traders should remember that US Treasury Yields have an excellent record of trending reliably, the problem is whether you have access to futures and the differential of that price which can make it difficult to find a way to profit.

US Treasury Yields fell very dramatically and strongly last week. The weekly drop was the largest seen in years. Treasury yields had already been falling in recent days, but the Fed meeting which resulted in a dovish tilt really sent the yields tumbling. It is notable that both the 2-year and the 10-year yields tumbled and ended up well below 4%, suggesting a major shift in the market’s expectation towards a deeper path of rate cuts going forward.
It may be a bit too late to enter a new short trade here, however. Nevertheless, traders should remember that US Treasury Yields have an excellent record of trending reliably, the problem is whether you have access to futures and the differential of that price which can make it difficult to find a way to profit.

I see the best trading opportunities this week as long of the following currency crosses.
I also think a long trade in the EUR/USD currency pair could work out well.
Ready to trade our weekly Forex analysis? We’ve made a list of the top Forex brokers worth checking out.
Silver price (XAG/USD) posts a fresh weekly high at $29.20 in Friday’s North American trading hours. The white metal gains as US yields sink after the United States (US) Nonfarm Payrolls (NFP) report for July showed signs of cooling labor market conditions.
10-year US Treasury yields witness a bloodbath and dives to multi-month low near 3.82%. The US Dollar Index (DXY), which tracks the Greenback’s value against six major currencies, plunges below 103.30. Lower yields on interest-bearing assets bode strongly for the Gold price as they reduce the opportunity cost of investment in non-yielding assets.
The report showed that labor demand has softened as number of individuals hired by employers in July came in lower at 114K than estimates of 175K and June’s reading of 179K. The Unemployment Rate jumps to 4.3%, the highest since November 2021, from expectations and the prior release of 4.1%. The report clearly indicates that the labor market struggles to bear the consequences of higher interest rates by the Federal Reserve (Fed).
Meanwhile, Average Hourly Earnings have also grown at a slower pace, pointing to a slowdown in consumer spending that eventually cools down inflationary pressures. Annually, the wage growth measure decelerated at a faster-than-expected pace to 3.6%. While the labor market has cooled down, it will add to reasons prompting expectations of sooner rate cuts by the Fed. The Fed is widely anticipated to start reducing interest rates from the September meeting.
Silver price breaks above the horizontal resistance plotted from June 13 low at $28.66 on a four-hour timeframe, which has become a support now. The asset climbs above the 50-period Exponential Moving Average (EMA) near $28.70, suggesting that the near-term trend is upbeat.
The 14-period Relative Strength Index (RSI) moves higher to near 60.00. If the RSI breaks above 60.00, the momentum will shift to the upside.
Silver is a precious metal highly traded among investors. It has been historically used as a store of value and a medium of exchange. Although less popular than Gold, traders may turn to Silver to diversify their investment portfolio, for its intrinsic value or as a potential hedge during high-inflation periods. Investors can buy physical Silver, in coins or in bars, or trade it through vehicles such as Exchange Traded Funds, which track its price on international markets.
Silver prices can move due to a wide range of factors. Geopolitical instability or fears of a deep recession can make Silver price escalate due to its safe-haven status, although to a lesser extent than Gold’s. As a yieldless asset, Silver tends to rise with lower interest rates. Its moves also depend on how the US Dollar (USD) behaves as the asset is priced in dollars (XAG/USD). A strong Dollar tends to keep the price of Silver at bay, whereas a weaker Dollar is likely to propel prices up. Other factors such as investment demand, mining supply – Silver is much more abundant than Gold – and recycling rates can also affect prices.
Silver is widely used in industry, particularly in sectors such as electronics or solar energy, as it has one of the highest electric conductivity of all metals – more than Copper and Gold. A surge in demand can increase prices, while a decline tends to lower them. Dynamics in the US, Chinese and Indian economies can also contribute to price swings: for the US and particularly China, their big industrial sectors use Silver in various processes; in India, consumers’ demand for the precious metal for jewellery also plays a key role in setting prices.
Silver prices tend to follow Gold’s moves. When Gold prices rise, Silver typically follows suit, as their status as safe-haven assets is similar. The Gold/Silver ratio, which shows the number of ounces of Silver needed to equal the value of one ounce of Gold, may help to determine the relative valuation between both metals. Some investors may consider a high ratio as an indicator that Silver is undervalued, or Gold is overvalued. On the contrary, a low ratio might suggest that Gold is undervalued relative to Silver.
The euro pound (EUR/GBP) exchange rate is continuing on its upward trajectory this morning following the Bank of England’s (BoE) latest interest rate decision yesterday afternoon.
At the time of writing, the EUR/GBP exchange rate is trading at around €0.8496, up roughly 0.2% from this morning’s opening rate.
The pound (GBP) has remained on the back foot against the majority of its peers this morning following the BoE’s decision to cut interest rates yesterday afternoon.
The central bank voted to loosen monetary policy from its 16-year high of 5.25%, with five of the nine monetary policy members voting for a 25-basis point cut.
BoE Governor Andrew Bailey, who was one of the five MPC members who voted for the cut, commented:
‘Inflationary pressures have eased enough that we’ve been able to cut interest rates today, but we need to make sure inflation stays low, and be careful not to cut interest rates too quickly or by too much.’
Following the release, Sterling experienced a sharp selloff, with the currency reaching some of its lowest levels this morning.
Also applying pressure onto GBP exchange rates is this morning’s risk-off mood. As an increasingly risk-sensitive currency, the pound is further stymied by the downbeat market mood.
The euro (EUR) is trading in a narrow range against the majority of its peers this morning amid an absence of macroeconomic data releases from within the Eurozone, leaving the common currency largely directionless.
However, the euro has managed to recoup some of its losses from yesterday, following a duo of disappointing data releases.
The Eurozone’s finalised manufacturing index for July printed at 45.8, remaining in the contraction zone (a reading below 50), while the bloc’s latest unemployment rate unexpectedly rose from its historic lows of 6.4%.
Looking ahead, the primary catalyst of movement for the EUR/GBP exchange rate for the remainder of the day will likely be a speech from BoE official Huw Pill.
As Pill was one of the four policymakers who voted to hold interest rates at 5.25%, could any hawkish comments from the rate-setter see the pound claw back some of its losses?
Turning to the euro, a continued absence of market moving data will likely see EUR exchange rates remain trading without a clear trajectory.
However, as a safe-haven currency, should markets remain cautious, the euro could close the week firming against its peers.
You have reached your limit of 5 free articles for this month.
Access all our articles, insights, and analysts.
Your coupon code
Gold price struggles to regain the $2,400 mark on Tuesday, hovering just below the threshold with a modest intraday positive tone. XAU/USD trades rangebound as speculative interest assesses news from the United States (US) ahead of the Federal Reserve (Fed) monetary policy decision on Wednesday.
Meanwhile, the US Bureau of Labor Statistics (BLS) released the June Job Openings and Labor Turnover Survey (JOLTS) report, which showed that openings on the last business day of the month stood at 8.184 million, below the upwardly revised 8.23 million posted in May. Additionally, the Conference Board (CB) revealed that the Consumer Confidence Index rose in July to 100.3 from a downwardly revised 97.8 in June.
Anyway, the focus remains on upcoming central banks’ decisions. Ahead of the Asian opening, market talks suggest the Bank of Japan (BoJ) could discuss raising rates to 0.25%. Expectations also point to a reduction in government bond purchases. The one thing clear is that the BoJ can no longer remain on hold.
Later on Wednesday, the Fed will take the stage. The US central bank is widely anticipated to keep interest rates unchanged, although market participants hope policymakers will provide clues on a September rate cut. Ever since Chairman Jerome Powell adopted a more dovish speech, hopes for two interest rate cuts before year-end have skyrocketed.
From a technical point of view, the bearish potential for XAU/USD seems limited. In the daily chart, the pair is trading just below a still bullish 20 Simple Moving Average (SMA) while the longer moving averages maintain their upward slopes far below the current level. Technical indicators, in the meantime, remain directionless just above their midlines, as the bright metal remains confined to a tight range for a second consecutive day.
In the near term, and according to the 4-hour chart, XAU/USD is neutral-to-bullish. The pair is trading just above the 50% Fibonacci retracement of the June/July rally at $2,388.25 while still contained between directionless moving averages. However, technical indicators have picked up modestly within positive levels, skewing the risk to the upside.
Support levels: 2,388.25 2,366.30 2,353.00
Resistance levels: 2,403.10 2,418.15 2,431.30
Gold price struggles to regain the $2,400 mark on Tuesday, hovering just below the threshold with a modest intraday positive tone. XAU/USD trades rangebound as speculative interest assesses news from the United States (US) ahead of the Federal Reserve (Fed) monetary policy decision on Wednesday.
Meanwhile, the US Bureau of Labor Statistics (BLS) released the June Job Openings and Labor Turnover Survey (JOLTS) report, which showed that openings on the last business day of the month stood at 8.184 million, below the upwardly revised 8.23 million posted in May. Additionally, the Conference Board (CB) revealed that the Consumer Confidence Index rose in July to 100.3 from a downwardly revised 97.8 in June.
Anyway, the focus remains on upcoming central banks’ decisions. Ahead of the Asian opening, market talks suggest the Bank of Japan (BoJ) could discuss raising rates to 0.25%. Expectations also point to a reduction in government bond purchases. The one thing clear is that the BoJ can no longer remain on hold.
Later on Wednesday, the Fed will take the stage. The US central bank is widely anticipated to keep interest rates unchanged, although market participants hope policymakers will provide clues on a September rate cut. Ever since Chairman Jerome Powell adopted a more dovish speech, hopes for two interest rate cuts before year-end have skyrocketed.
From a technical point of view, the bearish potential for XAU/USD seems limited. In the daily chart, the pair is trading just below a still bullish 20 Simple Moving Average (SMA) while the longer moving averages maintain their upward slopes far below the current level. Technical indicators, in the meantime, remain directionless just above their midlines, as the bright metal remains confined to a tight range for a second consecutive day.
In the near term, and according to the 4-hour chart, XAU/USD is neutral-to-bullish. The pair is trading just above the 50% Fibonacci retracement of the June/July rally at $2,388.25 while still contained between directionless moving averages. However, technical indicators have picked up modestly within positive levels, skewing the risk to the upside.
Support levels: 2,388.25 2,366.30 2,353.00
Resistance levels: 2,403.10 2,418.15 2,431.30
The Australian dollar has gone back and forth during the last couple of days and as we currently stand, it looks like the 0.6550 level remains a bit of a magnet for price. Quite frankly, the market is taking a break after a severe beating over the last couple of trading sessions, going back really about two and a half weeks where we plunged from the 0.6790 region. At this point, we have to question whether or not the market is able to continue this type of downward pressure, or will we get a relief rally?
As things stand right now, it looks like we’re just content to go sideways. We could be forming a little bit of a basing pattern, but we would need to see the 0.6575 level taken to the upside to even start to think about that. Furthermore, we have a Federal Reserve meeting on Wednesday, which will probably be the catalyst, regardless of which direction we go.
Once we get a read on the Federal Reserve monetary policy, that will affect the dollar, and of course the Australian dollar will react in kind against that greenback. So, we’ll just have to wait and see. I suspect we probably have another 24 hours or so of this sideways action. After that, I would hope that things become much clearer. This is a market that also has a lot of input from risk appetite, so make sure you understand that as well.
For a look at all of today’s economic events, check out our economic calendar.
This article was originally posted on FX Empire