The main category of Forex News.
You can use the search box below to find what you need.
[wd_asp id=1]
The main category of Forex News.
You can use the search box below to find what you need.
[wd_asp id=1]
Important DisclaimersThe content provided on the website includes general news and publications, our personal analysis and opinions, and contents provided by third parties, which are intended for educational and research purposes only. It does not constitute, and should not be read as, any recommendation or advice to take any action whatsoever, including to make any investment or buy any product. When making any financial decision, you should perform your own due diligence checks, apply your own discretion and consult your competent advisors. The content of the website is not personally directed to you, and we does not take into account your financial situation or needs.The information contained in this website is not necessarily provided in real-time nor is it necessarily accurate. Prices provided herein may be provided by market makers and not by exchanges.Any trading or other financial decision you make shall be at your full responsibility, and you must not rely on any information provided through the website. FX Empire does not provide any warranty regarding any of the information contained in the website, and shall bear no responsibility for any trading losses you might incur as a result of using any information contained in the website.The website may include advertisements and other promotional contents, and FX Empire may receive compensation from third parties in connection with the content. FX Empire does not endorse any third party or recommends using any third party’s services, and does not assume responsibility for your use of any such third party’s website or services.FX Empire and its employees, officers, subsidiaries and associates, are not liable nor shall they be held liable for any loss or damage resulting from your use of the website or reliance on the information provided on this website.Risk DisclaimersThis website includes information about cryptocurrencies, contracts for difference (CFDs) and other financial instruments, and about brokers, exchanges and other entities trading in such instruments. Both cryptocurrencies and CFDs are complex instruments and come with a high risk of losing money. You should carefully consider whether you understand how these instruments work and whether you can afford to take the high risk of losing your money.FX Empire encourages you to perform your own research before making any investment decision, and to avoid investing in any financial instrument which you do not fully understand how it works and what are the risks involved.
You have reached your limit of 5 free articles for this month.
Access all our articles, insights, and analysts.
Your coupon code
GBP/USD lost its traction after coming in within a touching distance of 1.3000 on Monday and closed the day modestly lower. The pair holds steady slightly above 1.2950 in the European session on Tuesday.
The table below shows the percentage change of British Pound (GBP) against listed major currencies last 7 days. British Pound was the strongest against the New Zealand Dollar.
| USD | EUR | GBP | JPY | CAD | AUD | NZD | CHF | |
|---|---|---|---|---|---|---|---|---|
| USD | -0.66% | -1.20% | -1.47% | 0.35% | -0.10% | 1.08% | -0.20% | |
| EUR | 0.66% | -0.56% | -0.83% | 1.00% | 0.56% | 1.76% | 0.47% | |
| GBP | 1.20% | 0.56% | -0.29% | 1.57% | 1.14% | 2.33% | 1.02% | |
| JPY | 1.47% | 0.83% | 0.29% | 1.84% | 1.38% | 2.58% | 1.28% | |
| CAD | -0.35% | -1.00% | -1.57% | -1.84% | -0.46% | 0.75% | -0.55% | |
| AUD | 0.10% | -0.56% | -1.14% | -1.38% | 0.46% | 1.17% | -0.13% | |
| NZD | -1.08% | -1.76% | -2.33% | -2.58% | -0.75% | -1.17% | -1.27% | |
| CHF | 0.20% | -0.47% | -1.02% | -1.28% | 0.55% | 0.13% | 1.27% |
The heat map shows percentage changes of major currencies against each other. The base currency is picked from the left column, while the quote currency is picked from the top row. For example, if you pick the British Pound from the left column and move along the horizontal line to the US Dollar, the percentage change displayed in the box will represent GBP (base)/USD (quote).
The cautious market mood helped the US Dollar (USD) find a foothold at the beginning of the week, causing GBP/USD to correct lower from the highest level it touched in nearly a year.
During the American trading hours, Federal Reserve (Fed) Chairman Jerome Powell said that inflation readings in the second quarter represented further progress but repeated that he is not going to send any signals on any particular meeting. With markets already fully pricing in a Fed rate cut in September, according to the CME FedWatch Tool, these comments had little to no impact on the USD’s performance against its rivals.
The US Census Bureau will release Retail Sales data for June later in the day. Markets expect a no change following the marginal 0.1% increase recorded in May. Although a positive surprise could support the USD, investors are unlikely to take large positions, or change their minds about the Fed rate outlook, based on this data alone. Hence, the market reaction could remain short-lived.
On Wednesday, the UK’s Office for National Statistics will publish Consumer Price Index (CPI) figures for June, which could influence the market expectations regarding the timing of the Bank of England’s (BoE) rate reduction. Ahead of this data, GBP/USD’s action could remain subdued.
GBP/USD was last seen trading slightly above 1.2950 (20-period Simple Moving Average (SMA), static level). If the pair falls below that level and fails to reclaim it, 1.2900 (psychological level, static level) could be seen as next support before 1.2850 (mid-point of the ascending regression channel coming from late April).
On the upside, 1.3000 (upper limit of the ascending channel, psychological level) aligns as strong resistance ahead of 1.3040 (static level from July 2023) and 1.3100 (psychological level, static level).
The United Kingdom (UK) Consumer Price Index (CPI), released by the Office for National Statistics on a monthly basis, is a measure of consumer price inflation – the rate at which the prices of goods and services bought by households rise or fall – produced to international standards. It is the inflation measure used in the government’s target. The YoY reading compares prices in the reference month to a year earlier. Generally, a high reading is seen as bullish for the Pound Sterling (GBP), while a low reading is seen as bearish.
Read more.
GBP/USD lost its traction after coming in within a touching distance of 1.3000 on Monday and closed the day modestly lower. The pair holds steady slightly above 1.2950 in the European session on Tuesday.
The table below shows the percentage change of British Pound (GBP) against listed major currencies last 7 days. British Pound was the strongest against the New Zealand Dollar.
| USD | EUR | GBP | JPY | CAD | AUD | NZD | CHF | |
|---|---|---|---|---|---|---|---|---|
| USD | -0.66% | -1.20% | -1.47% | 0.35% | -0.10% | 1.08% | -0.20% | |
| EUR | 0.66% | -0.56% | -0.83% | 1.00% | 0.56% | 1.76% | 0.47% | |
| GBP | 1.20% | 0.56% | -0.29% | 1.57% | 1.14% | 2.33% | 1.02% | |
| JPY | 1.47% | 0.83% | 0.29% | 1.84% | 1.38% | 2.58% | 1.28% | |
| CAD | -0.35% | -1.00% | -1.57% | -1.84% | -0.46% | 0.75% | -0.55% | |
| AUD | 0.10% | -0.56% | -1.14% | -1.38% | 0.46% | 1.17% | -0.13% | |
| NZD | -1.08% | -1.76% | -2.33% | -2.58% | -0.75% | -1.17% | -1.27% | |
| CHF | 0.20% | -0.47% | -1.02% | -1.28% | 0.55% | 0.13% | 1.27% |
The heat map shows percentage changes of major currencies against each other. The base currency is picked from the left column, while the quote currency is picked from the top row. For example, if you pick the British Pound from the left column and move along the horizontal line to the US Dollar, the percentage change displayed in the box will represent GBP (base)/USD (quote).
The cautious market mood helped the US Dollar (USD) find a foothold at the beginning of the week, causing GBP/USD to correct lower from the highest level it touched in nearly a year.
During the American trading hours, Federal Reserve (Fed) Chairman Jerome Powell said that inflation readings in the second quarter represented further progress but repeated that he is not going to send any signals on any particular meeting. With markets already fully pricing in a Fed rate cut in September, according to the CME FedWatch Tool, these comments had little to no impact on the USD’s performance against its rivals.
The US Census Bureau will release Retail Sales data for June later in the day. Markets expect a no change following the marginal 0.1% increase recorded in May. Although a positive surprise could support the USD, investors are unlikely to take large positions, or change their minds about the Fed rate outlook, based on this data alone. Hence, the market reaction could remain short-lived.
On Wednesday, the UK’s Office for National Statistics will publish Consumer Price Index (CPI) figures for June, which could influence the market expectations regarding the timing of the Bank of England’s (BoE) rate reduction. Ahead of this data, GBP/USD’s action could remain subdued.
GBP/USD was last seen trading slightly above 1.2950 (20-period Simple Moving Average (SMA), static level). If the pair falls below that level and fails to reclaim it, 1.2900 (psychological level, static level) could be seen as next support before 1.2850 (mid-point of the ascending regression channel coming from late April).
On the upside, 1.3000 (upper limit of the ascending channel, psychological level) aligns as strong resistance ahead of 1.3040 (static level from July 2023) and 1.3100 (psychological level, static level).
The United Kingdom (UK) Consumer Price Index (CPI), released by the Office for National Statistics on a monthly basis, is a measure of consumer price inflation – the rate at which the prices of goods and services bought by households rise or fall – produced to international standards. It is the inflation measure used in the government’s target. The YoY reading compares prices in the reference month to a year earlier. Generally, a high reading is seen as bullish for the Pound Sterling (GBP), while a low reading is seen as bearish.
Read more.
That being said, this is a market that I am very cautious with, and I generally tell retail traders that they have to be very cautious about trading. Unfortunately, I get emails throughout the year from retail traders that have gone into the natural gas markets with a massive amount of leverage, and now desperately hoping for some type of miracle to turn the market around. Quite frankly, the natural gas markets move on fundamentals more than most other assets, as you have a situation where traders will begin to worry about hurricanes in the Gulf of Mexico, weather patterns in the northeastern part of the United States, and of course the amount of transmission that is currently going through the US natural gas pipelines.

One thing that a lot of traders forget is that most natural gas CFD markets are based on the Henry Hub Contract, which is a measurement of price in Henry, Louisiana. In other words, it’s a very US centric market and a lot of people will naturally try to equate what’s going on in Europe with what’s going on in Louisiana, which of course is nonsense.
It can be influential when euro is hurting for supply, mainly due to the fact that the US will then export natural gas to the European Union, but that is somewhat limited in the sense that most US natural gas is already spoken for as far as exports are concerned, and that generally means Asia. In other words, you need to be cognizant and up to the task when it comes to US demand more than anything else.
That being said, we are in an area that could very well provide a bit of an uplift, as the 61.8% Fibonacci retracement level is here, and of course the $2.25 level will attract a lot of attention. That being said, we also have the 50-Day EMA breaking below the 200-Day EMA, kicking off the “so-called death cross.” Unfortunately for this indicator, it’s typically late, so I only read so much into it. If you are a longer-term trader, this is a potential investment, but the key word here of course is going to be investment.
Ready to trade Forex daily analysis and predictions? Here are the best commodity trading platforms to choose from.
Recommended by Richard Snow
Get Your Free JPY Forecast
Jerome Powell continued to hint at improving conditions, laying the groundwork for the Fed’s first rate cut since the hiking cycle began in 2022. The Fed chairman repeated that the Fed will not wait until inflation is at the all important 2% market before lowering rates as monetary policy operates with a variable lag.
Powell added that the committee is looking for more of the same when it comes to economic data as parts of the labour market show signs of easing, growth has moderated and inflation continues to edge lower.
Nevertheless, the US dollar refused to weaken despite the recent sharp selloff in response to last week’s lower US inflation figures. US yields, however, lead the rest of the pack lower this morning with Japanese government bond yields following suit. The 10-year yield now trades near a three week low and approaches the former cap of 1%. Later this month the Bank of Japan (BoJ) will meet to potentially hike rates and have promised to reveal more details to their bond tapering plans.
Japanese Government Bond Yields (10-Year)
USD/JPY has been the subject of much debate after official BoJ data suggests 3.57 trillion yen may have been deployed to strengthen the yen. Officials declined to comment on whether it was a targeted FX intervention exercise and continued to stress that recent yen weakness is undesirable.
The pair appears to have found momentary support at the blue 50-day simple moving average, where a bullish continuation highlights the 160.00 mark once again. If further signs of a Fed cut materialize, the pair could consolidate and favour sideways trading but this appears as a less likely outcome given the interest rate differential continues to disadvantage the yen. In any case, 155.00 remains the next level of support.
USD/JPY Daily Chart
Recommended by Richard Snow
How to Trade USD/JPY
— Written by Richard Snow for DailyFX.com
Contact and follow Richard on Twitter: @RichardSnowFX
DailyFX provides forex news and technical analysis on the trends that influence the global currency markets.
Gold price is looking to extend previous gains early Tuesday, having clinched a new two-month high at $2,440 a day ago. Growing expectations that a US Federal Reserve (Fed) interest-rate cut in September is a done deal continue to underpin the non-interest-bearing Gold price.
Fed Chairman Jerome Powell’s comments affirmed bets for a rate reduction in September after he said Monday that the central bank will not wait until inflation hits 2% to lower interest rates. The Fed is looking for “greater confidence” that inflation will return to the 2% level, Powell added.
Those remarks by the Fed Chief fuelled a fresh leg down in the US Dollar (USD) alongside the US Treasury bond yields, driving Gold price back toward an all-time high of $2,450.
Earlier in the day, Gold price witnessed some corrective moves, as the Greenback took advantage of risk-aversion induced by the weekend’s assassination attempt on ex-US President Donald Trump during his Pennsylvania rally. Investors digested the fateful Trump attack and ramped up the odds of his win in the US Presidential race.
Further, investors flocked to safety in the USD following China’s second-quarter GDP miss in Asian hours on Monday. Data released by the National Bureau of Statistics (NBS) showed Monday that the world’s second-largest economy grew 4.7% year-on-year in April-June, slowing from 5.3% in the previous three months while recording the weakest growth since the third quarter of 2023.
In Tuesday’s trading so far, Gold price is gathering strength for the next push higher even as the US Dollar stages a modest comeback. The rebound in the USD/JPY pair could be attributed to the USD uptick. However, weak US Treasury bond yields continue to support the non-yielding Gold price.
The bright metal also cheers the dovish comments from San Francisco Fed President Mary Daly. In her speech overnight, Daly said that she has confidence that inflation is heading lower.
Later in the day, the US Retail Sales report and Fedspeak will grab the eyeballs, as traders look to seal in a September Fed rate cut. Weaker-than-expected US Retail Sales data could reinforce the USD selling, lifting the Gold price northward.
Meanwhile, speculations that China could roll out stimulus measures to boost economic performance could also render Gold positive in the near term.
Gold price keeps sight on the all-time high at $2,450, as the 14-day Relative Strength Index (RSI) looks north near 65, at the press time.
The Bull Cross, represented by the 21-day Simple Moving Average (SMA) settling above the 50-day SMA on Friday, adds credence to the bullish potential.
Gold buyers, however, need to yield a daily closing above the previous two-month high of $2,425 to challenge the record highs of $2,450.
Ahead of that, the new two-month high of $2,440 could challenge the bearish commitments.
Alternatively, any pullback in Gold price could warrant a test of the $2,400 round level, below which Friday’s low of $2,391 could be tested.
The next relevant support levels are seen at the July 11 low of $2,371 and the $2,350 psychological levels.
Gold has played a key role in human’s history as it has been widely used as a store of value and medium of exchange. Currently, apart from its shine and usage for jewelry, the precious metal is widely seen as a safe-haven asset, meaning that it is considered a good investment during turbulent times. Gold is also widely seen as a hedge against inflation and against depreciating currencies as it doesn’t rely on any specific issuer or government.
Central banks are the biggest Gold holders. In their aim to support their currencies in turbulent times, central banks tend to diversify their reserves and buy Gold to improve the perceived strength of the economy and the currency. High Gold reserves can be a source of trust for a country’s solvency. Central banks added 1,136 tonnes of Gold worth around $70 billion to their reserves in 2022, according to data from the World Gold Council. This is the highest yearly purchase since records began. Central banks from emerging economies such as China, India and Turkey are quickly increasing their Gold reserves.
Gold has an inverse correlation with the US Dollar and US Treasuries, which are both major reserve and safe-haven assets. When the Dollar depreciates, Gold tends to rise, enabling investors and central banks to diversify their assets in turbulent times. Gold is also inversely correlated with risk assets. A rally in the stock market tends to weaken Gold price, while sell-offs in riskier markets tend to favor the precious metal.
The price can move due to a wide range of factors. Geopolitical instability or fears of a deep recession can quickly make Gold price escalate due to its safe-haven status. As a yield-less asset, Gold tends to rise with lower interest rates, while higher cost of money usually weighs down on the yellow metal. Still, most moves depend on how the US Dollar (USD) behaves as the asset is priced in dollars (XAU/USD). A strong Dollar tends to keep the price of Gold controlled, whereas a weaker Dollar is likely to push Gold prices up.
Conversely, a break below $104.238 could initiate a significant selling trend.
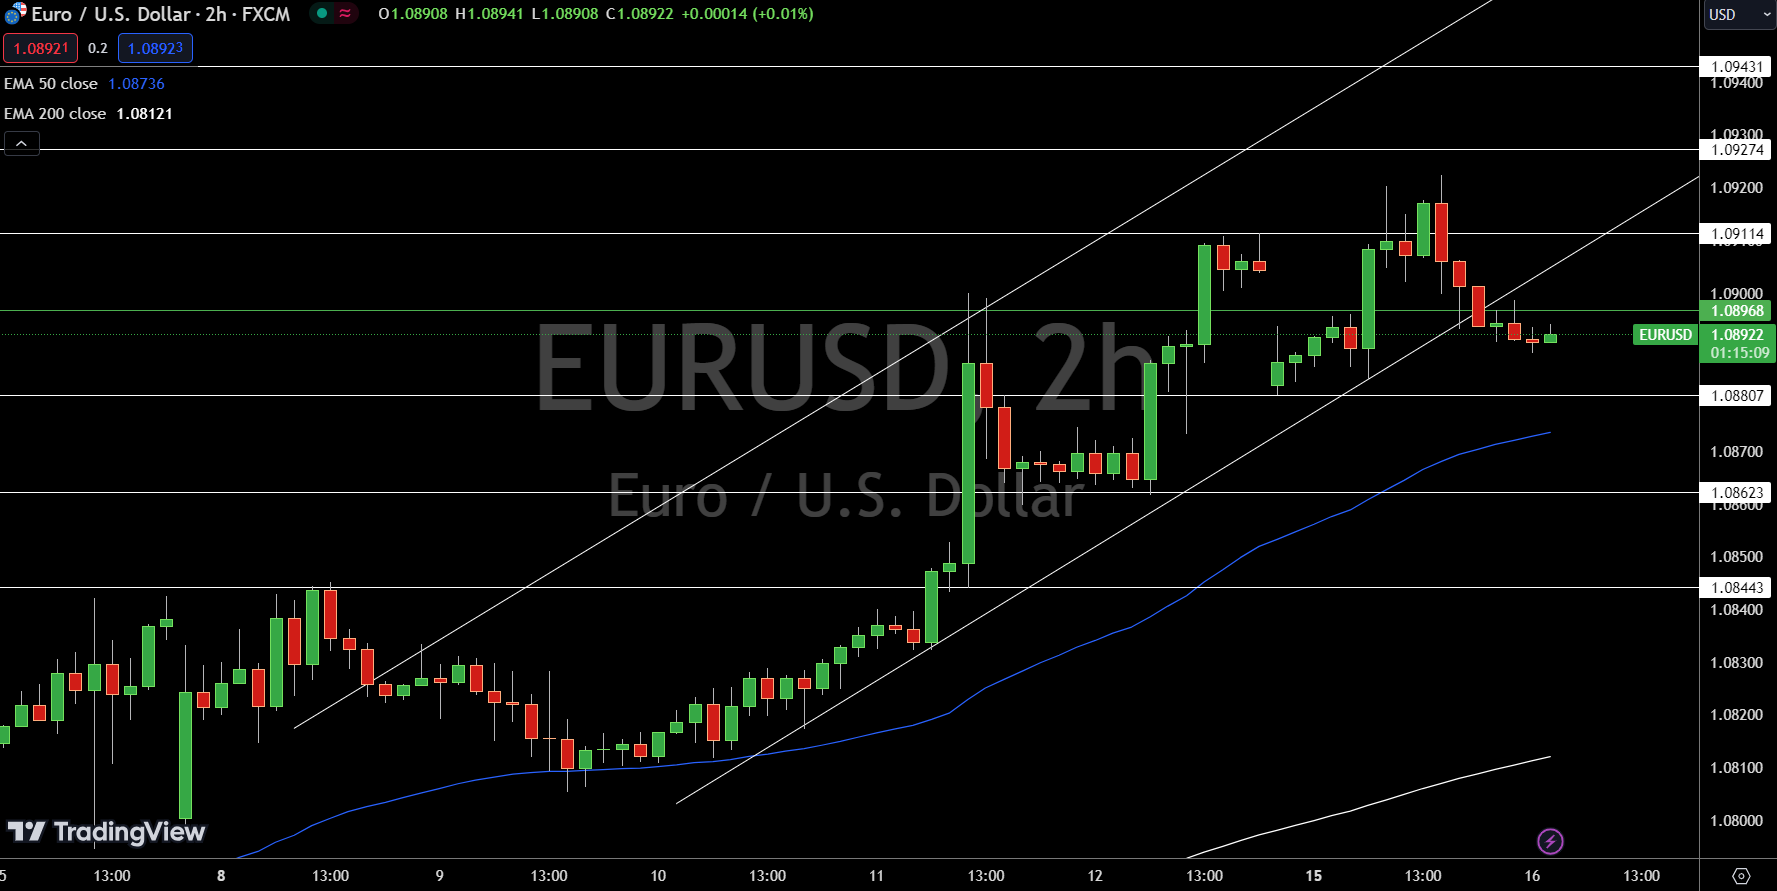
The EUR/USD is trading at $1.08922, down 0.02%. The 4-hour chart shows a pivot point at $1.08968. Immediate resistance levels are $1.09114, $1.09274, and $1.09431. Support levels are at $1.08807, $1.08623, and $1.08443.
The 50-day EMA is $1.08736, and the 200-day EMA is $1.08121. A bearish outlook prevails below the pivot point of $1.08968, suggesting further declines if the level is breached.
Conversely, a break above this pivot point could shift sentiment towards a bullish bias.
You have reached your limit of 5 free articles for this month.
Access all our articles, insights, and analysts.
Your coupon code
Gold price is looking to extend previous gains early Tuesday, having clinched a new two-month high at $2,440 a day ago. Growing expectations that a US Federal Reserve (Fed) interest-rate cut in September is a done deal continue to underpin the non-interest-bearing Gold price.
Fed Chairman Jerome Powell’s comments affirmed bets for a rate reduction in September after he said Monday that the central bank will not wait until inflation hits 2% to lower interest rates. The Fed is looking for “greater confidence” that inflation will return to the 2% level, Powell added.
Those remarks by the Fed Chief fuelled a fresh leg down in the US Dollar (USD) alongside the US Treasury bond yields, driving Gold price back toward an all-time high of $2,450.
Earlier in the day, Gold price witnessed some corrective moves, as the Greenback took advantage of risk-aversion induced by the weekend’s assassination attempt on ex-US President Donald Trump during his Pennsylvania rally. Investors digested the fateful Trump attack and ramped up the odds of his win in the US Presidential race.
Further, investors flocked to safety in the USD following China’s second-quarter GDP miss in Asian hours on Monday. Data released by the National Bureau of Statistics (NBS) showed Monday that the world’s second-largest economy grew 4.7% year-on-year in April-June, slowing from 5.3% in the previous three months while recording the weakest growth since the third quarter of 2023.
In Tuesday’s trading so far, Gold price is gathering strength for the next push higher even as the US Dollar stages a modest comeback. The rebound in the USD/JPY pair could be attributed to the USD uptick. However, weak US Treasury bond yields continue to support the non-yielding Gold price.
The bright metal also cheers the dovish comments from San Francisco Fed President Mary Daly. In her speech overnight, Daly said that she has confidence that inflation is heading lower.
Later in the day, the US Retail Sales report and Fedspeak will grab the eyeballs, as traders look to seal in a September Fed rate cut. Weaker-than-expected US Retail Sales data could reinforce the USD selling, lifting the Gold price northward.
Meanwhile, speculations that China could roll out stimulus measures to boost economic performance could also render Gold positive in the near term.
Gold price keeps sight on the all-time high at $2,450, as the 14-day Relative Strength Index (RSI) looks north near 65, at the press time.
The Bull Cross, represented by the 21-day Simple Moving Average (SMA) settling above the 50-day SMA on Friday, adds credence to the bullish potential.
Gold buyers, however, need to yield a daily closing above the previous two-month high of $2,425 to challenge the record highs of $2,450.
Ahead of that, the new two-month high of $2,440 could challenge the bearish commitments.
Alternatively, any pullback in Gold price could warrant a test of the $2,400 round level, below which Friday’s low of $2,391 could be tested.
The next relevant support levels are seen at the July 11 low of $2,371 and the $2,350 psychological levels.
Gold has played a key role in human’s history as it has been widely used as a store of value and medium of exchange. Currently, apart from its shine and usage for jewelry, the precious metal is widely seen as a safe-haven asset, meaning that it is considered a good investment during turbulent times. Gold is also widely seen as a hedge against inflation and against depreciating currencies as it doesn’t rely on any specific issuer or government.
Central banks are the biggest Gold holders. In their aim to support their currencies in turbulent times, central banks tend to diversify their reserves and buy Gold to improve the perceived strength of the economy and the currency. High Gold reserves can be a source of trust for a country’s solvency. Central banks added 1,136 tonnes of Gold worth around $70 billion to their reserves in 2022, according to data from the World Gold Council. This is the highest yearly purchase since records began. Central banks from emerging economies such as China, India and Turkey are quickly increasing their Gold reserves.
Gold has an inverse correlation with the US Dollar and US Treasuries, which are both major reserve and safe-haven assets. When the Dollar depreciates, Gold tends to rise, enabling investors and central banks to diversify their assets in turbulent times. Gold is also inversely correlated with risk assets. A rally in the stock market tends to weaken Gold price, while sell-offs in riskier markets tend to favor the precious metal.
The price can move due to a wide range of factors. Geopolitical instability or fears of a deep recession can quickly make Gold price escalate due to its safe-haven status. As a yield-less asset, Gold tends to rise with lower interest rates, while higher cost of money usually weighs down on the yellow metal. Still, most moves depend on how the US Dollar (USD) behaves as the asset is priced in dollars (XAU/USD). A strong Dollar tends to keep the price of Gold controlled, whereas a weaker Dollar is likely to push Gold prices up.
Gold price is looking to extend previous gains early Tuesday, having clinched a new two-month high at $2,440 a day ago. Growing expectations that a US Federal Reserve (Fed) interest-rate cut in September is a done deal continue to underpin the non-interest-bearing Gold price.
Fed Chairman Jerome Powell’s comments affirmed bets for a rate reduction in September after he said Monday that the central bank will not wait until inflation hits 2% to lower interest rates. The Fed is looking for “greater confidence” that inflation will return to the 2% level, Powell added.
Those remarks by the Fed Chief fuelled a fresh leg down in the US Dollar (USD) alongside the US Treasury bond yields, driving Gold price back toward an all-time high of $2,450.
Earlier in the day, Gold price witnessed some corrective moves, as the Greenback took advantage of risk-aversion induced by the weekend’s assassination attempt on ex-US President Donald Trump during his Pennsylvania rally. Investors digested the fateful Trump attack and ramped up the odds of his win in the US Presidential race.
Further, investors flocked to safety in the USD following China’s second-quarter GDP miss in Asian hours on Monday. Data released by the National Bureau of Statistics (NBS) showed Monday that the world’s second-largest economy grew 4.7% year-on-year in April-June, slowing from 5.3% in the previous three months while recording the weakest growth since the third quarter of 2023.
In Tuesday’s trading so far, Gold price is gathering strength for the next push higher even as the US Dollar stages a modest comeback. The rebound in the USD/JPY pair could be attributed to the USD uptick. However, weak US Treasury bond yields continue to support the non-yielding Gold price.
The bright metal also cheers the dovish comments from San Francisco Fed President Mary Daly. In her speech overnight, Daly said that she has confidence that inflation is heading lower.
Later in the day, the US Retail Sales report and Fedspeak will grab the eyeballs, as traders look to seal in a September Fed rate cut. Weaker-than-expected US Retail Sales data could reinforce the USD selling, lifting the Gold price northward.
Meanwhile, speculations that China could roll out stimulus measures to boost economic performance could also render Gold positive in the near term.
Gold price keeps sight on the all-time high at $2,450, as the 14-day Relative Strength Index (RSI) looks north near 65, at the press time.
The Bull Cross, represented by the 21-day Simple Moving Average (SMA) settling above the 50-day SMA on Friday, adds credence to the bullish potential.
Gold buyers, however, need to yield a daily closing above the previous two-month high of $2,425 to challenge the record highs of $2,450.
Ahead of that, the new two-month high of $2,440 could challenge the bearish commitments.
Alternatively, any pullback in Gold price could warrant a test of the $2,400 round level, below which Friday’s low of $2,391 could be tested.
The next relevant support levels are seen at the July 11 low of $2,371 and the $2,350 psychological levels.
Gold has played a key role in human’s history as it has been widely used as a store of value and medium of exchange. Currently, apart from its shine and usage for jewelry, the precious metal is widely seen as a safe-haven asset, meaning that it is considered a good investment during turbulent times. Gold is also widely seen as a hedge against inflation and against depreciating currencies as it doesn’t rely on any specific issuer or government.
Central banks are the biggest Gold holders. In their aim to support their currencies in turbulent times, central banks tend to diversify their reserves and buy Gold to improve the perceived strength of the economy and the currency. High Gold reserves can be a source of trust for a country’s solvency. Central banks added 1,136 tonnes of Gold worth around $70 billion to their reserves in 2022, according to data from the World Gold Council. This is the highest yearly purchase since records began. Central banks from emerging economies such as China, India and Turkey are quickly increasing their Gold reserves.
Gold has an inverse correlation with the US Dollar and US Treasuries, which are both major reserve and safe-haven assets. When the Dollar depreciates, Gold tends to rise, enabling investors and central banks to diversify their assets in turbulent times. Gold is also inversely correlated with risk assets. A rally in the stock market tends to weaken Gold price, while sell-offs in riskier markets tend to favor the precious metal.
The price can move due to a wide range of factors. Geopolitical instability or fears of a deep recession can quickly make Gold price escalate due to its safe-haven status. As a yield-less asset, Gold tends to rise with lower interest rates, while higher cost of money usually weighs down on the yellow metal. Still, most moves depend on how the US Dollar (USD) behaves as the asset is priced in dollars (XAU/USD). A strong Dollar tends to keep the price of Gold controlled, whereas a weaker Dollar is likely to push Gold prices up.
Is the US economy heading for a recession?
Bloomberg TV Asia Pacific Chief Markets Editor David Ingles recently commented on the US economy. He said,
“Alas, looks like the US economy is cooling quicker than most analysts think. The Bloomberg US Economic Surprise Index has dropped to a 9-year low.”
USD/JPY trends depend on US retail sales and central bank commentary. Lower-than-expected US retail sales could signal September and December Fed rate cuts. Bank of Japan support for a July rate hike and cut to JGB purchases would also narrow interest rate differentials.
Investors should remain alert as the US retail sales loom. Monitor real-time data, central bank commentary, and expert commentary to adjust your trading strategies accordingly. Stay updated with our latest news and analysis to manage USD/JPY volatility.
The USD/JPY sat above the 50-day and 200-day EMAs, sending bullish price signals.
A USD/JPY breakout from 158.500 would support a move toward 160. A return to 160 could give the bulls a run at the July 3 high of 161.951.
Central bank commentary and US retail sales require consideration.
Conversely, a break below the 50-day EMA could signal a drop toward the 155 handle.
The 14-day RSI at 42.82 indicates a USD/JPY drop to 155 before entering oversold territory.
You have reached your limit of 5 free articles for this month.
Access all our articles, insights, and analysts.
Your coupon code
Gold price extends gains above the $2.400 mark, approaching its all-time high of $2,449.92. XAU/USD shed some ground at the beginning of the day amid resurgent US Dollar demand on the back of weekend news. Former President and current Republican candidate Donald Trump suffered an assassination attempt while on campaign in Pennsylvania, a headline that initially spurred risk-aversion.
However, the Greenback quickly lost ground as investors lifted bets that Trump could win the upcoming presidential election and loosen the fiscal policy. Meanwhile, Moody’s Credit Rating Agency said the Federal Reserve (Fed) could begin easing the monetary policy as soon as this month, as the central bank is scheduled to meet on July 30-31. Furthermore, analysts at Moody’s expect the Fed Funds Rate to be reduced by 50-75 bp in 2024 and another 100-125 bp through 2025. As a result, stock markets rallied, and Wall Street hit record highs.
Fed Chairman Jerome Powell spoke at the Economic Club of Washington DC and said that if the Fed waits for inflation to get to 2% to cut, it has waited too long, further fueling optimism. He also welcomed easing inflationary pressures in the second quarter of the year and added that an unexpected weakening in the labor market would merit a reaction from policymakers. Powell’s dovish tilt halted the stocks´ rally and helped the USD recover some modest ground.
From a technical point of view, XAU/USD retreats from intraday highs mid-American afternoon, but the daily chart shows the bullish case is alive and kicking. The pair is rallying far above bullish moving averages as technical indicators picked up upward momentum, approaching overbought readings and without signs of giving up.
In the near term, and according to the 4-hour chart, XAU/USD may struggle to extend gains. Technical indicators are retreating from overbought readings with uneven strength, still far from suggesting an upcoming slide. Nevertheless, the pair is developing above a bullish 20 Simple Moving Average (SMA) currently at around $2,403, while the longer moving averages slowly gain upward traction, but are far below the shorter one to become relevant.
Support levels: 2,418.10 2,403.00 2,391.20
Resistance levels: 2,439.60 2,450.00 2,465.00
Gold price extends gains above the $2.400 mark, approaching its all-time high of $2,449.92. XAU/USD shed some ground at the beginning of the day amid resurgent US Dollar demand on the back of weekend news. Former President and current Republican candidate Donald Trump suffered an assassination attempt while on campaign in Pennsylvania, a headline that initially spurred risk-aversion.
However, the Greenback quickly lost ground as investors lifted bets that Trump could win the upcoming presidential election and loosen the fiscal policy. Meanwhile, Moody’s Credit Rating Agency said the Federal Reserve (Fed) could begin easing the monetary policy as soon as this month, as the central bank is scheduled to meet on July 30-31. Furthermore, analysts at Moody’s expect the Fed Funds Rate to be reduced by 50-75 bp in 2024 and another 100-125 bp through 2025. As a result, stock markets rallied, and Wall Street hit record highs.
Fed Chairman Jerome Powell spoke at the Economic Club of Washington DC and said that if the Fed waits for inflation to get to 2% to cut, it has waited too long, further fueling optimism. He also welcomed easing inflationary pressures in the second quarter of the year and added that an unexpected weakening in the labor market would merit a reaction from policymakers. Powell’s dovish tilt halted the stocks´ rally and helped the USD recover some modest ground.
From a technical point of view, XAU/USD retreats from intraday highs mid-American afternoon, but the daily chart shows the bullish case is alive and kicking. The pair is rallying far above bullish moving averages as technical indicators picked up upward momentum, approaching overbought readings and without signs of giving up.
In the near term, and according to the 4-hour chart, XAU/USD may struggle to extend gains. Technical indicators are retreating from overbought readings with uneven strength, still far from suggesting an upcoming slide. Nevertheless, the pair is developing above a bullish 20 Simple Moving Average (SMA) currently at around $2,403, while the longer moving averages slowly gain upward traction, but are far below the shorter one to become relevant.
Support levels: 2,418.10 2,403.00 2,391.20
Resistance levels: 2,439.60 2,450.00 2,465.00
You have reached your limit of 5 free articles for this month.
Access all our articles, insights, and analysts.
Your coupon code
The US Dollar (USD) regained some composure in a mildly optimistic start to the week, pushing the USD Index (DXY) to the low-104.00s against the backdrop of a generalized knee-jerk in the risk-linked universe.
The modest advance in the Greenback dragged EUR/USD back below 1.0900 soon after spot hit new monthly peaks around 1.0920, all amidst marginal moves in the US and German money markets.
In the meantime, there was no news from Chief Powell, after he argued that he does not anticipate major economic turbulence or recession in the US economy, stating that a hard landing scenario is not the most likely. He also noted that progress is being made towards bringing price increases back to the Fed’s target.
Meanwhile, the CME Group’s FedWatch Tool fully priced in lower rates at the September 18 meeting.
Meanwhile, the macroeconomic landscape remained stable on both sides of the Atlantic. Consensus among investors expects the European Central Bank (ECB) to maintain its policy rate unchanged at its July 18 gathering, although markets continued to see two additional cuts by year-end.
On the other hand, investors continue to debate whether the Fed will implement one or two (or three) rate cuts this year, despite the Fed’s current projection of a single cut, likely in December.
The ECB’s rate cut in June, along with the Fed’s decision to maintain rates, has widened the policy divergence between the two central banks, potentially leading to further weakening of EUR/USD in the short term. However, economic recovery prospects in the Eurozone, combined with signs of cooling in key US economic indicators, may mitigate this disparity and occasionally support the pair in the near future.
Looking ahead, US Retail Sales could shed extra light on the Fed’s plans to reduce its interest rates, while the Economic Sentiment in Germany and the euro area are expected to take centre stage on the domestic calendar on Tuesday.
EUR/USD daily chart
EUR/USD is likely to reach the next upward hurdle at the July top of 1.0922 (July 15), followed by the March peak of 1.0981 (March 8) and the psychological 1.1000 barrier.
If bears gain control, spot might approach the 200-day SMA at 1.0805 before falling to a low of 1.0666 on June 26. From here, the May low of 1.0649 (May 1) leads to the 2024 bottom of 1.0601 (April 16).
Looking at the big picture, it appears that further gains are on the way if the key 200-day SMA is consistently surpassed.
So far, the 4-hour chart shows an increase in the positive momentum. The initial resistance level is 1.0922, ahead of 1.0981. On the flip side, the 55-SMA at 1.0832 is first, followed by the 200-SMA at 1.0786 and, finally, 1.0709. The relative strength index (RSI) has fallen below 66.
The US Dollar (USD) regained some composure in a mildly optimistic start to the week, pushing the USD Index (DXY) to the low-104.00s against the backdrop of a generalized knee-jerk in the risk-linked universe.
The modest advance in the Greenback dragged EUR/USD back below 1.0900 soon after spot hit new monthly peaks around 1.0920, all amidst marginal moves in the US and German money markets.
In the meantime, there was no news from Chief Powell, after he argued that he does not anticipate major economic turbulence or recession in the US economy, stating that a hard landing scenario is not the most likely. He also noted that progress is being made towards bringing price increases back to the Fed’s target.
Meanwhile, the CME Group’s FedWatch Tool fully priced in lower rates at the September 18 meeting.
Meanwhile, the macroeconomic landscape remained stable on both sides of the Atlantic. Consensus among investors expects the European Central Bank (ECB) to maintain its policy rate unchanged at its July 18 gathering, although markets continued to see two additional cuts by year-end.
On the other hand, investors continue to debate whether the Fed will implement one or two (or three) rate cuts this year, despite the Fed’s current projection of a single cut, likely in December.
The ECB’s rate cut in June, along with the Fed’s decision to maintain rates, has widened the policy divergence between the two central banks, potentially leading to further weakening of EUR/USD in the short term. However, economic recovery prospects in the Eurozone, combined with signs of cooling in key US economic indicators, may mitigate this disparity and occasionally support the pair in the near future.
Looking ahead, US Retail Sales could shed extra light on the Fed’s plans to reduce its interest rates, while the Economic Sentiment in Germany and the euro area are expected to take centre stage on the domestic calendar on Tuesday.
EUR/USD daily chart
EUR/USD is likely to reach the next upward hurdle at the July top of 1.0922 (July 15), followed by the March peak of 1.0981 (March 8) and the psychological 1.1000 barrier.
If bears gain control, spot might approach the 200-day SMA at 1.0805 before falling to a low of 1.0666 on June 26. From here, the May low of 1.0649 (May 1) leads to the 2024 bottom of 1.0601 (April 16).
Looking at the big picture, it appears that further gains are on the way if the key 200-day SMA is consistently surpassed.
So far, the 4-hour chart shows an increase in the positive momentum. The initial resistance level is 1.0922, ahead of 1.0981. On the flip side, the 55-SMA at 1.0832 is first, followed by the 200-SMA at 1.0786 and, finally, 1.0709. The relative strength index (RSI) has fallen below 66.