The main category of Forex News.
You can use the search box below to find what you need.
[wd_asp id=1]
The main category of Forex News.
You can use the search box below to find what you need.
[wd_asp id=1]
Two Fibonacci targets were tested as support, and they failed to stop the decline. A descending ABCD pattern completed at 2.20. The target comes from an extended version of the pattern where the second decline marked by CD is 127.2% the distance in price for the first leg down, from point A to point B. The 127.2% Fibonacci ratio is derived from square root of 1.618 (the golden ratio) multiplied by 100. Further, a 61.8% Fibonacci retracement completed at 2.18. The low of the potential support zone as highlighted on the chart was 2.17.
Since the bottom of the support zone has been broken to the downside the next lower support zone is at risk of being reached. Nevertheless, support zones are areas of possible support. If a daily close occurs today above 2.17, natural gas may have a chance to bounce in the short-term.
Otherwise, a daily close below 2.17, points to lower prices in the near-term. There looks to be an interim price level around 2.09, from a prior internal swing high. But the next key lower price zone where support may be seen is down to around 2.00. That is an even number and where the recent rise in prices began.
The initial bullish advance off the confirmed an upside breakout of a symmetrical triangle bottom consolidation pattern at 2.00. That was the top of the triangle pattern where a rise above further confirms the bull breakout. There is also the completion of another lower target for an extended falling ABCD pattern at 2.02. In this case, the extension utilized the 161.8% ratio to identify a lower target for the CD leg of the decline. Lower still is the 78.6% Fibonacci ratio at 1.92.
For a look at all of today’s economic events, check out our economic calendar.
U.S. retail sales are in focus this week. Image © Adobe Images
Pound Sterling has risen to its highest level in a year against the Dollar after last week’s 1.35% gain. But, the rally leaves it technically overbought in the near term and exposed to weakness if this week’s inflation and wage figures undershoot expectations.
The Pound to Dollar exchange rate hit a high of 1.2990 on Friday and holds onto these gains as Monday brings about a busy week for the British currency.
The pair quotes at 1.2976 at the time of writing, which means the most competitive payment rates on offer are now near 1.2914. The odds of a pullback are high, with the daily RSI now reading at 72.98.
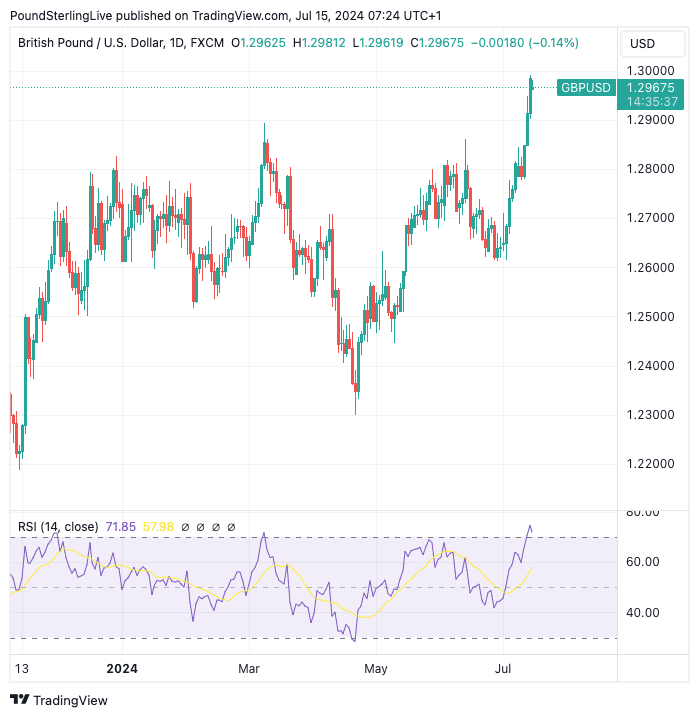
Above: GBP/USD at daily intervals with the RSI in the lower panel. Track GBP/USD with your custom alerts; find out more here.
A reading above 70 is consistent with overbought signals. The RSI rarely stays above 70 or below 30 as it tends to revert towards 50. To achieve this, a period of consolidation or weakness must ensue.
Any weakness in the coming days could be restricted to the previous 2024 cycle highs at 1.2893 and 1.2860, respectively.
Weakness is seen as temporary at this juncture as Pound-Dollar trades well above its key moving averages, which confirms the exchange rate is in an uptrend that can continue to extend once a period of consolidation has taken place.
“The cable has surged above its bearish trend line that has persisted since June 2021, hinting at a possible significant upward movement,” says Fawad Razaqzada, an analyst at City Index.

Pound Sterling outperformance means it stands at the top of the G10 currency basket for 2024 thanks to a trifecta of developments: 1) improving domestic data, 2) a retreat in Bank of England rate cut expectations and, 3) improved political sentiment.
“The GBP currently has the strongest upward momentum amongst G10 currencies. The UK election result has created a more favourable backdrop for the GBP. The large majority for Labour should ensure a period of much-needed political stability in the UK,” says Lee Hardman, an analyst at MUFG Bank Ltd.
The key tests for the Pound come from this week’s inflation and wage figures. Services inflation is expected to read at 5.6% and headline CPI inflation is forecast to read at 2.0%. Any undershoot would raise the odds of an August 01 rate cut and send an overbought Pound-Dollar sharply lower.
Analysts at Oxford Economics reckon the headline CPI inflation print will be 1.8%, which would represent a decent undershoot and prompt a selloff in the Pound.
“Considering the GBP has been the best performing G-10 currency QTD, we think it remains prone to a larger correction if CPI print comes in lower than expectations,” says Daragh Maher, Head of FX Strategy at HSBC.
However, the sell-off in the Pound would be limited because the Bank of England will find it difficult to cut aggressively if the economy continues to perform robustly, something several economists said was likely following last week’s GDP release.
Regarding the wage numbers on Thursday, the expectation is for average weekly earnings to have increased by 5.8% over the year to June. Anything below here would result in GBP selling.
Pound-Dollar’s performance nevertheless reflects Dollar weakness more than anything. We note that the dollar has come under pressure over recent days as investors settle on a high likelihood that the Federal Reserve will cut interest rates for the first time in September.
Confidence was boosted by last week’s undershoot in U.S. CPI inflation data. Pound-Dollar smashed through the 1.29 barrier to quote at a new 2024 high of 1.2935 after U.S. CPI inflation printed -0.1% month-on-month in June, down from 0% in May and below expectations for a 0.1% rise.
“Turbo-charging the pound’s recent uplift was data showing US inflation cooled last month, boosting bets of more Fed rate cuts this year and next,” says George Vessey, Lead FX Strategist at Convera.
Money market pricing shows the odds of a September interest rate cut at the Fed are now priced as a near certainty after the headline inflation rate fell to 3.0% year-on-year from 3.3%, undershooting expectations for 3.1%.
Tuesday’s retail sales will be the U.S. data highlight of the coming days, shedding light on demand in the economy. The market’s expectation of an undershoot of the 0% m/m figure could result in further USD weakness as the Fed would become increasingly confident that the disinflation process was underway again.
On the economic side, Japan’s nationwide price growth is expected to strengthen to 2.7% in June data released next Friday, a result that could fuel expectations that the Bank of Japan will consider combining a reduction in bond purchases with a rate hike at its meeting later this month. Japanese workers’ basic wages jumped by the most since 1993, an encouraging sign that the underlying wage trend may start to support consumption and enable the Bank of Japan to raise interest rates again.

On the US side, the so-called core US consumer price index – which excludes food and energy costs – rose 0.1% from May, the smallest gain in three years. The overall index fell for the first time since the start of the pandemic, weighed down by lower gasoline prices. Meanwhile, the distressed investors see buying distressed US real estate as one of their best opportunities in a generation, as the collapse of commercial real estate continues to roil the market. Nearly $1 trillion in commercial real estate debt is set to mature this year in the US, according to the Mortgage Bankers Association, and rising default rates as borrowers fail to repay are creating more options for buyers of distressed assets.
On the stock trading front, US stocks close near record highs. According to trading, US stocks pared some of their gains to close near record highs on Friday, supported by rising expectations for a September interest rate cut amid signs of easing inflation as earnings season begins with banks in focus.
The S&P 500 rose 0.5%, after hitting an all-time high of 5,655 during the session. Also, the Nasdaq 100 rose 0.5%, rebounding from its worst day since April. Furthermore, the Dow Jones jumped 247 points, closing above the 40,000 marks for the second time, having last reached that level on May 17. Moreover, JPMorgan shares fell 1.2% despite higher-than-expected revenue driven by higher investment banking fees. Likewise, Citigroup fell 1.8% even after beating revenue and earnings expectations. Ultimately, Wells Fargo shares fell 6% after reporting lower-than-expected net interest income.
During last week’s trading, the Dow led gains, jumping 1%, followed by the S&P 500 (+0.6%) while the Nasdaq 100 fell (-0.5%).
The USD/JPY pair continues to trade slightly below its 100-hour moving average. A late pullback on Friday pushed the pair closer to the oversold levels of the 14-hour RSI. In the near term, based on the hourly chart, the USD/JPY pair is trading within a sideways channel. However, the 14-hour RSI has recently declined to approach oversold conditions. Therefore, the bears will target extended pullbacks around 156.96 or lower at the 156.14 support. On the other hand, the bulls will look to pounce on the bounces around 158.55 or higher at the 159.33 resistance.
In the long term, based on the daily chart, the USD/JPY pair is trading within an ascending channel. However, the 14-day RSI has recently retreated to recover from overbought levels. Therefore, bears will target extended pullback profits around 154.50 or lower at 150.82 support. On the other hand, bulls will look to pounce on profits around 161.90 or higher at 165.35 resistance.
Ready to trade our daily forex forecast? Here are the best forex brokers in Japan to choose from.
You have reached your limit of 5 free articles for this month.
Access all our articles, insights, and analysts.
Your coupon code
The EUR/USD pair trades in the 1.0900 price zone, near the intraday peak at 1.0919, its highest since mid-March. The US Dollar started the day with a firmer tone, gaping higher vs most major rivals following the weekend events in the United States (US). Former President Donald Trump and the current candidate of the Republican Party suffered an assassination attempt while attending a campaign rally event.
Fears initially hit financial markets, but as the dust settled, optimism returned. Market players increased bets Trump would win the presidential election and implement a more liberal fiscal programme, fueling risk appetite.
Data-wise, Eurizone published May Industrial Production data, which resulted better than anticipated, falling 0.6% in the month against the -1% anticipated. Across the pond, the US published the NY Empire State Manufacturing Index, which fell more than anticipated to -6.6.
Federal Reserve (Fed) Chairman Jerome Powell is due to speak at the Economic Club of Washington DC after Wall Street’s opening, and audience questions are expected. Speculative interest will be looking for clues on upcoming monetary policy movements. The week will be flooded with comments from US policymakers ahead of the upcoming monetary policy meeting on July 31.
The EUR/USD pair maintains the positive tone, although it trades below Friday’s close. Nevertheless, the daily chart shows it posted a fourth consecutive higher high and higher low, in line with a bullish continuation. Technical indicators in the mentioned time frame offer neutral-to-bullish slopes near overbought readings and without signs of upward exhaustion. Finally, EUR/USD extends its advance above all its moving averages, with the 20 Simple Moving Average (SMA) heading firmly north, although still below the 100 and 200 SMAs.
In the near term, and according to the 4-hour chart, however, buyers seem to be on pause. Technical indicators turned flat, reflecting receding interest, yet sellers are nowhere to be found. Additionally, EUR/USD keeps developing above all its moving averages, with the 20 SMA maintaining its bullish slope above the longer ones, and providing dynamic support at around 1.0870.
Support levels: 1.0870 1.0835 1.0790
Resistance levels: 1.0940 1.0990 1.1020
The EUR/USD pair trades in the 1.0900 price zone, near the intraday peak at 1.0919, its highest since mid-March. The US Dollar started the day with a firmer tone, gaping higher vs most major rivals following the weekend events in the United States (US). Former President Donald Trump and the current candidate of the Republican Party suffered an assassination attempt while attending a campaign rally event.
Fears initially hit financial markets, but as the dust settled, optimism returned. Market players increased bets Trump would win the presidential election and implement a more liberal fiscal programme, fueling risk appetite.
Data-wise, Eurizone published May Industrial Production data, which resulted better than anticipated, falling 0.6% in the month against the -1% anticipated. Across the pond, the US published the NY Empire State Manufacturing Index, which fell more than anticipated to -6.6.
Federal Reserve (Fed) Chairman Jerome Powell is due to speak at the Economic Club of Washington DC after Wall Street’s opening, and audience questions are expected. Speculative interest will be looking for clues on upcoming monetary policy movements. The week will be flooded with comments from US policymakers ahead of the upcoming monetary policy meeting on July 31.
The EUR/USD pair maintains the positive tone, although it trades below Friday’s close. Nevertheless, the daily chart shows it posted a fourth consecutive higher high and higher low, in line with a bullish continuation. Technical indicators in the mentioned time frame offer neutral-to-bullish slopes near overbought readings and without signs of upward exhaustion. Finally, EUR/USD extends its advance above all its moving averages, with the 20 Simple Moving Average (SMA) heading firmly north, although still below the 100 and 200 SMAs.
In the near term, and according to the 4-hour chart, however, buyers seem to be on pause. Technical indicators turned flat, reflecting receding interest, yet sellers are nowhere to be found. Additionally, EUR/USD keeps developing above all its moving averages, with the 20 SMA maintaining its bullish slope above the longer ones, and providing dynamic support at around 1.0870.
Support levels: 1.0870 1.0835 1.0790
Resistance levels: 1.0940 1.0990 1.1020
And I do recognize that above the $2.50 level is a significant barrier. If we can break that, then we really will start to take off to the upside in my estimation. But we are just as likely to drop down to $2.15 before seeing that. So, I’m waiting for a bounce and some type of follow through. I already have a position through an ETF that is a little bit better than breakeven at the moment, and I did collect some profit several weeks ago, but at this point in time I am looking to reload that position.
I haven’t seen the market do enough for me to get involved yet, but it is something that I’ll be buying and probably more likely than not selling sometime in fall or maybe even early winter. Once the high season for heating comes back to play.
For a look at all of today’s economic events, check out our economic calendar.
You have reached your limit of 5 free articles for this month.
Access all our articles, insights, and analysts.
Your coupon code
After gaining more than 1% for the second consecutive week, GBP/USD stays in a consolidation phase below 1.3000 on Monday. The pair’s technical picture continues to point to overbought conditions as markets wait for Federal Reserve (Fed) Chairman Jerome Powell to speak at the Economic Club of Washington later in the day.
The table below shows the percentage change of British Pound (GBP) against listed major currencies last 7 days. British Pound was the strongest against the New Zealand Dollar.
| USD | EUR | GBP | JPY | CAD | AUD | NZD | CHF | |
|---|---|---|---|---|---|---|---|---|
| USD | -0.66% | -1.26% | -1.71% | -0.01% | -0.42% | 0.71% | -0.25% | |
| EUR | 0.66% | -0.40% | -0.69% | 0.97% | 0.41% | 1.72% | 0.75% | |
| GBP | 1.26% | 0.40% | -0.35% | 1.40% | 0.82% | 2.13% | 1.16% | |
| JPY | 1.71% | 0.69% | 0.35% | 1.72% | 1.32% | 2.61% | 1.53% | |
| CAD | 0.01% | -0.97% | -1.40% | -1.72% | -0.45% | 0.72% | -0.22% | |
| AUD | 0.42% | -0.41% | -0.82% | -1.32% | 0.45% | 1.31% | 0.34% | |
| NZD | -0.71% | -1.72% | -2.13% | -2.61% | -0.72% | -1.31% | -0.96% | |
| CHF | 0.25% | -0.75% | -1.16% | -1.53% | 0.22% | -0.34% | 0.96% |
The heat map shows percentage changes of major currencies against each other. The base currency is picked from the left column, while the quote currency is picked from the top row. For example, if you pick the British Pound from the left column and move along the horizontal line to the US Dollar, the percentage change displayed in the box will represent GBP (base)/USD (quote).
The broad-based selling pressure surrounding the US Dollar (USD) fuelled GBP/USD’s rally last week. Softer-than-expected inflation data from June fed into expectations for a Fed rate cut in September and caused the USD to weaken against its rivals. According to the CME FedWatch Tool, the probability of the Fed leaving the policy rate unchanged in September is now less than 6%.
The US economic calendar will not feature any high-impact macroeconomic data releases on Monday. US Retail Sales data on Tuesday and UK inflation data on Wednesday will be this week’s key data releases. Ahead of these data, Fed Chairman Powell’s remarks will be watched closely by market participants.
In case Powell acknowledges soft inflation data and adopts a dovish tone, the USD could stay under pressure with market participants anticipating multiple rate cuts later in the year, even though the market positioning suggests that a September rate reduction is nearly fully priced in.
On the other hand, the USD could gather strength and cause GBP/USD to stretch lower if Powell reiterates the data-dependent approach and downplays the latest decline in inflation.
The Relative Strength Index (RSI) indicator on the 4-hour chart stays well above 70 despite the latest retreat, suggesting that GBP/USD remains technically overbought. The upper limit of the ascending regression channel coming from late April stays intact as key resistance at 1.3000. While this level holds, buyers could stay on the sidelines and allow an extended correction.
On the downside, 1.2950 (static level) aligns as interim support before 1.2900 (psychological level, static level) and 1.2830 (mid-point of the ascending channel).
If GBP/USD manages to rise above 1.3000 and stabilize there, 1.3040 (static level from July 2023) could be seen as next resistance before 1.3100 (psychological level, static level).
The Pound Sterling (GBP) is the oldest currency in the world (886 AD) and the official currency of the United Kingdom. It is the fourth most traded unit for foreign exchange (FX) in the world, accounting for 12% of all transactions, averaging $630 billion a day, according to 2022 data. Its key trading pairs are GBP/USD, aka ‘Cable’, which accounts for 11% of FX, GBP/JPY, or the ‘Dragon’ as it is known by traders (3%), and EUR/GBP (2%). The Pound Sterling is issued by the Bank of England (BoE).
The single most important factor influencing the value of the Pound Sterling is monetary policy decided by the Bank of England. The BoE bases its decisions on whether it has achieved its primary goal of “price stability” – a steady inflation rate of around 2%. Its primary tool for achieving this is the adjustment of interest rates. When inflation is too high, the BoE will try to rein it in by raising interest rates, making it more expensive for people and businesses to access credit. This is generally positive for GBP, as higher interest rates make the UK a more attractive place for global investors to park their money. When inflation falls too low it is a sign economic growth is slowing. In this scenario, the BoE will consider lowering interest rates to cheapen credit so businesses will borrow more to invest in growth-generating projects.
Data releases gauge the health of the economy and can impact the value of the Pound Sterling. Indicators such as GDP, Manufacturing and Services PMIs, and employment can all influence the direction of the GBP. A strong economy is good for Sterling. Not only does it attract more foreign investment but it may encourage the BoE to put up interest rates, which will directly strengthen GBP. Otherwise, if economic data is weak, the Pound Sterling is likely to fall.
Another significant data release for the Pound Sterling is the Trade Balance. This indicator measures the difference between what a country earns from its exports and what it spends on imports over a given period. If a country produces highly sought-after exports, its currency will benefit purely from the extra demand created from foreign buyers seeking to purchase these goods. Therefore, a positive net Trade Balance strengthens a currency and vice versa for a negative balance.
After gaining more than 1% for the second consecutive week, GBP/USD stays in a consolidation phase below 1.3000 on Monday. The pair’s technical picture continues to point to overbought conditions as markets wait for Federal Reserve (Fed) Chairman Jerome Powell to speak at the Economic Club of Washington later in the day.
The table below shows the percentage change of British Pound (GBP) against listed major currencies last 7 days. British Pound was the strongest against the New Zealand Dollar.
| USD | EUR | GBP | JPY | CAD | AUD | NZD | CHF | |
|---|---|---|---|---|---|---|---|---|
| USD | -0.66% | -1.26% | -1.71% | -0.01% | -0.42% | 0.71% | -0.25% | |
| EUR | 0.66% | -0.40% | -0.69% | 0.97% | 0.41% | 1.72% | 0.75% | |
| GBP | 1.26% | 0.40% | -0.35% | 1.40% | 0.82% | 2.13% | 1.16% | |
| JPY | 1.71% | 0.69% | 0.35% | 1.72% | 1.32% | 2.61% | 1.53% | |
| CAD | 0.01% | -0.97% | -1.40% | -1.72% | -0.45% | 0.72% | -0.22% | |
| AUD | 0.42% | -0.41% | -0.82% | -1.32% | 0.45% | 1.31% | 0.34% | |
| NZD | -0.71% | -1.72% | -2.13% | -2.61% | -0.72% | -1.31% | -0.96% | |
| CHF | 0.25% | -0.75% | -1.16% | -1.53% | 0.22% | -0.34% | 0.96% |
The heat map shows percentage changes of major currencies against each other. The base currency is picked from the left column, while the quote currency is picked from the top row. For example, if you pick the British Pound from the left column and move along the horizontal line to the US Dollar, the percentage change displayed in the box will represent GBP (base)/USD (quote).
The broad-based selling pressure surrounding the US Dollar (USD) fuelled GBP/USD’s rally last week. Softer-than-expected inflation data from June fed into expectations for a Fed rate cut in September and caused the USD to weaken against its rivals. According to the CME FedWatch Tool, the probability of the Fed leaving the policy rate unchanged in September is now less than 6%.
The US economic calendar will not feature any high-impact macroeconomic data releases on Monday. US Retail Sales data on Tuesday and UK inflation data on Wednesday will be this week’s key data releases. Ahead of these data, Fed Chairman Powell’s remarks will be watched closely by market participants.
In case Powell acknowledges soft inflation data and adopts a dovish tone, the USD could stay under pressure with market participants anticipating multiple rate cuts later in the year, even though the market positioning suggests that a September rate reduction is nearly fully priced in.
On the other hand, the USD could gather strength and cause GBP/USD to stretch lower if Powell reiterates the data-dependent approach and downplays the latest decline in inflation.
The Relative Strength Index (RSI) indicator on the 4-hour chart stays well above 70 despite the latest retreat, suggesting that GBP/USD remains technically overbought. The upper limit of the ascending regression channel coming from late April stays intact as key resistance at 1.3000. While this level holds, buyers could stay on the sidelines and allow an extended correction.
On the downside, 1.2950 (static level) aligns as interim support before 1.2900 (psychological level, static level) and 1.2830 (mid-point of the ascending channel).
If GBP/USD manages to rise above 1.3000 and stabilize there, 1.3040 (static level from July 2023) could be seen as next resistance before 1.3100 (psychological level, static level).
The Pound Sterling (GBP) is the oldest currency in the world (886 AD) and the official currency of the United Kingdom. It is the fourth most traded unit for foreign exchange (FX) in the world, accounting for 12% of all transactions, averaging $630 billion a day, according to 2022 data. Its key trading pairs are GBP/USD, aka ‘Cable’, which accounts for 11% of FX, GBP/JPY, or the ‘Dragon’ as it is known by traders (3%), and EUR/GBP (2%). The Pound Sterling is issued by the Bank of England (BoE).
The single most important factor influencing the value of the Pound Sterling is monetary policy decided by the Bank of England. The BoE bases its decisions on whether it has achieved its primary goal of “price stability” – a steady inflation rate of around 2%. Its primary tool for achieving this is the adjustment of interest rates. When inflation is too high, the BoE will try to rein it in by raising interest rates, making it more expensive for people and businesses to access credit. This is generally positive for GBP, as higher interest rates make the UK a more attractive place for global investors to park their money. When inflation falls too low it is a sign economic growth is slowing. In this scenario, the BoE will consider lowering interest rates to cheapen credit so businesses will borrow more to invest in growth-generating projects.
Data releases gauge the health of the economy and can impact the value of the Pound Sterling. Indicators such as GDP, Manufacturing and Services PMIs, and employment can all influence the direction of the GBP. A strong economy is good for Sterling. Not only does it attract more foreign investment but it may encourage the BoE to put up interest rates, which will directly strengthen GBP. Otherwise, if economic data is weak, the Pound Sterling is likely to fall.
Another significant data release for the Pound Sterling is the Trade Balance. This indicator measures the difference between what a country earns from its exports and what it spends on imports over a given period. If a country produces highly sought-after exports, its currency will benefit purely from the extra demand created from foreign buyers seeking to purchase these goods. Therefore, a positive net Trade Balance strengthens a currency and vice versa for a negative balance.
The USD/JPY forecast is pessimistic as the yen remains close to a four-week peak following indications that the Bank of Japan intervened in the markets on Thursday. Meanwhile, the dollar recovered briefly on Monday as Trump’s assassination attempt raised the chances of his victory.
–Are you interested in learning more about Forex brokers? Check our detailed guide-
The dollar edged higher as the likelihood of a Trump win increased after an attempt at his life. A Trump win would mean higher tariffs and looser fiscal policy. Moreover, the earnings outlook could improve. However, this was not enough to reverse last week’s moves after the US consumer inflation report.
Inflation unexpectedly fell for the first time in June, surprising economists who had expected a slight increase. The annual figure also moved closer to the US central bank’s target, increasing by a smaller-than-expected 3.0%. Consequently, there was an increase in Fed rate cut expectations. The likelihood of a cut in September rose to 94% from 73%.
Furthermore, the yen surged after the CPI report, with data on Friday showing that the Bank of Japan intervened in the markets. Notably, the BoJ used over 3.37 trillion yen to buy the currency on Thursday. However, top officials kept quiet about the intervention.
Elsewhere, data on Friday revealed that inflation expectations in Japan have risen. 90% of households expect an increase in prices a year from now. This could encourage the Bank of Japan to continue hiking interest rates. The prospect of cuts by the Fed and hikes by the BoJ benefit the yen.
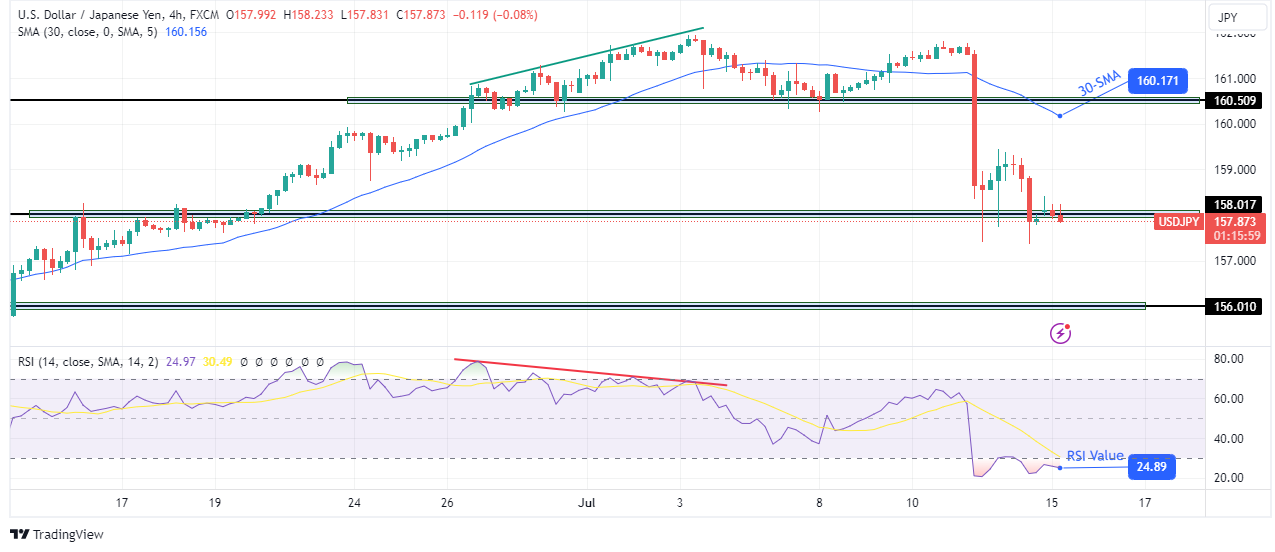
On the technical side, the USD/JPY price trades well below the 30-SMA, indicating a steep bearish move. Bears took control with a solid bear candle that broke below the 30-SMA and the 160.50 key level. The decline paused at the 158.01 support level. Here, bulls emerged but were not strong enough to retest the 30-SMA.
–Are you interested in learning more about crypto signals Telegram groups? Check our detailed guide-
As a result, bears are on the verge of breaking below 158.01. If they succeed, the next hurdle will be at the 156.01 level. On the other hand, if they fail, the price will likely climb to retest the 30-SMA before the downtrend continues.
Looking to trade forex now? Invest at eToro!
68% of retail investor accounts lose money when trading CFDs with this provider. You should consider whether you can afford to take the high risk of losing your money.
You have reached your limit of 5 free articles for this month.
Access all our articles, insights, and analysts.
Your coupon code
Gold price is defending the $2,400 threshold early Monday, holding its corrective mode from a two-month top set at $2,425 on Thursday.
The subdued performance in Gold price could be attributed to a broad-based US Dollar (USD) rebound alongside firmer US 10-year Treasury bond yields, as investors digest Saturday’s fateful incident at former US President Donald Trump’s Pennsylvania rally, where several bullets were shot and one such shot ripped the upper part of his right ear.
The assassination attempt on ex-US President Trump fuelled a fresh bout of risk-aversion in the early Asian hours, helping the Greenback stage a modest comeback after the previous week’s slump. The attack made Trump’s victory more likely, although it poses a new level of political uncertainty for markets, lifting the US Treasury bond yields higher at the expense of the government bonds.
Amidst broad US Dollar firmness and higher yields, the non-yielding Gold price remains on the back foot. The Gold price downside, however, appears capped amid slower-than-expected China economic growth and heightened bets for a US Federal Reserve (Fed) interest-rate cut in September.
Data released by the National Bureau of Statistics (NBS) showed Monday that the world’s second-largest economy grew 4.7% year-on-year in April-June, slowing from 5.3% in the previous three months while recording the weakest growth since the third quarter of 2023. The market forecast was for a 5.1% readout. Dwindling Chinese growth prospects fan expectations that China could roll out stimulus measures sooner rather than later to stimulate the economy.
Meanwhile, markets are now pricing in an over 90% chance that the Fed will lower rates in September, especially after the US Consumer Price Index (CPI), released last Thursday, climbed 3.0% YoY in June, slowing from a 3.3% increase in May and below the 3.1% expected print.
Later in the day, Gold traders will pay a close ear to Fed Chairman Jerome Powell’s appearance at the Economic Club of Washington for fresh policy cues and their implications on the bright metal. Additionally, US political developments will grab attention, as they could have a significant impact on the value of the USD and the Gold price.
Gold price remains on track to retest the all-time high at $2,450, as the 14-day Relative Strength Index (RSI) holds firm above the 50 level.
Further, the 21-day Simple Moving Average (SMA) settled above the 50-day SMA on Friday, confirming a Bull Cross and making another case for additional upside in Gold price.
Gold buyers, however, need to yield a decisive break above the two-month high of $2,425 to challenge the record highs of $2,450.
A sustained move above the latter will open the door toward the $2,500 key level.
On the flip side, Gold price could face immediate support at Friday’s low of $2,391 should the correction gather strength.
The next relevant downside cushion is seen at the July 11 low of $2,371, below which the $2,350 psychological level could act as a tough nut to crack for Gold sellers.
Gold has played a key role in human’s history as it has been widely used as a store of value and medium of exchange. Currently, apart from its shine and usage for jewelry, the precious metal is widely seen as a safe-haven asset, meaning that it is considered a good investment during turbulent times. Gold is also widely seen as a hedge against inflation and against depreciating currencies as it doesn’t rely on any specific issuer or government.
Central banks are the biggest Gold holders. In their aim to support their currencies in turbulent times, central banks tend to diversify their reserves and buy Gold to improve the perceived strength of the economy and the currency. High Gold reserves can be a source of trust for a country’s solvency. Central banks added 1,136 tonnes of Gold worth around $70 billion to their reserves in 2022, according to data from the World Gold Council. This is the highest yearly purchase since records began. Central banks from emerging economies such as China, India and Turkey are quickly increasing their Gold reserves.
Gold has an inverse correlation with the US Dollar and US Treasuries, which are both major reserve and safe-haven assets. When the Dollar depreciates, Gold tends to rise, enabling investors and central banks to diversify their assets in turbulent times. Gold is also inversely correlated with risk assets. A rally in the stock market tends to weaken Gold price, while sell-offs in riskier markets tend to favor the precious metal.
The price can move due to a wide range of factors. Geopolitical instability or fears of a deep recession can quickly make Gold price escalate due to its safe-haven status. As a yield-less asset, Gold tends to rise with lower interest rates, while higher cost of money usually weighs down on the yellow metal. Still, most moves depend on how the US Dollar (USD) behaves as the asset is priced in dollars (XAU/USD). A strong Dollar tends to keep the price of Gold controlled, whereas a weaker Dollar is likely to push Gold prices up.
Gold price is defending the $2,400 threshold early Monday, holding its corrective mode from a two-month top set at $2,425 on Thursday.
The subdued performance in Gold price could be attributed to a broad-based US Dollar (USD) rebound alongside firmer US 10-year Treasury bond yields, as investors digest Saturday’s fateful incident at former US President Donald Trump’s Pennsylvania rally, where several bullets were shot and one such shot ripped the upper part of his right ear.
The assassination attempt on ex-US President Trump fuelled a fresh bout of risk-aversion in the early Asian hours, helping the Greenback stage a modest comeback after the previous week’s slump. The attack made Trump’s victory more likely, although it poses a new level of political uncertainty for markets, lifting the US Treasury bond yields higher at the expense of the government bonds.
Amidst broad US Dollar firmness and higher yields, the non-yielding Gold price remains on the back foot. The Gold price downside, however, appears capped amid slower-than-expected China economic growth and heightened bets for a US Federal Reserve (Fed) interest-rate cut in September.
Data released by the National Bureau of Statistics (NBS) showed Monday that the world’s second-largest economy grew 4.7% year-on-year in April-June, slowing from 5.3% in the previous three months while recording the weakest growth since the third quarter of 2023. The market forecast was for a 5.1% readout. Dwindling Chinese growth prospects fan expectations that China could roll out stimulus measures sooner rather than later to stimulate the economy.
Meanwhile, markets are now pricing in an over 90% chance that the Fed will lower rates in September, especially after the US Consumer Price Index (CPI), released last Thursday, climbed 3.0% YoY in June, slowing from a 3.3% increase in May and below the 3.1% expected print.
Later in the day, Gold traders will pay a close ear to Fed Chairman Jerome Powell’s appearance at the Economic Club of Washington for fresh policy cues and their implications on the bright metal. Additionally, US political developments will grab attention, as they could have a significant impact on the value of the USD and the Gold price.
Gold price remains on track to retest the all-time high at $2,450, as the 14-day Relative Strength Index (RSI) holds firm above the 50 level.
Further, the 21-day Simple Moving Average (SMA) settled above the 50-day SMA on Friday, confirming a Bull Cross and making another case for additional upside in Gold price.
Gold buyers, however, need to yield a decisive break above the two-month high of $2,425 to challenge the record highs of $2,450.
A sustained move above the latter will open the door toward the $2,500 key level.
On the flip side, Gold price could face immediate support at Friday’s low of $2,391 should the correction gather strength.
The next relevant downside cushion is seen at the July 11 low of $2,371, below which the $2,350 psychological level could act as a tough nut to crack for Gold sellers.
Gold has played a key role in human’s history as it has been widely used as a store of value and medium of exchange. Currently, apart from its shine and usage for jewelry, the precious metal is widely seen as a safe-haven asset, meaning that it is considered a good investment during turbulent times. Gold is also widely seen as a hedge against inflation and against depreciating currencies as it doesn’t rely on any specific issuer or government.
Central banks are the biggest Gold holders. In their aim to support their currencies in turbulent times, central banks tend to diversify their reserves and buy Gold to improve the perceived strength of the economy and the currency. High Gold reserves can be a source of trust for a country’s solvency. Central banks added 1,136 tonnes of Gold worth around $70 billion to their reserves in 2022, according to data from the World Gold Council. This is the highest yearly purchase since records began. Central banks from emerging economies such as China, India and Turkey are quickly increasing their Gold reserves.
Gold has an inverse correlation with the US Dollar and US Treasuries, which are both major reserve and safe-haven assets. When the Dollar depreciates, Gold tends to rise, enabling investors and central banks to diversify their assets in turbulent times. Gold is also inversely correlated with risk assets. A rally in the stock market tends to weaken Gold price, while sell-offs in riskier markets tend to favor the precious metal.
The price can move due to a wide range of factors. Geopolitical instability or fears of a deep recession can quickly make Gold price escalate due to its safe-haven status. As a yield-less asset, Gold tends to rise with lower interest rates, while higher cost of money usually weighs down on the yellow metal. Still, most moves depend on how the US Dollar (USD) behaves as the asset is priced in dollars (XAU/USD). A strong Dollar tends to keep the price of Gold controlled, whereas a weaker Dollar is likely to push Gold prices up.
You have reached your limit of 5 free articles for this month.
Access all our articles, insights, and analysts.
Your coupon code
After posting strong gains in the previous week, EUR/USD opened lower to start the new week. The pair, however, managed to recover back above the key 1.0900 level during the European trading hours, erasing the bearish opening gap.
The table below shows the percentage change of Euro (EUR) against listed major currencies last 7 days. Euro was the strongest against the New Zealand Dollar.
| USD | EUR | GBP | JPY | CAD | AUD | NZD | CHF | |
|---|---|---|---|---|---|---|---|---|
| USD | -0.65% | -1.31% | -1.74% | -0.03% | -0.47% | 0.72% | -0.24% | |
| EUR | 0.65% | -0.47% | -0.78% | 0.93% | 0.34% | 1.71% | 0.75% | |
| GBP | 1.31% | 0.47% | -0.35% | 1.43% | 0.81% | 2.19% | 1.22% | |
| JPY | 1.74% | 0.78% | 0.35% | 1.74% | 1.32% | 2.67% | 1.58% | |
| CAD | 0.03% | -0.93% | -1.43% | -1.74% | -0.47% | 0.75% | -0.19% | |
| AUD | 0.47% | -0.34% | -0.81% | -1.32% | 0.47% | 1.37% | 0.40% | |
| NZD | -0.72% | -1.71% | -2.19% | -2.67% | -0.75% | -1.37% | -0.95% | |
| CHF | 0.24% | -0.75% | -1.22% | -1.58% | 0.19% | -0.40% | 0.95% |
The heat map shows percentage changes of major currencies against each other. The base currency is picked from the left column, while the quote currency is picked from the top row. For example, if you pick the Euro from the left column and move along the horizontal line to the US Dollar, the percentage change displayed in the box will represent EUR (base)/USD (quote).
News of an assassination attempt on former US President Donald Trump caused markets to adopt a cautious stance at the beginning of the week. At this point, it’s difficult to assess the potential impact of this development on markets in the near term. In any case, rising US stock index futures, which were last seen gaining between 0.45% and 0.55% on the day, point to an improving risk mood already.
In the second half of the day, Federal Reserve (Fed) Chairman Jerome Powell will speak at an event organized by the Economic Club of Washington.
Following the soft inflation data published last week, markets are nearly fully pricing in a 25 basis points Fed rate cut in September. Hence, the positioning suggests that the US Dollar does not have a lot of room left on the downside even if Powell sounds in favor of a rate reduction in September. Nevertheless, a dovish tilt in Powell’s tone could feed into expectations for a total of three 25 basis points rate cuts before the end of the year and still hurt the USD.
EUR/USD trades above 1.0900 after opening below this level. Once the pair confirms that level as support, it could target 1.0950 (static level) before 1.1000 (psychological level, static level). On the downside, 1.0850 (former resistance, static level) aligns as first support ahead of 1.0800 where the 100-day and the 200-day Simple Moving Averages (SMA) are located.
In the meantime, the Relative Strength Index (RSI) indicator on the 4-hour chart stays above 70, suggesting that EUR/USD could make a technical correction before the next leg higher.
The Euro is the currency for the 20 European Union countries that belong to the Eurozone. It is the second most heavily traded currency in the world behind the US Dollar. In 2022, it accounted for 31% of all foreign exchange transactions, with an average daily turnover of over $2.2 trillion a day. EUR/USD is the most heavily traded currency pair in the world, accounting for an estimated 30% off all transactions, followed by EUR/JPY (4%), EUR/GBP (3%) and EUR/AUD (2%).
The European Central Bank (ECB) in Frankfurt, Germany, is the reserve bank for the Eurozone. The ECB sets interest rates and manages monetary policy. The ECB’s primary mandate is to maintain price stability, which means either controlling inflation or stimulating growth. Its primary tool is the raising or lowering of interest rates. Relatively high interest rates – or the expectation of higher rates – will usually benefit the Euro and vice versa. The ECB Governing Council makes monetary policy decisions at meetings held eight times a year. Decisions are made by heads of the Eurozone national banks and six permanent members, including the President of the ECB, Christine Lagarde.
Eurozone inflation data, measured by the Harmonized Index of Consumer Prices (HICP), is an important econometric for the Euro. If inflation rises more than expected, especially if above the ECB’s 2% target, it obliges the ECB to raise interest rates to bring it back under control. Relatively high interest rates compared to its counterparts will usually benefit the Euro, as it makes the region more attractive as a place for global investors to park their money.
Data releases gauge the health of the economy and can impact on the Euro. Indicators such as GDP, Manufacturing and Services PMIs, employment, and consumer sentiment surveys can all influence the direction of the single currency. A strong economy is good for the Euro. Not only does it attract more foreign investment but it may encourage the ECB to put up interest rates, which will directly strengthen the Euro. Otherwise, if economic data is weak, the Euro is likely to fall. Economic data for the four largest economies in the euro area (Germany, France, Italy and Spain) are especially significant, as they account for 75% of the Eurozone’s economy.
Another significant data release for the Euro is the Trade Balance. This indicator measures the difference between what a country earns from its exports and what it spends on imports over a given period. If a country produces highly sought after exports then its currency will gain in value purely from the extra demand created from foreign buyers seeking to purchase these goods. Therefore, a positive net Trade Balance strengthens a currency and vice versa for a negative balance.
After posting strong gains in the previous week, EUR/USD opened lower to start the new week. The pair, however, managed to recover back above the key 1.0900 level during the European trading hours, erasing the bearish opening gap.
The table below shows the percentage change of Euro (EUR) against listed major currencies last 7 days. Euro was the strongest against the New Zealand Dollar.
| USD | EUR | GBP | JPY | CAD | AUD | NZD | CHF | |
|---|---|---|---|---|---|---|---|---|
| USD | -0.65% | -1.31% | -1.74% | -0.03% | -0.47% | 0.72% | -0.24% | |
| EUR | 0.65% | -0.47% | -0.78% | 0.93% | 0.34% | 1.71% | 0.75% | |
| GBP | 1.31% | 0.47% | -0.35% | 1.43% | 0.81% | 2.19% | 1.22% | |
| JPY | 1.74% | 0.78% | 0.35% | 1.74% | 1.32% | 2.67% | 1.58% | |
| CAD | 0.03% | -0.93% | -1.43% | -1.74% | -0.47% | 0.75% | -0.19% | |
| AUD | 0.47% | -0.34% | -0.81% | -1.32% | 0.47% | 1.37% | 0.40% | |
| NZD | -0.72% | -1.71% | -2.19% | -2.67% | -0.75% | -1.37% | -0.95% | |
| CHF | 0.24% | -0.75% | -1.22% | -1.58% | 0.19% | -0.40% | 0.95% |
The heat map shows percentage changes of major currencies against each other. The base currency is picked from the left column, while the quote currency is picked from the top row. For example, if you pick the Euro from the left column and move along the horizontal line to the US Dollar, the percentage change displayed in the box will represent EUR (base)/USD (quote).
News of an assassination attempt on former US President Donald Trump caused markets to adopt a cautious stance at the beginning of the week. At this point, it’s difficult to assess the potential impact of this development on markets in the near term. In any case, rising US stock index futures, which were last seen gaining between 0.45% and 0.55% on the day, point to an improving risk mood already.
In the second half of the day, Federal Reserve (Fed) Chairman Jerome Powell will speak at an event organized by the Economic Club of Washington.
Following the soft inflation data published last week, markets are nearly fully pricing in a 25 basis points Fed rate cut in September. Hence, the positioning suggests that the US Dollar does not have a lot of room left on the downside even if Powell sounds in favor of a rate reduction in September. Nevertheless, a dovish tilt in Powell’s tone could feed into expectations for a total of three 25 basis points rate cuts before the end of the year and still hurt the USD.
EUR/USD trades above 1.0900 after opening below this level. Once the pair confirms that level as support, it could target 1.0950 (static level) before 1.1000 (psychological level, static level). On the downside, 1.0850 (former resistance, static level) aligns as first support ahead of 1.0800 where the 100-day and the 200-day Simple Moving Averages (SMA) are located.
In the meantime, the Relative Strength Index (RSI) indicator on the 4-hour chart stays above 70, suggesting that EUR/USD could make a technical correction before the next leg higher.
The Euro is the currency for the 20 European Union countries that belong to the Eurozone. It is the second most heavily traded currency in the world behind the US Dollar. In 2022, it accounted for 31% of all foreign exchange transactions, with an average daily turnover of over $2.2 trillion a day. EUR/USD is the most heavily traded currency pair in the world, accounting for an estimated 30% off all transactions, followed by EUR/JPY (4%), EUR/GBP (3%) and EUR/AUD (2%).
The European Central Bank (ECB) in Frankfurt, Germany, is the reserve bank for the Eurozone. The ECB sets interest rates and manages monetary policy. The ECB’s primary mandate is to maintain price stability, which means either controlling inflation or stimulating growth. Its primary tool is the raising or lowering of interest rates. Relatively high interest rates – or the expectation of higher rates – will usually benefit the Euro and vice versa. The ECB Governing Council makes monetary policy decisions at meetings held eight times a year. Decisions are made by heads of the Eurozone national banks and six permanent members, including the President of the ECB, Christine Lagarde.
Eurozone inflation data, measured by the Harmonized Index of Consumer Prices (HICP), is an important econometric for the Euro. If inflation rises more than expected, especially if above the ECB’s 2% target, it obliges the ECB to raise interest rates to bring it back under control. Relatively high interest rates compared to its counterparts will usually benefit the Euro, as it makes the region more attractive as a place for global investors to park their money.
Data releases gauge the health of the economy and can impact on the Euro. Indicators such as GDP, Manufacturing and Services PMIs, employment, and consumer sentiment surveys can all influence the direction of the single currency. A strong economy is good for the Euro. Not only does it attract more foreign investment but it may encourage the ECB to put up interest rates, which will directly strengthen the Euro. Otherwise, if economic data is weak, the Euro is likely to fall. Economic data for the four largest economies in the euro area (Germany, France, Italy and Spain) are especially significant, as they account for 75% of the Eurozone’s economy.
Another significant data release for the Euro is the Trade Balance. This indicator measures the difference between what a country earns from its exports and what it spends on imports over a given period. If a country produces highly sought after exports then its currency will gain in value purely from the extra demand created from foreign buyers seeking to purchase these goods. Therefore, a positive net Trade Balance strengthens a currency and vice versa for a negative balance.
Research Briefing
| Jul 15, 2024
What you will learn:
To learn more about our price forecasts for base metals, precious metals, battery raw materials and soft commodities, please submit the form to download the full report.

Post
A recent assessment by the World Bank Group identified the Oxford Economics Model as a superior tool for forecasting commodity prices.

Post
Overall, we are slightly more bullish on commodity prices across the forecast horizon as we expect higher metal prices than the consensus.

Post
More frequent adverse supply shocks mean eurozone inflation is likely to be more volatile and possibly higher on average in the future. Food prices are a key channel through which these global shocks will be transmitted, according to our analysis. We provide a quantitative assessment of the impact of a wide range of supply shocks on eurozone inflation.