The main category of Forex News.
You can use the search box below to find what you need.
[wd_asp id=1]
The main category of Forex News.
You can use the search box below to find what you need.
[wd_asp id=1]
You have reached your limit of 5 free articles for this month.
Access all our articles, insights, and analysts.
Your coupon code
After gaining more than 1% in the previous week, EUR/USD started the new week with a bearish gap but managed to erase its losses. In the European trading hours, the pair holds steady above 1.0800.
The broad-based selling pressure surrounding the US Dollar allowed EUR/USD to extend its weekly rally on Friday. The Bureau of Labor Statistics (BLS) reported that Nonfarm Payrolls (NFP) rose 206,000 in June. Although this reading surpassed the market forecast of 190,000, the USD struggled to find demand as the report showed that the BLS revised the May’s NFP increase of 272,000 lower to 218,000. Furthermore, the Unemployment Rate ticked up to 4.1%, while the annual wage inflation softened to 3.9% from 4.1% in May, putting additional weight on the USD’s shoulders.
The table below shows the percentage change of Euro (EUR) against listed major currencies last 7 days. Euro was the strongest against the US Dollar.
| USD | EUR | GBP | JPY | CAD | AUD | NZD | CHF | |
|---|---|---|---|---|---|---|---|---|
| USD | -1.16% | -1.34% | 0.18% | -0.29% | -1.04% | -0.67% | -0.32% | |
| EUR | 1.16% | -0.42% | 1.05% | 0.57% | -0.00% | 0.19% | 0.54% | |
| GBP | 1.34% | 0.42% | 1.44% | 1.02% | 0.42% | 0.61% | 0.96% | |
| JPY | -0.18% | -1.05% | -1.44% | -0.45% | -1.15% | -0.83% | -0.46% | |
| CAD | 0.29% | -0.57% | -1.02% | 0.45% | -0.72% | -0.38% | -0.03% | |
| AUD | 1.04% | 0.00% | -0.42% | 1.15% | 0.72% | 0.19% | 0.62% | |
| NZD | 0.67% | -0.19% | -0.61% | 0.83% | 0.38% | -0.19% | 0.37% | |
| CHF | 0.32% | -0.54% | -0.96% | 0.46% | 0.03% | -0.62% | -0.37% |
The heat map shows percentage changes of major currencies against each other. The base currency is picked from the left column, while the quote currency is picked from the top row. For example, if you pick the Euro from the left column and move along the horizontal line to the US Dollar, the percentage change displayed in the box will represent EUR (base)/USD (quote).
The immediate reaction to the second round of French parliamentary election caused the Euro to lose some interest at the beginning of the week. The left-wing alliance New Popular Front won the second round of French election by securing 182 seats in the National Assembly but fell short of the 289 seats required to win a majority.
Meanwhile, the data from the Euro area showed that the Sentix Investor Confidence declined to -7.3 in July from 0.3%.
The US economic calendar will not offer any high-tier data releases on Monday. Federal Reserve (Fed) Chairman Jerome Powell will deliver the Semi-Annual Monetary Policy Report and testify before the Senate Banking Committee and House Financial Services Committee on Tuesday and Wednesday, respectively. Hence, investors could refrain from taking large positions.
1.0840 (Fibonacci 23.6% retracement of the latest uptrend) aligns as immediate resistance for EUR/USD. If the pair manages to clear that level and starts using it as support, 1.0900 (psychological level, static level) could be seen as next bullish target.
On the downside, the 100-day and the 200-day Simple Moving Averages form strong support at 1.0800. A daily close below this level could attract technical sellers and open the door for an extended correction toward 1.0760 (Fibonacci 50% reracement).
The Euro is the currency for the 20 European Union countries that belong to the Eurozone. It is the second most heavily traded currency in the world behind the US Dollar. In 2022, it accounted for 31% of all foreign exchange transactions, with an average daily turnover of over $2.2 trillion a day. EUR/USD is the most heavily traded currency pair in the world, accounting for an estimated 30% off all transactions, followed by EUR/JPY (4%), EUR/GBP (3%) and EUR/AUD (2%).
The European Central Bank (ECB) in Frankfurt, Germany, is the reserve bank for the Eurozone. The ECB sets interest rates and manages monetary policy. The ECB’s primary mandate is to maintain price stability, which means either controlling inflation or stimulating growth. Its primary tool is the raising or lowering of interest rates. Relatively high interest rates – or the expectation of higher rates – will usually benefit the Euro and vice versa. The ECB Governing Council makes monetary policy decisions at meetings held eight times a year. Decisions are made by heads of the Eurozone national banks and six permanent members, including the President of the ECB, Christine Lagarde.
Eurozone inflation data, measured by the Harmonized Index of Consumer Prices (HICP), is an important econometric for the Euro. If inflation rises more than expected, especially if above the ECB’s 2% target, it obliges the ECB to raise interest rates to bring it back under control. Relatively high interest rates compared to its counterparts will usually benefit the Euro, as it makes the region more attractive as a place for global investors to park their money.
Data releases gauge the health of the economy and can impact on the Euro. Indicators such as GDP, Manufacturing and Services PMIs, employment, and consumer sentiment surveys can all influence the direction of the single currency. A strong economy is good for the Euro. Not only does it attract more foreign investment but it may encourage the ECB to put up interest rates, which will directly strengthen the Euro. Otherwise, if economic data is weak, the Euro is likely to fall. Economic data for the four largest economies in the euro area (Germany, France, Italy and Spain) are especially significant, as they account for 75% of the Eurozone’s economy.
Another significant data release for the Euro is the Trade Balance. This indicator measures the difference between what a country earns from its exports and what it spends on imports over a given period. If a country produces highly sought after exports then its currency will gain in value purely from the extra demand created from foreign buyers seeking to purchase these goods. Therefore, a positive net Trade Balance strengthens a currency and vice versa for a negative balance.
After gaining more than 1% in the previous week, EUR/USD started the new week with a bearish gap but managed to erase its losses. In the European trading hours, the pair holds steady above 1.0800.
The broad-based selling pressure surrounding the US Dollar allowed EUR/USD to extend its weekly rally on Friday. The Bureau of Labor Statistics (BLS) reported that Nonfarm Payrolls (NFP) rose 206,000 in June. Although this reading surpassed the market forecast of 190,000, the USD struggled to find demand as the report showed that the BLS revised the May’s NFP increase of 272,000 lower to 218,000. Furthermore, the Unemployment Rate ticked up to 4.1%, while the annual wage inflation softened to 3.9% from 4.1% in May, putting additional weight on the USD’s shoulders.
The table below shows the percentage change of Euro (EUR) against listed major currencies last 7 days. Euro was the strongest against the US Dollar.
| USD | EUR | GBP | JPY | CAD | AUD | NZD | CHF | |
|---|---|---|---|---|---|---|---|---|
| USD | -1.16% | -1.34% | 0.18% | -0.29% | -1.04% | -0.67% | -0.32% | |
| EUR | 1.16% | -0.42% | 1.05% | 0.57% | -0.00% | 0.19% | 0.54% | |
| GBP | 1.34% | 0.42% | 1.44% | 1.02% | 0.42% | 0.61% | 0.96% | |
| JPY | -0.18% | -1.05% | -1.44% | -0.45% | -1.15% | -0.83% | -0.46% | |
| CAD | 0.29% | -0.57% | -1.02% | 0.45% | -0.72% | -0.38% | -0.03% | |
| AUD | 1.04% | 0.00% | -0.42% | 1.15% | 0.72% | 0.19% | 0.62% | |
| NZD | 0.67% | -0.19% | -0.61% | 0.83% | 0.38% | -0.19% | 0.37% | |
| CHF | 0.32% | -0.54% | -0.96% | 0.46% | 0.03% | -0.62% | -0.37% |
The heat map shows percentage changes of major currencies against each other. The base currency is picked from the left column, while the quote currency is picked from the top row. For example, if you pick the Euro from the left column and move along the horizontal line to the US Dollar, the percentage change displayed in the box will represent EUR (base)/USD (quote).
The immediate reaction to the second round of French parliamentary election caused the Euro to lose some interest at the beginning of the week. The left-wing alliance New Popular Front won the second round of French election by securing 182 seats in the National Assembly but fell short of the 289 seats required to win a majority.
Meanwhile, the data from the Euro area showed that the Sentix Investor Confidence declined to -7.3 in July from 0.3%.
The US economic calendar will not offer any high-tier data releases on Monday. Federal Reserve (Fed) Chairman Jerome Powell will deliver the Semi-Annual Monetary Policy Report and testify before the Senate Banking Committee and House Financial Services Committee on Tuesday and Wednesday, respectively. Hence, investors could refrain from taking large positions.
1.0840 (Fibonacci 23.6% retracement of the latest uptrend) aligns as immediate resistance for EUR/USD. If the pair manages to clear that level and starts using it as support, 1.0900 (psychological level, static level) could be seen as next bullish target.
On the downside, the 100-day and the 200-day Simple Moving Averages form strong support at 1.0800. A daily close below this level could attract technical sellers and open the door for an extended correction toward 1.0760 (Fibonacci 50% reracement).
The Euro is the currency for the 20 European Union countries that belong to the Eurozone. It is the second most heavily traded currency in the world behind the US Dollar. In 2022, it accounted for 31% of all foreign exchange transactions, with an average daily turnover of over $2.2 trillion a day. EUR/USD is the most heavily traded currency pair in the world, accounting for an estimated 30% off all transactions, followed by EUR/JPY (4%), EUR/GBP (3%) and EUR/AUD (2%).
The European Central Bank (ECB) in Frankfurt, Germany, is the reserve bank for the Eurozone. The ECB sets interest rates and manages monetary policy. The ECB’s primary mandate is to maintain price stability, which means either controlling inflation or stimulating growth. Its primary tool is the raising or lowering of interest rates. Relatively high interest rates – or the expectation of higher rates – will usually benefit the Euro and vice versa. The ECB Governing Council makes monetary policy decisions at meetings held eight times a year. Decisions are made by heads of the Eurozone national banks and six permanent members, including the President of the ECB, Christine Lagarde.
Eurozone inflation data, measured by the Harmonized Index of Consumer Prices (HICP), is an important econometric for the Euro. If inflation rises more than expected, especially if above the ECB’s 2% target, it obliges the ECB to raise interest rates to bring it back under control. Relatively high interest rates compared to its counterparts will usually benefit the Euro, as it makes the region more attractive as a place for global investors to park their money.
Data releases gauge the health of the economy and can impact on the Euro. Indicators such as GDP, Manufacturing and Services PMIs, employment, and consumer sentiment surveys can all influence the direction of the single currency. A strong economy is good for the Euro. Not only does it attract more foreign investment but it may encourage the ECB to put up interest rates, which will directly strengthen the Euro. Otherwise, if economic data is weak, the Euro is likely to fall. Economic data for the four largest economies in the euro area (Germany, France, Italy and Spain) are especially significant, as they account for 75% of the Eurozone’s economy.
Another significant data release for the Euro is the Trade Balance. This indicator measures the difference between what a country earns from its exports and what it spends on imports over a given period. If a country produces highly sought after exports then its currency will gain in value purely from the extra demand created from foreign buyers seeking to purchase these goods. Therefore, a positive net Trade Balance strengthens a currency and vice versa for a negative balance.
The overall result was a net gain of 5.68%, giving an average return of 1.14% per trade.
Last week’s key takeaways were:
There were a few other events last week which were of much lower significance to the market, at least in the near term:
Overall, there is a theme of declining inflation and slowing economies, which is broadly supportive of rate cuts.

The most important items over this coming week will be:
This month, I forecasted that the USD/JPY currency pair will increase in value.

Last week, I made no weekly forecast, as there were no unusually large swings in any Forex currency crosses, which is the basis of my weekly trading strategy. This week, there were some large directional movements in the AUD/JPY and GBP/JPY currency crosses, but I have little faith that these will reverse over the coming week, so I again make no forecast.
Directional volatility in the Forex market rose last week, with 27% of the most important currency pairs fluctuating by more than 1%.
Last week, the Australian Dollar was the strongest major currency, while the US Dollar was the weakest.
You can trade these forecasts in a real or demo Forex brokerage account.

The US Dollar Index printed large bearish candlestick last week, which closed very near the low of its range. These are signs suggesting short-term bearish momentum, as is the fact that the US Dollar was the worst-performing of all the major currencies last week. This analysis is reinforced by the fact that the price action was contained just below the descending trend line above, the horizontal resistance level at 105.80, and the round number at 106.00. This suggests that the price reversed after failing to make a bullish breakout beyond this area.
There is a bullish long-term trend as the price is above its levels from 3 months ago and its price of 6 months ago. However, this trend looks to be in danger. The price is now approaching a key support zone between 104.15 and 103.92, and if the price breaks below this zone this week, it will be a bearish sign.
The weaker Dollar has been driven by more dovish signals from the Federal Reserve last week, and some good news on global inflation. This week’s US CPI data will probably be crucial in determining what happens to the Dollar next.
I see the Dollar as a bit of a sideshow right now, at least until the CPI data release, with the Forex market currently driven by weakness in the Japanese Yen and strength in the Australian Dollar.

The USD/JPY currency pair printed a bearish pin candlestick last week, after making a new 38-year high, rejecting the resistance levels at ¥161.37 and ¥161.83.
The Japanese Yen has been showing a real long-term weakness as the Bank of Japan continues to stall in really changing its ultra-loose monetary policy. However, the US Dollar lost considerable ground last week, so the price change here over the week was slightly negative.
Long trades may work out well here over the coming week. However, bulls need to beware of potential sudden intervention by the Bank of Japan or profit-taking when key psychological levels such as ¥162.00 or the high just below that are reached.
As a trend trader, I am only happy to enter a long trade in this currency pair after we see a daily close above ¥162.00 which would show renewed bullish momentum trading in blue sky.

I expected that the AUD/JPY currency would rise last week, and it did, continuing its long-term bullish trend as it reaches new long-term high prices. It is worth noting that the Australian Dollar was the strongest major currency last week and has consistently gained over the past year against other currencies, so it is showing a bullish long-term trend and is in focus.
On the other side of this currency cross, the Japanese yen is weak, which is arguably the major defining feature of the Forex market right now.
These are good reasons to be long of this currency cross – both the short-term momentum, best of momentum, and the long-term trends in the market all support taking this position. I see this cross as a buy.

The EUR/JPY currency cross rose quite strongly during the week, continuing its strong long-term bullish trend as it reached new long-term high prices. Interestingly, the Euro performed quite well last week possibly as polling suggests the National Rally party will fail to secure an overall majority in France in the election today, although deadlock will bring its own problems.
The Japanese yen is weak, which is the major defining feature of the Forex market right now. This is a good reason to be short of the Japanese Yen. As the Euro is showing some momentum, this cross may be a good one to use to try to exploit that, or at least to include within a short Yen basket.

The GBP/JPY currency cross rose very strongly last week, continuing its long-term bullish trend as it reached new long-term high prices. The British Pound is one of the best-performing currencies over both the long and short term and may have received a boost from the very decisive UK election result at the end of last week, which may ensure the UK has a firmer and more effective government.
The Japanese yen is weak, which is the major defining feature of the Forex market right now. This is a good reason to be short of the Japanese Yen. As the British Pound is showing some bullish momentum, this cross may be a good one to exploit over the coming week.

The GBP/USD currency pair advanced quite strongly last week, with the British Pound in a long-term bullish trend and also showing short-term bullish momentum, possibly helped by the UK election result last week which may bring a firmer and more settled government. Markets did not react negatively to the election result.
The price ended the week at a 3-month highest daily close, which is a bullish sign in itself. The weekly close was also near the high of the week’s range, which is a bullish sign.
The signs are bullish, but I would like to see a strongly bullish daily close above $1.2905 before entering any new long trade here.

The AUD/USD currency pair advanced strongly last week to reach a new 6-month high. This pair is in focus as the Australian Dollar was again the best performing major currency over the week, while the US Dollar was the worst.
The rise in price here got a tailwind from some dovish rhetoric which came from the US Federal Reserve last week, which boosted risk-on sentiment and therefore the Aussie, while it also sent the US Dollar lower, after it was unable to overcome technical resistance.
The signs are bullish, but a look at the weekly price chart below shows that there could be strong resistance in the $0.6850 area, where there was a strongly bearish inflection the last time it was reached.

The NASDAQ 100 Index reached a new all-time high last week after rising very strongly on Friday well above the huge round number of 20,000. The price closed not far from the high of the week’s range. These are very bullish signs.
It makes sense to be bullish on this major stock market index when it has recently made a new record high. Historical precedent shows this tends to produce further gains quickly. Added to this, the NASDAQ 100 has returned an average gain of 15% since it was launched in 1985.
I, therefore, see the NASDAQ 100 Index as a buy right now.

The S&P 500 Index reached a new all-time high last week after rising very strongly on Friday well above the round number of 5,500. The price closed very near the high of the week’s range. These are very bullish signs.
It makes sense to be bullish on this major stock market index when it has recently made a new record high. Historical precedent shows this tends to produce further gains quickly, typically of about 12% over the next year.
I, therefore, see the S&P 500 100 Index as a buy right now.

I see the best trading opportunities this week as follows:
Ready to trade our Forex weekly forecast? We’ve shortlisted the top Forex brokers for you to check out.
Is the weakness of the Japanese Yen affecting private consumption and the Japanese economy?
In June, Bank of Japan Deputy Governor Ryozo Himino discussed the impact of Yen weakness on the economy, saying,
“Exchange-rate fluctuations affect economic activity in various ways. It also affects inflation in a broad-based and sustained way, beyond the direct impact on import prices.”
Notably, the BoJ has remained silent on monetary policy goals after the USD/JPY spiked at a July 3 high of $161.951.
Meanwhile, US inflation remains a focal point as investors raise bets on a September Fed rate cut.
Will US consumer inflation expectations draw the interest of the Fed?
Later in the session on Monday, consumer inflation expectation numbers could increase investor expectations of a September Fed rate cut.
Economists forecast consumer inflation expectations to ease from 3.2% in May to 3.0% in June.
The Fed considers consumer inflation expectations a predictor of future inflation trends. Expectations of softer inflation could signal a pullback in consumer spending on easing fear of higher prices in the future. Downward consumer spending trends may dampen demand-driven inflation and allow the Fed to cut interest rates.
For context, consumer inflation expectations trended downward until an unexpected upswing in April. Consumer inflation expectations peaked at 6.8% in June 2022 before dropping below 4% in May 2023.
The technical analysis for the EUR/USD pair is about as flat as it gets, because quite frankly even though we have broken above the 200-Day EMA, as well as the 50-Day EMA indicator, it’s worth noting that both of those indicators are flat. We did break above the 1.08 level, and that of course is a large, round, psychologically significant figure that a lot of people will be looking at. However, I don’t necessarily think that it’s a major influence, and if we can continue to go higher, we may find something a little bit more significant in the form of the 1.09 level is concerned, as it had previously been resistance.
On the other hand, if we were to break down below the moving averages, then it opens up the possibility of a move down to the 1.07 level. The 1.07 level has offered significant support multiple times, and therefore I think you have got a situation where it probably carries quite a bit more weight than the 1.08 level also.
Keep in mind that the currency pair has to look at the pair through the prism of 2 central bank that simply have nowhere to be or nothing to do. The ECB has of course offered an interest rate cut recently, but now people are wondering whether or not the Federal Reserve will continue to do the same going forward. I think at this point in time, you have a lot of nonsensical noisy and choppy behavior ahead.
Ready to trade our Forex daily analysis and predictions? Here are the best European brokers to choose from.
(MENAFN– Daily Forex) Fundamental Analysis & market Sentiment
I wrote on 30th June that the best trade opportunities for the week were likely to be:
Long of USD/JPY currency pair . This produced a gain of 0.63%.
Long of the AUD/JPY currency cross . This produced a gain of 2.25%.
Long of the CAD/JPY currency cross . This produced a gain of 1.03%.
Long of the nasdaq 100 index following a daily close above 20,000. This set up on Tuesday’s close and produced a gain at the end of the week of 1.77%.The overall result was a net gain of 5.68%, giving an average return of 1.14% per trade.Last week’s key takeaways were:
US Non-Farm Payrolls and Average Hourly Earnings data came in on Friday more or less as expected, showing the pace of increase of average hourly earnings is slowing, although the unemployment rate was slightly higher than expected at 4.1%. Stock markets reacted positively, sending the major US equity indices firmly higher to close at new all-time highs.
On Tuesday Fed Chair Powell stated that the rate of inflation is trending downwards, which also created more dovish expectations from the Federal Reserve, which began an upwards move in stock markets that took on even more momentum on Friday.
The Eurozone Flash CPI Estimate was mixed, showing the headline annualized rate is likely to fall from 2.9% to 2.8%, but at the same time it showed an uptick in the Core rate.There were a few other events last week which were of much lower significance to the market, at least in the near term:
French Parliamentary Election Second Round – polling suggests that the far-right National Rally, the winner of the first round, will fail to win a Parliamentary majority in today’s run-off election. The centrist and far-left parties are collaborating in tactical withdrawals of candidates to try to stop the National Rally.
British General Election – the opposition Labour Party won a landslide victory, albeit with a relatively small share of the vote of only 34%. Anti-immigration and far left parties won almost as much, as did the Conservative and Reform Party votes taken together. There were some ugly examples of communal politics with Islamist candidates winning a few seats. Turnout was relatively low. The Labour victory was expected by the market and had little impact upon the British Pound or British stock market.
FOMC Meeting Minutes were released from the last Fed meeting. They had little impact.
US New Home Sales – came in just slightly below expectations.
German Preliminary CPI – came in below expectations at a month-on-month increase of only 0.1%.
Swiss CPI – came in below expectations at zero month-on-month change.
Chinese Manufacturing PMI – met expectations.
US ISM Manufacturing PMI – below expectations, suggesting a slowing US economy.
US ISM Services PMI – below expectations, suggesting a slowing US economy.
US Unemployment Claims – met expectations.
Canadian Unemployment Rate – slightly higher than expected.Overall, there is a theme of declining inflation and slowing economies, which is broadly supportive of rate cuts.Top Forex Brokers
1 Get Started 74% of retail CFD accounts lose money
The Week Ahead: 8th – 12th JulyThe most important items over this coming week will be:
US CPI.
Fed Chair Powell testifies before Congress about monetary policy.
US PPI.
Prelim UoM Consumer Sentiment Reserve Bank of New Zealand Official Cash Rate and Rate Statement.
Swiss CPI.
UK GDP.
US Unemployment Claims Forecast July 2024 This month, I forecasted that the USD/JPY currency pair will increase in value. Weekly Forecast 7th July 2024Last week, I made no weekly forecast, as there were no unusually large swings in any Forex currency crosses, which is the basis of my weekly trading strategy. This week, there were some large directional movements in the AUD/JPY and GBP/JPY currency crosses, but I have little faith that these will reverse over the coming week, so I again make no forecast.Directional volatility in the Forex market rose last week, with 27% of the most important currency pairs fluctuating by more than 1%.Last week, the Australian Dollar was the strongest major currency, while the US Dollar was the weakest.You can trade these forecasts in a real or demo Forex brokerage account .Key Support/Resistance Levels for Popular Pairs Technical AnalysisUS Dollar IndexThe US Dollar Index printed large bearish candlestick last week, which closed very near the low of its range. These are signs suggesting short-term bearish momentum, as is the fact that the US Dollar was the worst-performing of all the major currencies last week. This analysis is reinforced by the fact that the price action was contained just below the descending trend line above, the horizontal resistance level at 105.80, and the round number at 106.00. This suggests that the price reversed after failing to make a bullish breakout beyond this area.There is a bullish long-term trend as the price is above its levels from 3 months ago and its price of 6 months ago. However, this trend looks to be in danger. The price is now approaching a key support zone between 104.15 and 103.92, and if the price breaks below this zone this week, it will be a bearish sign.The weaker Dollar has been driven by more dovish signals from the Federal Reserve last week, and some good news on global inflation. This week’s US CPI data will probably be crucial in determining what happens to the Dollar next.I see the Dollar as a bit of a sideshow right now, at least until the CPI data release, with the Forex market currently driven by weakness in the Japanese Yen and strength in the Australian Dollar. USD/JPYThe USD/JPY currency pair printed a bearish pin candlestick last week, after making a new 38-year high, rejecting the resistance levels at ¥161.37 and ¥161.83.The Japanese Yen has been showing a real long-term weakness as the Bank of Japan continues to stall in really changing its ultra-loose monetary policy. However, the US Dollar lost considerable ground last week, so the price change here over the week was slightly negative.Long trades may work out well here over the coming week. However, bulls need to beware of potential sudden intervention by the Bank of Japan or profit-taking when key psychological levels such as ¥162.00 or the high just below that are reached.As a trend trader, I am only happy to enter a long trade in this currency pair after we see a daily close above ¥162.00 which would show renewed bullish momentum trading in blue sky. AUD/JPYI expected that the AUD/JPY currency would rise last week, and it did, continuing its long-term bullish trend as it reaches new long-term high prices. It is worth noting that the Australian Dollar was the strongest major currency last week and has consistently gained over the past year against other currencies, so it is showing a bullish long-term trend and is in focus.On the other side of this currency cross, the Japanese yen is weak, which is arguably the major defining feature of the Forex market right now.These are good reasons to be long of this currency cross – both the short-term momentum, best of momentum, and the long-term trends in the market all support taking this position. I see this cross as a buy. EUR/JPYThe EUR/JPY currency cross rose quite strongly during the week, continuing its strong long-term bullish trend as it reached new long-term high prices. Interestingly, the Euro performed quite well last week possibly as polling suggests the National Rally party will fail to secure an overall majority in France in the election today, although deadlock will bring its own problems.The Japanese yen is weak, which is the major defining feature of the Forex market right now. This is a good reason to be short of the Japanese Yen. As the Euro is showing some momentum, this cross may be a good one to use to try to exploit that, or at least to include within a short Yen basket. GBP/JPYThe GBP/JPY currency cross rose very strongly last week, continuing its long-term bullish trend as it reached new long-term high prices. The British Pound is one of the best-performing currencies over both the long and short term and may have received a boost from the very decisive UK election result at the end of last week, which may ensure the UK has a firmer and more effective government.The Japanese yen is weak, which is the major defining feature of the Forex market right now. This is a good reason to be short of the Japanese Yen. As the British Pound is showing some bullish momentum, this cross may be a good one to exploit over the coming week. GBP/USDThe GBP/USD currency pair advanced quite strongly last week, with the British Pound in a long-term bullish trend and also showing short-term bullish momentum, possibly helped by the UK election result last week which may bring a firmer and more settled government. Markets did not react negatively to the election result.The price ended the week at a 3-month highest daily close, which is a bullish sign in itself. The weekly close was also near the high of the week’s range, which is a bullish sign.The signs are bullish, but I would like to see a strongly bullish daily close above $1.2905 before entering any new long trade here. AUD/USDThe AUD/USD currency pair advanced strongly last week to reach a new 6-month high. This pair is in focus as the Australian Dollar was again the best performing major currency over the week, while the US Dollar was the worst.The rise in price here got a tailwind from some dovish rhetoric which came from the US Federal Reserve last week, which boosted risk-on sentiment and therefore the Aussie, while it also sent the US Dollar lower, after it was unable to overcome technical resistance.The signs are bullish, but a look at the weekly price chart below shows that there could be strong resistance in the $0.6850 area, where there was a strongly bearish inflection the last time it was reached. NASDAQ 100 IndexThe NASDAQ 100 Index reached a new all-time high last week after rising very strongly on Friday well above the huge round number of 20,000. The price closed not far from the high of the week’s range. These are very bullish signs.It makes sense to be bullish on this major stock market index when it has recently made a new record high. Historical precedent shows this tends to produce further gains quickly. Added to this, the NASDAQ 100 has returned an average gain of 15% since it was launched in 1985.I, therefore, see the NASDAQ 100 Index as a buy right now. S&P 500 IndexThe S&P 500 Index reached a new all-time high last week after rising very strongly on Friday well above the round number of 5,500. The price closed very near the high of the week’s range. These are very bullish signs.It makes sense to be bullish on this major stock market index when it has recently made a new record high. Historical precedent shows this tends to produce further gains quickly, typically of about 12% over the next year.I, therefore, see the S&P 500 100 Index as a buy right now. Bottom LineI see the best trading opportunities this week as follows:
Long of the USD/JPY currency pair following a daily close above ¥162.00.
Long of the AUD/JPY currency cross.
Long of the EUR/JPY currency cross.
Long of the GBP/JPY currency cross.
Long of the NASDAQ 100 Index.
Long of the S&P 500 Index.Ready to trade our Forex weekly forecast ? We’ve shortlisted the top Forex brokers for you to check out.MENAFN07072024000131011023ID1108414779
So far, the correction down from the 3.16 peak (A) has seen the price of natural gas decline by 0.86 cents or 26.7%. How does that compare with prior bearish corrections? Since the initial February 2023 trend bottom there have been five corrections with a decline of greater than 20% and three that saw drops of more than 26%. Those three corrections were 55.1%, 38.7%, and 35.7%.
Given the history, since a 26% decline has already been exceeded as well as the support zone, the potential of a minimum 35.7% has become more likely. This does not mean that it will happen, but the chance for it to happen has increased. If natural gas reaches 2.03 it will have dropped by 35.7% from the most recent swing high. That will be a pivot zone to watch if it gets that low.
In the bigger picture the bears dominate as there remains a series of lower swing lows and lower swing highs on the chart. That pattern will remain unless there is a rally above the most recent swing high of 3.16, followed by a daily close above it to confirm strength. From the February bottom, the first upside breakout triggered on a move above the top of a symmetrical triangle bottom at 2.00. If a roundtrip is in process, the area around 2.00 could be tested as support given its significance initially as resistance. Of course, that would also more than match a 35.7% price correction.
For a look at all of today’s economic events, check out our economic calendar.
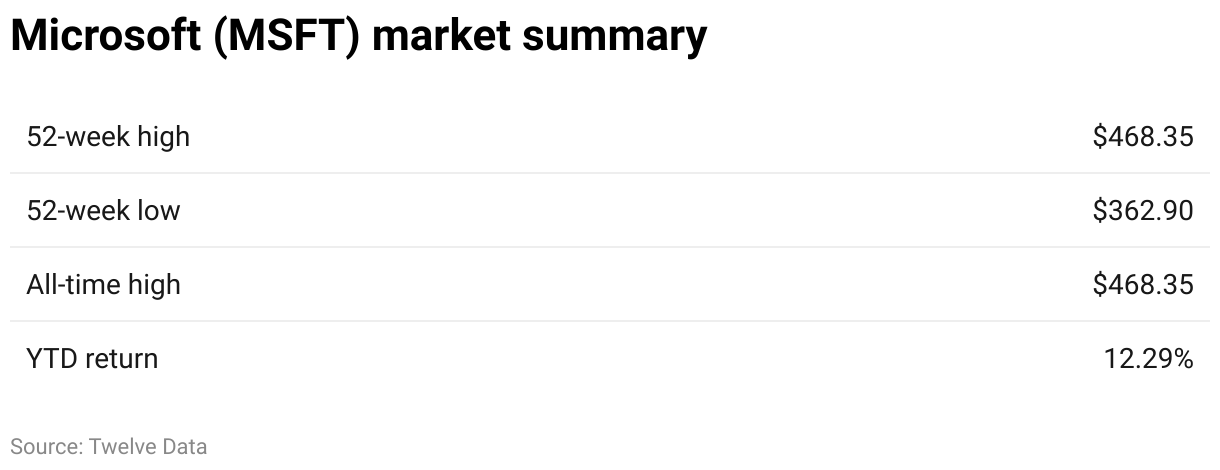
Microsoft has been publicly traded for almost 40 years. Its stock has risen consistently, reaching a $1 trillion market cap in 2019. Today, the tech giant has a market cap of more than $3 trillion.
Here’s what you need to know about MSFT stock.
Microsoft is one of the original tech giants. Its stock has had decades to weather various storms.
Take the turn of the 21st century, for example. On a split-adjusted basis, MSFT climbed as high as $59.97 in December 1999 during the dot-com bubble. But it dropped as low as $14.87 in 2009 during the Great Recession. It took the stock nearly 17 years to return to its dot-com bubble highs in October 2016.
Since then, it has been on a tear. Shares reached nearly $350 in late 2021. The 2022 tech sector sell-off dropped the stock price to under $215. It rallied in 2023, hitting above $384 per share in November. The climb continued in 2024, with MSFT reaching a split-adjusted high of $446.50 on June 17, 2024.
The average target among 58 Wall Street analysts covering MSFT is $485.82.
MSFT has performed very well since its 1986 initial public offering.
Over the past 20 years ending June 13, Microsoft shares have generated returns of more than 1,400%.
Microsoft has increased its earnings over time. For fiscal 2023, revenue was $211.9 billion, up 7% from the previous year. Net income was $73.3 billion, a 6% increase. Gross margin increased $10.4 billion, or roughly 8%.
Research and development costs also increased by over $2.6 billion. Operating expenses increased by $5.3 billion, or 10%. Microsoft cited factors such as employee severance packages, acquisitions, investments in cloud engineering and LinkedIn.
Microsoft maintains a consistent net profit, with margins above 35% in the past four quarters. After seeing a decline in its cash and cash equivalents in 2021 and 2022, those figures increased in 2023.
In its early days, Microsoft focused on developing an operating system for IBM. The system, MS-DOS, was released in 1981 with IBM’s first personal computer. By the early 1990s, Microsoft had sold over 100 million copies of MS-DOS. It released its groundbreaking Windows operating system in 1985. But Windows didn’t gain traction until the 1990s.
Over the next 20 years, the company focused on shifting its business to a subscription model. It invested in its cloud services segment and expanded its presence in the gaming market.
Microsoft acquired the video collaboration application Skype in 2011. In 2016, it added LinkedIn to its portfolio. In 2020, the company bought game developer and publisher ZeniMax. It acquired cloud and artificial intelligence software company Nuance Communications the following year. In 2022, it bought Activision Blizzard, maker of “Call of Duty” and “World of Warcraft.”
The tech giant made a big splash in the AI world in 2019 when it invested $1 billion in ChatGPT maker OpenAI. That same year, it secured a deal with OpenAI to build Azure AI technologies. Microsoft announced another $10 billion investment in OpenAI in January 2023. About a month later, it integrated OpenAI technology into its Bing search engine.
Microsoft has been the subject of several controversies. In the late 1990s, the Department of Justice brought an antitrust lawsuit against the company. It alleged that Microsoft held monopoly power, citing its dominant PC market share and a high barrier to entry. As a result, customers lacked viable alternatives to Windows. The two parties later reached a settlement that restricted Microsoft’s conduct.
Microsoft has been criticized for its labor practices. In 2000, it paid $97 million to settle a lawsuit brought by temporary workers denied benefits.
The tech giant has also been accused of using its complex corporate structure to avoid paying taxes.
Microsoft is the subject of the largest audit in IRS history. The agency says the company owes $28.9 billion in back taxes, plus penalties and interest. Microsoft disputes that figure.
With an initial public offering in 1986, MSFT was priced at $21 per share. The company netted a valuation of $777 million. Before the close of the first trading day, shares reached $35.50. About 2.5 million shares were sold that day, raising $61 million.
During the IPO, co-founder Bill Gates, then 30 years old, sold $1.6 million in shares. He retained a 45% stake worth $350 million.
Purchasing MSFT during its IPO was one of the best investments of the 1990s. At the height of the dot-com bubble in 2000, its market cap reached nearly $600 billion.
The company’s most recent stock split was a 2-for-1 split in February 2003. The stock has split nine times. Today, a single share of Microsoft’s IPO stock represents 288 shares.
Microsoft is well positioned to continue outperforming. But it faces several potential stumbling blocks.
Public cloud computing is one of the largest growth markets in the tech world. Microsoft’s Azure is a leading provider in that market. The Microsoft 365 productivity software suite creates upselling opportunities and tremendous cash flow. This can help the company invest in Azure and other growth initiatives. A ChatGPT service is now on the market as ChatGPT Azure OpenAI Service. Microsoft’s relationship with OpenAI could give it a first-mover advantage in AI technology.
Unfortunately, Microsoft Office is a mature product and likely has limited growth opportunities. The company also faces competition for cloud services from other tech companies, such as Amazon.com (AMZN) and Alphabet (GOOG).
Developing AI technology is expensive. But Microsoft risks falling behind Google’s Gemini and other AI leaders if it doesn’t stay on the cutting edge of development.
MSFT is one of the top stocks in the Nasdaq composite index, with a weight of 11.78% as of March 28, 2024.
The table below orders the 10 stocks with the greatest weighting in the Nasdaq by market cap. It’s reordered daily at market close.
Analysts are generally optimistic about Microsoft’s business and stock price in 2024. The analysts covering MSFT project full-year adjusted earnings per share of $11.80 in fiscal 2024.
Microsoft’s fiscal 2024 already looks rosy. The company reported 20% net income growth in its fiscal third quarter. Revenue was $61.9 billion, increasing by 17%.
Microsoft’s revenue is expected to grow in 2025, with an average estimated $280.03 billion. That represents about a 14.3% increase from the 2024 estimate. Earnings are also expected to grow, with an estimated $13.27 per share in 2025.
AI technology is the biggest wild card for Microsoft investors in the next several years. The company is off to a strong start with its initial wave of AI product launches and investment in OpenAI.
Investors should monitor how the company integrates Activision Blizzard into its gaming business and its long-term strategy for the gaming segment.
The provided chart illustrates WTI crude’s bullish trend since June. The price has broken through several key resistance levels, including the $80.22 mark. The current price of $83.16 is approaching the next significant resistance at $86.24. A breakthrough could potentially push prices towards the $92.02 level, which represents a major resistance point from September-October 2023.
This week’s primary price driver was a significant reduction in U.S. crude inventories. Weekly data showed a 12.2 million barrel decrease in crude stocks and a 2.2 million barrel drop in gasoline inventories. The American Petroleum Institute reported an even larger weekly crude inventory draw of 9.163 million barrels, surpassing analysts’ expectations.
The American Automobile Association’s forecast of a 5.2% increase in Independence Day travel compared to last year supports the bullish sentiment for this week’s gasoline demand. This aligns with analysts’ predictions of a tighter market in the coming weeks as summer fuel consumption rises.
This week saw Middle East tensions reintroduce a geopolitical risk premium to oil prices. Meanwhile, OPEC+ continues to support prices through production cuts, despite slight output increases from Nigeria and Iran in June.
Recent weeks have witnessed hedge funds and money managers increasing their petroleum purchases, moving from bearishness to a more neutral stance. This shift provided additional support to this week’s prices.
Looking ahead, UBS projects global oil demand growth of 1.5 million barrels per day this year. Both UBS and JPMorgan have set Brent crude price targets at $90 per barrel in the coming months, with UBS expecting this level to be reached this quarter.
I do get asked short term analysis all the time about natural gas, but the reality is, unless you know transmission, uh, rates in the United States through the lines, weather patterns in the Northeastern United States and a whole litany of geopolitical issues, you really don’t have much of a chance trying to figure out what the next day or two is going to be.
Granted, we could bounce to the $2.50 level and that would not surprise me at all. But I also think that could offer a little bit of resistance. Either way, this is a market that I think you need to build up a position. This is a swing trader’s market, not a scalper’s market.
For a look at all of today’s economic events, check out our economic calendar.