The main category of Forex News.
You can use the search box below to find what you need.
[wd_asp id=1]
The main category of Forex News.
You can use the search box below to find what you need.
[wd_asp id=1]
The USD/JPY price analysis leans south as the yen pulls away from its 38-year low, strengthening for the second session. On the other hand, the dollar was fragile as investors eagerly awaited the US nonfarm payrolls report.
–Are you interested in learning more about forex conventions? Check our detailed guide-
For the first time in over a month, the yen is gaining against the dollar. However, the risk of intervention remains high. The currency has lost 12% of its value since the beginning of the year. Traders sold the yen and bought the dollar due to the wide gap in rates between the US and Japan.
Although the BoJ has started its rate-hiking cycle, the future remains bleak. Consumption in Japan remains weak, and a fragile economy complicates the outlook for a rate hike. Therefore, investors have continued selling the yen. This pushed the BoJ to intervene in the market twice. However, the impact was only temporary, as the decline later continued.
Japan’s Finance Minister repeated his usual warning on Friday, saying Japan will keep a close eye on financial markets.
Meanwhile, after a week of downbeat economic data, the dollar was bruised on Friday. The US economy is slowing down, and employment and business activity data confirmed this. Consequently, markets have raised the likelihood of a September Fed rate cut to 73%. However, this might change with the upcoming monthly employment figures. If the US adds fewer jobs than expected, rate cut expectations will rise. The reverse is also true.
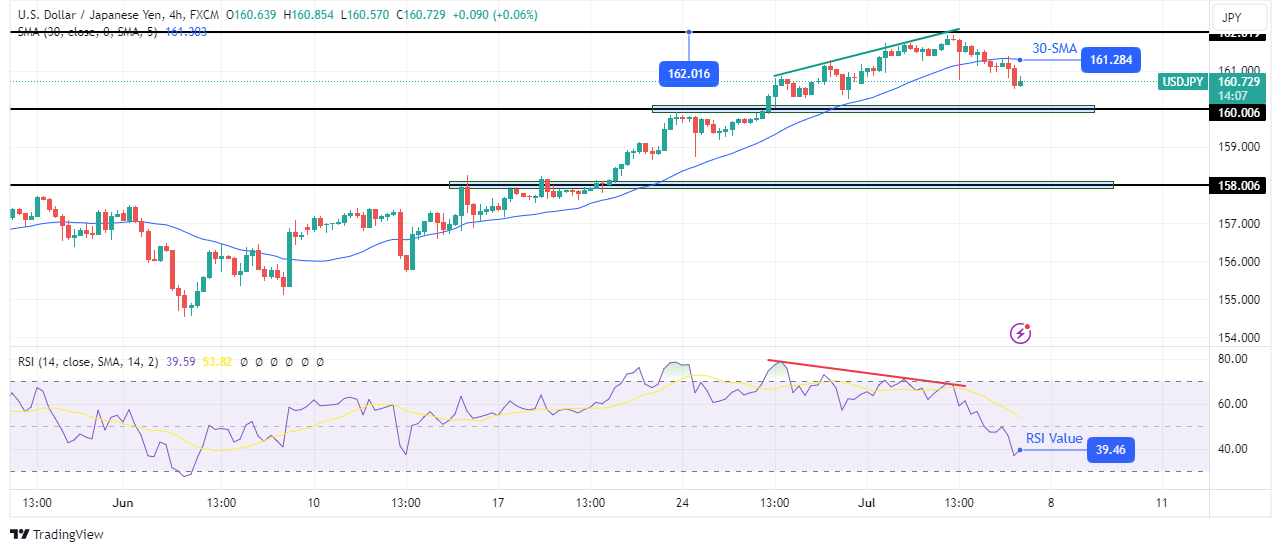
On the technical side, the USD/JPY price has broken below the 30-SMA for the time in many weeks. The break indicates a shift in sentiment from bullish to bearish. At the same time, the RSI has dipped into bearish territory below 50, suggesting strong downside momentum.
–Are you interested in learning more about Ethereum price prediction? Check our detailed guide-
Bulls got exhausted as the price approached the 162.01 key level. Notably, the RSI made a bearish divergence, highlighting weaker bullish momentum. This allowed bears to take charge by pushing the price below the 30-SMA. The path is now clear for the price to revisit support levels like 160.00 and 158.00.
Looking to trade forex now? Invest at eToro!
68% of retail investor accounts lose money when trading CFDs with this provider. You should consider whether you can afford to take the high risk of losing your money.
You have reached your limit of 5 free articles for this month.
Access all our articles, insights, and analysts.
Your coupon code
EUR/USD edged slightly higher and closed in positive territory above 1.0800 on Thursday. The pair holds its ground early Friday as market focus shifts to June labor market data from the US.
Following the Independence Day holiday in the US, the US Dollar (USD) stays on the back foot and helps EUR/USD hold its ground.
The table below shows the percentage change of Euro (EUR) against listed major currencies this week. Euro was the strongest against the US Dollar.
| USD | EUR | GBP | JPY | CAD | AUD | NZD | CHF | |
|---|---|---|---|---|---|---|---|---|
| USD | -1.06% | -1.05% | -0.03% | -0.50% | -0.99% | -0.41% | -0.01% | |
| EUR | 1.06% | -0.21% | 0.75% | 0.27% | -0.03% | 0.35% | 0.75% | |
| GBP | 1.05% | 0.21% | 0.94% | 0.48% | 0.18% | 0.57% | 0.98% | |
| JPY | 0.03% | -0.75% | -0.94% | -0.47% | -0.89% | -0.38% | 0.05% | |
| CAD | 0.50% | -0.27% | -0.48% | 0.47% | -0.45% | 0.09% | 0.49% | |
| AUD | 0.99% | 0.03% | -0.18% | 0.89% | 0.45% | 0.39% | 0.87% | |
| NZD | 0.41% | -0.35% | -0.57% | 0.38% | -0.09% | -0.39% | 0.43% | |
| CHF | 0.01% | -0.75% | -0.98% | -0.05% | -0.49% | -0.87% | -0.43% |
The heat map shows percentage changes of major currencies against each other. The base currency is picked from the left column, while the quote currency is picked from the top row. For example, if you pick the Euro from the left column and move along the horizontal line to the US Dollar, the percentage change displayed in the box will represent EUR (base)/USD (quote).
Nonfarm Payrolls in the US are forecast to rise 190,000 in June following the impressive 272,000 increase recorded in May, while the Unemployment Rate is seen staying unchanged at 4%.
The steady increase in the weekly Initial Jobless Claims data throughout June and disappointing ISM Manufacturing and Services PMI reports, which showed a contraction in these sectors’ payrolls in June, pointed to loosening conditions in the labor market.
In case the NFP arrives at around 150,000 or lower, the US Dollar could stay under selling pressure heading into the weekend and allow EUR/USD to extend its weekly rally. According to the CME FedWatch Tool, markets are currently pricing in a 25% probability of the Federal Reserve leaving the policy rate unchanged in September. Hence, the market positioning suggests that the USD has more room on the downside in case investors continue to price in a September rate cut on a weak jobs report.
On the other hand, a strong increase in NFP, more than 220,000, could cause investors to reassess the timing of the Fed’s policy pivot and trigger a downward correction in EUR/USD in the American session.
The Relative Strength Index (RSI) indicator on the 4-hour chart rose above 70 on Friday. Although this development suggests that EUR/USD is technically overbought, buyers could look to dominate the action as long as 1.0800 (100-day Simple Moving Average (SMA), 200-day SMA) stays intact as support. On the upside, 1.0840 (Fibonacci 23.6% retracement of the latest uptrend) could be seen as interim resistance before 1.0900 (psychological level, static level).
If EUR/USD drops below 1.0800 and fails to reclaim this level, supports could be seen at 1.0760 (Fibonacci 50% retracement) and 1.0730-1.0740 (Fibonacci 61.8% retracement, 20-day SMA).
Nonfarm Payrolls (NFP) are part of the US Bureau of Labor Statistics monthly jobs report. The Nonfarm Payrolls component specifically measures the change in the number of people employed in the US during the previous month, excluding the farming industry.
The Nonfarm Payrolls figure can influence the decisions of the Federal Reserve by providing a measure of how successfully the Fed is meeting its mandate of fostering full employment and 2% inflation. A relatively high NFP figure means more people are in employment, earning more money and therefore probably spending more. A relatively low Nonfarm Payrolls’ result, on the either hand, could mean people are struggling to find work. The Fed will typically raise interest rates to combat high inflation triggered by low unemployment, and lower them to stimulate a stagnant labor market.
Nonfarm Payrolls generally have a positive correlation with the US Dollar. This means when payrolls’ figures come out higher-than-expected the USD tends to rally and vice versa when they are lower. NFPs influence the US Dollar by virtue of their impact on inflation, monetary policy expectations and interest rates. A higher NFP usually means the Federal Reserve will be more tight in its monetary policy, supporting the USD.
Nonfarm Payrolls are generally negatively-correlated with the price of Gold. This means a higher-than-expected payrolls’ figure will have a depressing effect on the Gold price and vice versa. Higher NFP generally has a positive effect on the value of the USD, and like most major commodities Gold is priced in US Dollars. If the USD gains in value, therefore, it requires less Dollars to buy an ounce of Gold. Also, higher interest rates (typically helped higher NFPs) also lessen the attractiveness of Gold as an investment compared to staying in cash, where the money will at least earn interest.
Nonfarm Payrolls is only one component within a bigger jobs report and it can be overshadowed by the other components. At times, when NFP come out higher-than-forecast, but the Average Weekly Earnings is lower than expected, the market has ignored the potentially inflationary effect of the headline result and interpreted the fall in earnings as deflationary. The Participation Rate and the Average Weekly Hours components can also influence the market reaction, but only in seldom events like the “Great Resignation” or the Global Financial Crisis.
EUR/USD edged slightly higher and closed in positive territory above 1.0800 on Thursday. The pair holds its ground early Friday as market focus shifts to June labor market data from the US.
Following the Independence Day holiday in the US, the US Dollar (USD) stays on the back foot and helps EUR/USD hold its ground.
The table below shows the percentage change of Euro (EUR) against listed major currencies this week. Euro was the strongest against the US Dollar.
| USD | EUR | GBP | JPY | CAD | AUD | NZD | CHF | |
|---|---|---|---|---|---|---|---|---|
| USD | -1.06% | -1.05% | -0.03% | -0.50% | -0.99% | -0.41% | -0.01% | |
| EUR | 1.06% | -0.21% | 0.75% | 0.27% | -0.03% | 0.35% | 0.75% | |
| GBP | 1.05% | 0.21% | 0.94% | 0.48% | 0.18% | 0.57% | 0.98% | |
| JPY | 0.03% | -0.75% | -0.94% | -0.47% | -0.89% | -0.38% | 0.05% | |
| CAD | 0.50% | -0.27% | -0.48% | 0.47% | -0.45% | 0.09% | 0.49% | |
| AUD | 0.99% | 0.03% | -0.18% | 0.89% | 0.45% | 0.39% | 0.87% | |
| NZD | 0.41% | -0.35% | -0.57% | 0.38% | -0.09% | -0.39% | 0.43% | |
| CHF | 0.01% | -0.75% | -0.98% | -0.05% | -0.49% | -0.87% | -0.43% |
The heat map shows percentage changes of major currencies against each other. The base currency is picked from the left column, while the quote currency is picked from the top row. For example, if you pick the Euro from the left column and move along the horizontal line to the US Dollar, the percentage change displayed in the box will represent EUR (base)/USD (quote).
Nonfarm Payrolls in the US are forecast to rise 190,000 in June following the impressive 272,000 increase recorded in May, while the Unemployment Rate is seen staying unchanged at 4%.
The steady increase in the weekly Initial Jobless Claims data throughout June and disappointing ISM Manufacturing and Services PMI reports, which showed a contraction in these sectors’ payrolls in June, pointed to loosening conditions in the labor market.
In case the NFP arrives at around 150,000 or lower, the US Dollar could stay under selling pressure heading into the weekend and allow EUR/USD to extend its weekly rally. According to the CME FedWatch Tool, markets are currently pricing in a 25% probability of the Federal Reserve leaving the policy rate unchanged in September. Hence, the market positioning suggests that the USD has more room on the downside in case investors continue to price in a September rate cut on a weak jobs report.
On the other hand, a strong increase in NFP, more than 220,000, could cause investors to reassess the timing of the Fed’s policy pivot and trigger a downward correction in EUR/USD in the American session.
The Relative Strength Index (RSI) indicator on the 4-hour chart rose above 70 on Friday. Although this development suggests that EUR/USD is technically overbought, buyers could look to dominate the action as long as 1.0800 (100-day Simple Moving Average (SMA), 200-day SMA) stays intact as support. On the upside, 1.0840 (Fibonacci 23.6% retracement of the latest uptrend) could be seen as interim resistance before 1.0900 (psychological level, static level).
If EUR/USD drops below 1.0800 and fails to reclaim this level, supports could be seen at 1.0760 (Fibonacci 50% retracement) and 1.0730-1.0740 (Fibonacci 61.8% retracement, 20-day SMA).
Nonfarm Payrolls (NFP) are part of the US Bureau of Labor Statistics monthly jobs report. The Nonfarm Payrolls component specifically measures the change in the number of people employed in the US during the previous month, excluding the farming industry.
The Nonfarm Payrolls figure can influence the decisions of the Federal Reserve by providing a measure of how successfully the Fed is meeting its mandate of fostering full employment and 2% inflation. A relatively high NFP figure means more people are in employment, earning more money and therefore probably spending more. A relatively low Nonfarm Payrolls’ result, on the either hand, could mean people are struggling to find work. The Fed will typically raise interest rates to combat high inflation triggered by low unemployment, and lower them to stimulate a stagnant labor market.
Nonfarm Payrolls generally have a positive correlation with the US Dollar. This means when payrolls’ figures come out higher-than-expected the USD tends to rally and vice versa when they are lower. NFPs influence the US Dollar by virtue of their impact on inflation, monetary policy expectations and interest rates. A higher NFP usually means the Federal Reserve will be more tight in its monetary policy, supporting the USD.
Nonfarm Payrolls are generally negatively-correlated with the price of Gold. This means a higher-than-expected payrolls’ figure will have a depressing effect on the Gold price and vice versa. Higher NFP generally has a positive effect on the value of the USD, and like most major commodities Gold is priced in US Dollars. If the USD gains in value, therefore, it requires less Dollars to buy an ounce of Gold. Also, higher interest rates (typically helped higher NFPs) also lessen the attractiveness of Gold as an investment compared to staying in cash, where the money will at least earn interest.
Nonfarm Payrolls is only one component within a bigger jobs report and it can be overshadowed by the other components. At times, when NFP come out higher-than-forecast, but the Average Weekly Earnings is lower than expected, the market has ignored the potentially inflationary effect of the headline result and interpreted the fall in earnings as deflationary. The Participation Rate and the Average Weekly Hours components can also influence the market reaction, but only in seldom events like the “Great Resignation” or the Global Financial Crisis.
You have reached your limit of 5 free articles for this month.
Access all our articles, insights, and analysts.
Your coupon code
Following Thursday’s subdued action, GBP/USD regained its traction and reached its highest level in three weeks near 1.2780 on Friday. 1.2800 aligns as next immediate resistance for the pair as investors gear up for the key data releases from the US.
The table below shows the percentage change of British Pound (GBP) against listed major currencies this week. British Pound was the strongest against the US Dollar.
| USD | EUR | GBP | JPY | CAD | AUD | NZD | CHF | |
|---|---|---|---|---|---|---|---|---|
| USD | -1.04% | -1.12% | -0.03% | -0.48% | -0.99% | -0.45% | -0.03% | |
| EUR | 1.04% | -0.30% | 0.73% | 0.26% | -0.06% | 0.29% | 0.72% | |
| GBP | 1.12% | 0.30% | 1.01% | 0.56% | 0.24% | 0.59% | 1.02% | |
| JPY | 0.03% | -0.73% | -1.01% | -0.44% | -0.89% | -0.42% | 0.04% | |
| CAD | 0.48% | -0.26% | -0.56% | 0.44% | -0.47% | 0.03% | 0.46% | |
| AUD | 0.99% | 0.06% | -0.24% | 0.89% | 0.47% | 0.35% | 0.87% | |
| NZD | 0.45% | -0.29% | -0.59% | 0.42% | -0.03% | -0.35% | 0.45% | |
| CHF | 0.03% | -0.72% | -1.02% | -0.04% | -0.46% | -0.87% | -0.45% |
The heat map shows percentage changes of major currencies against each other. The base currency is picked from the left column, while the quote currency is picked from the top row. For example, if you pick the British Pound from the left column and move along the horizontal line to the US Dollar, the percentage change displayed in the box will represent GBP (base)/USD (quote).
The Labour Party won a parliamentary majority in the UK general election, securing 411 seats in the 650-seat House of Commons and paving the way for Labour leader Keir Starmer to become the next prime minister. As this outcome was largely expected, it had little to no impact on Pound Sterling’s valuation.
In the second half of the day, the US Bureau of Labor Statistics will release the June jobs report. Following the impressive 272,000 increase recorded in May, Nonfarm Payrolls are forecast to rise 190,000 in June. The Unemployment Rate is seen holding steady at 4% and the annual wage inflation, as measured by the change in the Average Hourly Earnings, is expected to decline to 3.9% from 4.1%.
Earlier in the week, the Manufacturing and the Services PMI reports published by the ISM pointed to a decline in these sectors’ payrolls. Additionally, ADP Employment Change came in at 150,000 to miss the market expectation of 160,000, while the weekly Initial Jobless Claims edged higher to 238,000 in the week ending June 29, up from 234,000 in the previous week.
The selling pressure surrounding the US Dollar (USD) seen this week suggests that markets might have already priced in a disappointing NFP reading. The market positioning, however, shows that there is more room for further USD weakness in case the jobs report feed into expectations for a Federal Reserve (Fed) rate cut in September. According to the CME FedWatch Tool, there is still a 25% probability that the Fed leave the policy rate unchanged in September.
Hence, the immediate reaction to an NFP reading of 150,000, or lower, could fuel another leg higher in GBP/USD. On the flip side, a positive surprise could support the USD and limit the pair’s upside heading into the weekend.
The Relative Strength Index (RSI) indicator on the 4-hour chart stays above 70 and points to overbought conditions. Nevertheless, investors are likely to ignore this technical development in case the US data triggers a USD selloff. 1.2800 (psychological level, static level) could be seen as next resistance before 1.2860 (Jun 12 high) and 1.2900 (psychological level, static level).
On the downside, supports could be seen at 1.2700 (20-day Simple Moving Average (SMA)), 1.2670 (50-day SMA) and 1.2650 (100-day SMA).
The Nonfarm Payrolls release presents the number of new jobs created in the US during the previous month in all non-agricultural businesses; it is released by the US Bureau of Labor Statistics (BLS). The monthly changes in payrolls can be extremely volatile. The number is also subject to strong reviews, which can also trigger volatility in the Forex board. Generally speaking, a high reading is seen as bullish for the US Dollar (USD), while a low reading is seen as bearish, although previous months’ reviews and the Unemployment Rate are as relevant as the headline figure. The market’s reaction, therefore, depends on how the market assesses all the data contained in the BLS report as a whole.
Read more.
Following Thursday’s subdued action, GBP/USD regained its traction and reached its highest level in three weeks near 1.2780 on Friday. 1.2800 aligns as next immediate resistance for the pair as investors gear up for the key data releases from the US.
The table below shows the percentage change of British Pound (GBP) against listed major currencies this week. British Pound was the strongest against the US Dollar.
| USD | EUR | GBP | JPY | CAD | AUD | NZD | CHF | |
|---|---|---|---|---|---|---|---|---|
| USD | -1.04% | -1.12% | -0.03% | -0.48% | -0.99% | -0.45% | -0.03% | |
| EUR | 1.04% | -0.30% | 0.73% | 0.26% | -0.06% | 0.29% | 0.72% | |
| GBP | 1.12% | 0.30% | 1.01% | 0.56% | 0.24% | 0.59% | 1.02% | |
| JPY | 0.03% | -0.73% | -1.01% | -0.44% | -0.89% | -0.42% | 0.04% | |
| CAD | 0.48% | -0.26% | -0.56% | 0.44% | -0.47% | 0.03% | 0.46% | |
| AUD | 0.99% | 0.06% | -0.24% | 0.89% | 0.47% | 0.35% | 0.87% | |
| NZD | 0.45% | -0.29% | -0.59% | 0.42% | -0.03% | -0.35% | 0.45% | |
| CHF | 0.03% | -0.72% | -1.02% | -0.04% | -0.46% | -0.87% | -0.45% |
The heat map shows percentage changes of major currencies against each other. The base currency is picked from the left column, while the quote currency is picked from the top row. For example, if you pick the British Pound from the left column and move along the horizontal line to the US Dollar, the percentage change displayed in the box will represent GBP (base)/USD (quote).
The Labour Party won a parliamentary majority in the UK general election, securing 411 seats in the 650-seat House of Commons and paving the way for Labour leader Keir Starmer to become the next prime minister. As this outcome was largely expected, it had little to no impact on Pound Sterling’s valuation.
In the second half of the day, the US Bureau of Labor Statistics will release the June jobs report. Following the impressive 272,000 increase recorded in May, Nonfarm Payrolls are forecast to rise 190,000 in June. The Unemployment Rate is seen holding steady at 4% and the annual wage inflation, as measured by the change in the Average Hourly Earnings, is expected to decline to 3.9% from 4.1%.
Earlier in the week, the Manufacturing and the Services PMI reports published by the ISM pointed to a decline in these sectors’ payrolls. Additionally, ADP Employment Change came in at 150,000 to miss the market expectation of 160,000, while the weekly Initial Jobless Claims edged higher to 238,000 in the week ending June 29, up from 234,000 in the previous week.
The selling pressure surrounding the US Dollar (USD) seen this week suggests that markets might have already priced in a disappointing NFP reading. The market positioning, however, shows that there is more room for further USD weakness in case the jobs report feed into expectations for a Federal Reserve (Fed) rate cut in September. According to the CME FedWatch Tool, there is still a 25% probability that the Fed leave the policy rate unchanged in September.
Hence, the immediate reaction to an NFP reading of 150,000, or lower, could fuel another leg higher in GBP/USD. On the flip side, a positive surprise could support the USD and limit the pair’s upside heading into the weekend.
The Relative Strength Index (RSI) indicator on the 4-hour chart stays above 70 and points to overbought conditions. Nevertheless, investors are likely to ignore this technical development in case the US data triggers a USD selloff. 1.2800 (psychological level, static level) could be seen as next resistance before 1.2860 (Jun 12 high) and 1.2900 (psychological level, static level).
On the downside, supports could be seen at 1.2700 (20-day Simple Moving Average (SMA)), 1.2670 (50-day SMA) and 1.2650 (100-day SMA).
The Nonfarm Payrolls release presents the number of new jobs created in the US during the previous month in all non-agricultural businesses; it is released by the US Bureau of Labor Statistics (BLS). The monthly changes in payrolls can be extremely volatile. The number is also subject to strong reviews, which can also trigger volatility in the Forex board. Generally speaking, a high reading is seen as bullish for the US Dollar (USD), while a low reading is seen as bearish, although previous months’ reviews and the Unemployment Rate are as relevant as the headline figure. The market’s reaction, therefore, depends on how the market assesses all the data contained in the BLS report as a whole.
Read more.
Natural Gas (NG) is trading at $2.354, down 1.26%. On the 2-hour chart, the pivot point is $2.39. Immediate resistance levels are $2.44, $2.47, and $2.51, while support levels are $2.34, $2.31, and $2.27.
Technical indicators show the 50 EMA at $2.46 and the 200 EMA at $2.64, indicating a bearish trend below $2.39. A break above this level could shift the bias to bullish.
Asia Pacific specialty coffee market will grow by 14.7% annually with a total addressable market cap of $266.39 billion over 2024-2033. The growth is driven by rising disposable income and urbanization, growing demand for on-the-go coffee, strengthening premium coffee shops, and rising preferences for specialty coffee and green coffee.
Read the Market Summary Here:-https://reportocean.com/industry-verticals/sample-request?report_id=GMD1871
Highlighted with 48 tables and 57 figures, this 127-page report ?Asia Pacific Specialty Coffee Market 2023-2033 by Grade (80-84.99, 85-89.99, 90-100), Product Type, Application (Home, Commercial), Consumer Age, Roast (Regular, Artisanal), Distribution Channel, and Country: Trend Forecast and Growth Opportunity? is based on comprehensive research of the entire Asia Pacific specialty coffee market and all its sub-segments through extensively detailed classifications. Profound analysis and assessment are generated from premium primary and secondary information sources with inputs derived from industry professionals across the value chain. The report is based on studies on 2021-2023 and provides forecast from 2024 till 2033 with 2023 as the base year. (Please note: The report will be updated before delivery so that the latest historical year is the base year, and the forecast covers at least 5 years over the base year.)
In-depth qualitative analyses include identification and investigation of the following aspects:
? Market Structure
? Growth Drivers
? Restraints and Challenges
? Emerging Product Trends & Market Opportunities
? Porter?s Fiver Forces
For an in-depth analysis, you can refer sample copy of the report @-https://reportocean.com/industry-verticals/sample-request?report_id=GMD1871
The trend and outlook of Asia Pacific market is forecast in optimistic, balanced, and conservative view by taking into account of COVID-19 and Russia-Ukraine conflict. The balanced (most likely) projection is used to quantify Asia Pacific specialty coffee market in every aspect of the classification from perspectives of Grade, Product Type, Application, Consumer Age, Roast, Distribution Channel, and Country.
Based on Grade, the Asia Pacific market is segmented into the following sub-markets with annual revenue ($ mn) for 2023-2033 included in each section.
? Coffee with 80-84.99 Points
? Coffee with 85-89.99 Points
? Coffee with 90-100 Points
Based on Product Type, the Asia Pacific market is segmented into the following sub-markets with annual revenue ($ mn) for 2023-2033 included in each section.
? Instant Coffee
? Ground Coffee
? Whole Beans
? Single-Cup
? Other Products
By Application, the Asia Pacific market is segmented into the following sub-markets with annual revenue ($ mn) for 2023-2033 included in each section.
? Home Use
? Commercial Use
Get a Free Sample PDF copy of the report @-https://reportocean.com/industry-verticals/sample-request?report_id=GMD1871
By Consumer Age, the Asia Pacific market is segmented into the following sub-markets with annual revenue ($ mn) for 2023-2033 included in each section.
? 18-24-Year-Old Consumers
? 25-34-Year-Old Consumers
? 35-44-Year-Old Consumers
? 45-54-Year-Old Consumers
? >55-Year-Old Consumers
By Roast, the Asia Pacific market is segmented into the following sub-markets with annual revenue ($ mn) for 2023-2033 included in each section.
? Regular Roast
? Artisanal Roast
By Distribution Channel, the Asia Pacific market is segmented into the following sub-markets with annual revenue ($ mn) for 2023-2033 included in each section.
? Food Service
? Specialty Stores
? Supermarkets and Hypermarkets
? Online Stores
? Retail and Grocery Stores
Get an Exclusive Sample Copy of the Report at:-https://reportocean.com/industry-verticals/sample-request?report_id=GMD1871
Geographically, the following national/local markets are fully investigated:
? Japan
? China
? South Korea
? Australia
? India
? Rest of APAC (further segmented into Malaysia, Singapore, Indonesia, Thailand, New Zealand, Vietnam, Taiwan, and Philippines)
For each key country, detailed analysis and data for annual revenue ($ mn) are available for 2023-2033. The breakdown of national markets by Grade, Application, and Distribution Channel over the forecast years are also included.
The report also covers the current competitive scenario and the predicted trend; and profiles key vendors including market leaders and important emerging players.
Selected Key Players:
Blue Bottle
Bulletproof
Caff? Nero Group Ltd.
Caribou Coffee Company
Costa Coffee
Don Francisco?s Coffee
Dunkin’ Donuts LLC
Download Sample Report, SPECIAL OFFER (Avail an Up-to 30% discount on this report) @-https://reportocean.com/industry-verticals/sample-request?report_id=GMD1871
Eight O?Clock Coffee
JAB Holding Company
Luigi Lavazza S.p.A.
Starbucks Corporation
Strauss Group Ltd.
Reasons to buy this report –
Analyze market outlook with recent trends and SWOT analysis.
Dynamic market scenario along with market growth opportunities for the coming years.
Market segmentation analysis, including qualitative and quantitative research incorporating the impact of economic and non-economic aspects.
Regional and national analyzes integrating supply and demand forces that are influencing market growth.
Market value (millions of dollars) and volume (millions of units) data for each segment and sub-segment
Competitive scenario involving the market share of the main players, along with the new projects and strategies adopted by the players in recent years.
Access Full Report Description, TOC, Table of Figure, Chart, etc.-https://reportocean.com/industry-verticals/sample-request?report_id=GMD1871
About Report Ocean:
Report Ocean is a renowned provider of market research reports, offering high-quality insights to clients in various industries. Their goal is to assist clients in achieving their top line and bottom line objectives, thereby enhancing their market share in today’s competitive environment. As a trusted source for innovative market research reports, Report Ocean serves as a comprehensive solution for individuals, organizations, and industries seeking valuable market intelligence.
Contact Information:
Email:[email protected]
Address: 500 N Michigan Ave, Suite 600, Chicago, Illinois 60611, United States
Telephone: +1 888 212 3539 (US – Toll-Free)
For more information and to explore their offerings, visit their website at:https://www.reportocean.com/
Gold showed no signs of life on Thursday, trading just below the $2,360 mark. A holiday in the United States (US) exacerbated the quietness in the second half of the day, leaving the bright metal consolidating weekly gains.
The US Dollar turned south after Federal Reserve (Fed) Chairman Jerome Powell cooled down his words on inflation. Despite maintaining a cautious tone, Powell said that the disinflationary trend seems to be resuming in an event organized by the European Central Bank (ECB) in Sintra. His words put pressure on the Greenback ahead of key US employment-related data.
The Bureau of Labor Statistics (BLS) will release the Nonfarm Payrolls (NFP) report on Friday, and market participants expect the US economy to have added 190K new positions in June, below the 272K gained in May. The Unemployment Rate is expected to remain steady at 4%, while Average Hourly Earnings are foreseen to be up 3.9% YoY, easing from the previous 4.1%. The figures, if confirmed, may fuel speculation of a September rate cut and push the US Dollar further south across the FX board.
Technically, the daily chart shows XAU/USD has remained confined to a tight range near its weekly high of $2,364.83, losing momentum but with the risk still skewed to the upside. The pair is developing above a flat 20 Simple Moving Average (SMA) while the 100 and 200 SMAs keep advancing below it. Technical indicators, in the meantime, remain within positive levels, although without directional strength.
In the near term, and according to the 4-hour chart, chances are of another leg north. XAU/USD develops above all its moving averages, with the 20 SMA maintaining an upward slope after crossing above the 100 and 200 SMAs. Finally, technical indicators have turned flat but hold near overbought readings without signs of upward exhaustion.
Support levels: 2,341.50 2,329.20 2,313.60
Resistance levels: 2,368.60, 2,387.60 2,400.00
The Bank of Japan could tighten monetary policy to bolster the Japanese Yen.
BoJ Deputy Governor Ryozo Himino recently addressed the effects of a weaker Yen on the economy, saying,
“Exchange-rate fluctuations affect economic activity in various ways. It also affects inflation in a broad-based and sustained way, beyond the direct impact on import prices.”
With the Japanese government holding back from intervening for the second time in as many months, the onus may be on the BoJ to target the weaker Yen.
In June, Bruegel Senior Fellow Alicia Garcia Herrero saw quantitative tightening as more effective than interventions, saying:
“Bank of Japan to start quantitative tightening, which could support the Yen more than intervention.”
I asked her if the BoJ would risk cutting JGB purchases back more aggressively if US inflation numbers did not sink expectations of a September Fed rate cut, to which she replied,
“No choice, Yen beyond 160.”
US inflation numbers didn’t sink expectations of a September Fed rate cut, nor did they fuel expectations, leaving the USD/JPY at 161.
Considering interest rate differentials and carry trade appetite, numbers from Japan must improve. If all else fails, an aggressive cut to JGB purchases may do the job, but at what cost?
Meanwhile, the US Jobs Report will warrant investor attention later in the session on Friday.
Can the Jobs Report give the BoJ some breathing room?
Fed Chair Powell spoke favorably about inflation progress toward the 2% target on Tuesday, July 2. However, the Fed Chair left investors with a focal point going into the Friday session. Powell highlighted that wage growth remained elevated.
Higher wages could increase disposable income and fuel consumer spending and demand-driven inflation.
The US Jobs Report could alleviate concerns about wage growth if average hourly earnings soften by more than expected.
Economists forecast average hourly earnings to increase 3.9% year-on-year in June after rising 4.1% in May.
For perspective, average hourly earnings rose 4.4% in January and trended lower to 4.0% in April before an uptick to 4.1% in May. A drop below 4.0% may not be enough to cement a September Fed rate hike. Both a rise in unemployment and a decline in the participation rate may be necessary to suggest a sustainable downward trend in wage growth.
Economists expect the US unemployment rate to remain steady at 4.0% in June.
Certainly, an argument can be made that the selling is overdone and that a bounce is overdue. However, as it looks now, the week may end with a fourth consecutive weekly wide range red candle with a close near the low of the week’s trading range. This shows sellers dominating to the end of the session and therefore they may continue to do so heading into next week.
There is still time for that to change, but not much, especially given the lower activity levels due to the Independence Day holiday in the United States. If this scenario is correct, then the price of natural gas remains at risk of testing the next lower target zone before a notable bounce.
Nonetheless, the retracement low of 2.335 completed a falling ABCD pattern and is shown on the chart. Once price symmetry between the AB and CD legs of the pattern match, or are close to each other, a potential pivot level has been identified. That could lead to a reversal as either support or resistance shows up, depending on the direction of the pattern. Or a breakout through the price area and a continuation of the trend triggers instead.
For natural gas, the current retracement low completed the initial target for the ABCD pattern. Also, a 50% trend retracement was completed during the decline at 2.37. Together, the two price levels can be watched as a support zone. So far, that is the case but there is little indication that the support zone can do more than slow the descent. Natural gas fell below the 200-Day MA two days ago and it continues to fall. This is bearish behavior.
A decisive drop below 2.335 could lead to a decline to the next lower potential support zone from around 2.23 to 2.18. The 61.8% Fibonacci retracement is at 2.18, while an extended lower target for the ABCD pattern completes at 2.20. A prior swing ow at 2.23 begins the support zone.
For a look at all of today’s economic events, check out our economic calendar.
You have reached your limit of 5 free articles for this month.
Access all our articles, insights, and analysts.
Your coupon code
The US Dollar (USD) experienced another bearish performance, motivating the USD Index (DXY) to revisit the vicinity of the 105.00 region amidst the dominating appetite for risk-related assets and marginal trading conditions due to the US Independence Day holiday.
The downturn in the Greenback kept the upward pressure intact on EUR/USD, pushing it back above the key 1.0800 yardstick. The pressure on the Greenback intensified following discouraging results from the US economic calendar in the previous session, particularly concerning the labour market, which revived expectations of Federal Reserve (Fed) interest rate cuts as early as September.
Closer to home, the ECB published its Accounts of its June 6 meeting, where it trimmed rates by 25 bps, as widely anticipated. In the Accounts, policymakers showed concern about inflation after cutting interest rates last month, fearing further delay could be costly and complicate future efforts to anchor inflation expectations. The bank’s officials also noted that the final phase of disinflation, known as “the last mile,” is the most challenging.
Meanwhile, the macroeconomic landscape remained relatively stable on both sides of the Atlantic. The ECB is contemplating further rate reductions beyond the summer, with market expectations leaning towards two additional cuts by year-end. Conversely, speculation among market participants surrounds whether the Fed will implement one or two rate cuts this year, despite the Fed’s current projection of a single cut, likely in December.
Based on the CME Group’s FedWatch Tool, there is approximately a 73% likelihood of interest rate cuts in September, contrasting with nearly a 95% probability by the December meeting.
The recent ECB rate cut, coupled with the Fed’s decision to maintain rates, has widened the policy divergence between the two central banks. This discrepancy could potentially lead to further weakening of EUR/USD in the short term. Nonetheless, prospects of economic recovery in the Eurozone, alongside perceived weaknesses in US economic fundamentals, may mitigate this disparity, offering occasional support to the currency pair in the near future.
Looking forward, the next pivotal event for the currency pair will be the release of the highly influential Nonfarm Payrolls report for June on Friday, preceding the second round of French snap elections scheduled for July 7. Regarding the elections, Le Pen’s NR party is anticipated to capture between 210 and 250 seats out of the 289 seats required for a majority in the National Assembly.
EUR/USD daily chart
Further higher may see EUR/USD revisit the July peak of 1.0816 (July 3), followed by the weekly high of 1.0852 (June 12) and the June top of 1.0916 (June 4). If the pair breaks above this region, it might put the March peak of 1.0981 (March 8) back on the radar, ahead of the weekly high of 1.0998 (January 11) and the psychological 1.1000 mark.
If bears regain the upper hand, spot may fall to its June low of 1.0666 (June 26), then the May low of 1.0649 (May 1), and ultimately the 2024 bottom of 1.0601 (April 16).
Looking at the broader picture, extra gains appear on the cards on a sustainable surpass of the key 200-day SMA (1.0794).
So far, the 4-hour chart shows the continuation of the bullish impulse. The initial resistance level is 1.0816, followed by 1.0852. The nearest support is at 1.0666, ahead of 1.0649 and finally 1.0601. The Relative Strength Index (RSI) climbed to about 69
The US Dollar (USD) experienced another bearish performance, motivating the USD Index (DXY) to revisit the vicinity of the 105.00 region amidst the dominating appetite for risk-related assets and marginal trading conditions due to the US Independence Day holiday.
The downturn in the Greenback kept the upward pressure intact on EUR/USD, pushing it back above the key 1.0800 yardstick. The pressure on the Greenback intensified following discouraging results from the US economic calendar in the previous session, particularly concerning the labour market, which revived expectations of Federal Reserve (Fed) interest rate cuts as early as September.
Closer to home, the ECB published its Accounts of its June 6 meeting, where it trimmed rates by 25 bps, as widely anticipated. In the Accounts, policymakers showed concern about inflation after cutting interest rates last month, fearing further delay could be costly and complicate future efforts to anchor inflation expectations. The bank’s officials also noted that the final phase of disinflation, known as “the last mile,” is the most challenging.
Meanwhile, the macroeconomic landscape remained relatively stable on both sides of the Atlantic. The ECB is contemplating further rate reductions beyond the summer, with market expectations leaning towards two additional cuts by year-end. Conversely, speculation among market participants surrounds whether the Fed will implement one or two rate cuts this year, despite the Fed’s current projection of a single cut, likely in December.
Based on the CME Group’s FedWatch Tool, there is approximately a 73% likelihood of interest rate cuts in September, contrasting with nearly a 95% probability by the December meeting.
The recent ECB rate cut, coupled with the Fed’s decision to maintain rates, has widened the policy divergence between the two central banks. This discrepancy could potentially lead to further weakening of EUR/USD in the short term. Nonetheless, prospects of economic recovery in the Eurozone, alongside perceived weaknesses in US economic fundamentals, may mitigate this disparity, offering occasional support to the currency pair in the near future.
Looking forward, the next pivotal event for the currency pair will be the release of the highly influential Nonfarm Payrolls report for June on Friday, preceding the second round of French snap elections scheduled for July 7. Regarding the elections, Le Pen’s NR party is anticipated to capture between 210 and 250 seats out of the 289 seats required for a majority in the National Assembly.
EUR/USD daily chart
Further higher may see EUR/USD revisit the July peak of 1.0816 (July 3), followed by the weekly high of 1.0852 (June 12) and the June top of 1.0916 (June 4). If the pair breaks above this region, it might put the March peak of 1.0981 (March 8) back on the radar, ahead of the weekly high of 1.0998 (January 11) and the psychological 1.1000 mark.
If bears regain the upper hand, spot may fall to its June low of 1.0666 (June 26), then the May low of 1.0649 (May 1), and ultimately the 2024 bottom of 1.0601 (April 16).
Looking at the broader picture, extra gains appear on the cards on a sustainable surpass of the key 200-day SMA (1.0794).
So far, the 4-hour chart shows the continuation of the bullish impulse. The initial resistance level is 1.0816, followed by 1.0852. The nearest support is at 1.0666, ahead of 1.0649 and finally 1.0601. The Relative Strength Index (RSI) climbed to about 69
You have reached your limit of 5 free articles for this month.
Access all our articles, insights, and analysts.
Your coupon code
Gold showed no signs of life on Thursday, trading just below the $2,360 mark. A holiday in the United States (US) exacerbated the quietness in the second half of the day, leaving the bright metal consolidating weekly gains.
The US Dollar turned south after Federal Reserve (Fed) Chairman Jerome Powell cooled down his words on inflation. Despite maintaining a cautious tone, Powell said that the disinflationary trend seems to be resuming in an event organized by the European Central Bank (ECB) in Sintra. His words put pressure on the Greenback ahead of key US employment-related data.
The Bureau of Labor Statistics (BLS) will release the Nonfarm Payrolls (NFP) report on Friday, and market participants expect the US economy to have added 190K new positions in June, below the 272K gained in May. The Unemployment Rate is expected to remain steady at 4%, while Average Hourly Earnings are foreseen to be up 3.9% YoY, easing from the previous 4.1%. The figures, if confirmed, may fuel speculation of a September rate cut and push the US Dollar further south across the FX board.
Technically, the daily chart shows XAU/USD has remained confined to a tight range near its weekly high of $2,364.83, losing momentum but with the risk still skewed to the upside. The pair is developing above a flat 20 Simple Moving Average (SMA) while the 100 and 200 SMAs keep advancing below it. Technical indicators, in the meantime, remain within positive levels, although without directional strength.
In the near term, and according to the 4-hour chart, chances are of another leg north. XAU/USD develops above all its moving averages, with the 20 SMA maintaining an upward slope after crossing above the 100 and 200 SMAs. Finally, technical indicators have turned flat but hold near overbought readings without signs of upward exhaustion.
Support levels: 2,341.50 2,329.20 2,313.60
Resistance levels: 2,368.60, 2,387.60 2,400.00
Gold showed no signs of life on Thursday, trading just below the $2,360 mark. A holiday in the United States (US) exacerbated the quietness in the second half of the day, leaving the bright metal consolidating weekly gains.
The US Dollar turned south after Federal Reserve (Fed) Chairman Jerome Powell cooled down his words on inflation. Despite maintaining a cautious tone, Powell said that the disinflationary trend seems to be resuming in an event organized by the European Central Bank (ECB) in Sintra. His words put pressure on the Greenback ahead of key US employment-related data.
The Bureau of Labor Statistics (BLS) will release the Nonfarm Payrolls (NFP) report on Friday, and market participants expect the US economy to have added 190K new positions in June, below the 272K gained in May. The Unemployment Rate is expected to remain steady at 4%, while Average Hourly Earnings are foreseen to be up 3.9% YoY, easing from the previous 4.1%. The figures, if confirmed, may fuel speculation of a September rate cut and push the US Dollar further south across the FX board.
Technically, the daily chart shows XAU/USD has remained confined to a tight range near its weekly high of $2,364.83, losing momentum but with the risk still skewed to the upside. The pair is developing above a flat 20 Simple Moving Average (SMA) while the 100 and 200 SMAs keep advancing below it. Technical indicators, in the meantime, remain within positive levels, although without directional strength.
In the near term, and according to the 4-hour chart, chances are of another leg north. XAU/USD develops above all its moving averages, with the 20 SMA maintaining an upward slope after crossing above the 100 and 200 SMAs. Finally, technical indicators have turned flat but hold near overbought readings without signs of upward exhaustion.
Support levels: 2,341.50 2,329.20 2,313.60
Resistance levels: 2,368.60, 2,387.60 2,400.00