The main category of Forex News.
You can use the search box below to find what you need.
[wd_asp id=1]
The main category of Forex News.
You can use the search box below to find what you need.
[wd_asp id=1]
According to reliable trading platforms, the pound received support from the rise in European assets as investors expressed relief that Marine Le Pen’s National Rally party is unlikely to win an absolute majority in the National Assembly after the weekend’s elections. This came after her party performed less than expected (~33% of the vote) compared to what opinion polls indicated it would achieve (~36%). Overall, a hung legislature is the likely outcome of Sunday’s second round of voting, especially as the far left and centrist parties are willing to cooperate on an anti-Le Pen voting strategy. The end result is that European assets are on the rise, including the pound.

Technically, GBP/USD has moved above its 9-day moving average, the first real positive technical development we have seen for the pair since mid-June. This could signal some near-term gains, with 1.27 a potential target. Also, the RSI is at 50 (neutral) but has turned higher again (positive development in the coming hours). Overall, we note that GBP/USD has also broken above its 50-day moving average, which has turned into a source of resistance last week.
A daily close above this level (1.2654) could indicate that a more constructive technical outlook is starting to form again. Recently, a rise in the pound could put it on track towards the midpoint forecast by major global investment banks.
Looking at the economic calendar, several releases and speeches this week could offer sterling volatility. The US ISM manufacturing survey is due out on Monday, which could provide further signs of an economic slowdown. Federal Reserve Chairman Jerome Powell will speak at the European Central Bank conference in Sintra, Portugal on Tuesday. Markets will be keen to hear his updated views on the possibility of a Fed rate cut in 2024.
This theme continues into the middle of the week when the Fed releases its minutes of its June 11-12 policy meeting. Thus, this is expected to provide more color for markets on the very important question of interest rates. Also, Wednesday sees the release of the ISM PMI services survey, another potential market-moving release. As a reminder, if the market raises its expectations of a September rate cut after this data and appearances, the dollar could weaken. Any disappointments would strengthen the dollar. Currently, the market is pricing in a 56% chance of a September rate cut.
Furthermore, the highlight of the week will be the US nonfarm payrolls report on Friday. The headline number is expected to come in at 180,000, down from 272,000. Also, average hourly earnings are expected to rise 0.3% on a monthly basis in June.
The UK election on Thursday is a low-risk event at this stage as the odds of a Labor win are very high and we have seen no shift in the polls to suggest that this will not be the outcome. The first major event to watch is the exit poll due at 10pm on Thursday night. Moreover, this has been a very accurate indicator in recent history. However, the surprise would be a strong Conservative showing which would lead to a ‘hung parliament’ where no party can command a majority on its own. Consequently, this would lead to a weaker pound as markets contemplate a period of uncertainty. Ultimately, we expect volatility to be short-lived as there is nothing radical in the spending and tax plans of Labor, the Conservatives or the Lib Dems.
Ready to trade our Forex daily analysis and predictions? Here are the best forex trading platforms UK to choose from.
New York, United States , July 02, 2024 (GLOBE NEWSWIRE) — The Global Coffee Capsules Market Size is to Grow from USD 6.9 Billion in 2023 to USD 14.2 Billion by 2033, at a Compound Annual Growth Rate (CAGR) of 7.48% during the projected period.
Get a Sample PDF Brochure: https://www.sphericalinsights.com/request-sample/4760
A coffee capsule is a paper filter-free coffee container made of aluminum or plastic. It is typically different from other things since it is designed expressly to work with a certain brand or system. Utilizing single-serve vacuum-packed coffee capsules calls for certain equipment. As a result, producers release new formulas onto the market, such as coffee capsules. Caffeine also enhances athletic performance by increasing fatty acid oxidation and metabolism and releasing fatty acids from fat cells. There is a growing market for non-alcoholic beverages. Non-alcoholic beverage options include fruit juices, bottled water, carbonated soft drinks, and RTD tea and coffee. Growing urbanization, changing lifestyles, rising health consciousness, and rising disposable income are all predicted to cause a rise in the use of non-alcoholic beverages. Popular non-alcoholic drinks, such as coffee, are valued for their strong caffeine flavor and scent. However, due to the detrimental impacts of packaging, it is anticipated that the demand for coffee capsules will decrease. Coffee capsules are not recyclable since they include both plastic and aluminum.
Browse key industry insights spread across 210 pages with 95 Market data tables and figures & charts from the report on the “Global Coffee Capsule Market Size, Share, and COVID-19 Impact Analysis, By Material (Aluminum, Compostable, PBT Plastic), By Application (Residential, Commercial), By Distribution Channel (Supermarkets and Hypermarkets, Specialty Stores, Online Stores, and Others), and By Region (North America, Europe, Asia-Pacific, Latin America, Middle East, and Africa), Analysis and Forecast 2023 – 2033.”
Buy Now Full Report: https://www.sphericalinsights.com/checkout/4760
The aluminum segment is anticipated to hold the greatest share of the global coffee capsules market during the projected timeframe.
Based on the material, the global coffee capsules market is divided into aluminum, compostable, and PBT plastic. Among these, the aluminum segment is anticipated to hold the greatest share of the global coffee capsules market during the projected timeframe. A combination of their simplicity of use and adaptability, aluminum coffee capsules have seen a significant increase in popularity recently. Customers who want to quickly and conveniently create delicious coffee without having to measure out coffee grounds or grind their own beans are starting to like aluminum coffee capsules more and more. Aluminium coffee capsules are in high demand due to the growing popularity of single-serve coffee makers such as Keurig and Nespresso. These machines, which are designed to use pre-packaged coffee capsules, allow users to quickly prepare one cup of coffee.
The commercial segment is anticipated to hold the greatest share of the global coffee capsules market during the projected timeframe.
Based on the end user, the global coffee capsules market is divided into residential and commercial. Among these, the commercial segment is anticipated to hold the greatest share of the global coffee capsules market during the projected timeframe. The use of coffee capsules in an industrial setting has several advantages. Coffee capsules are a cost-effective and practical solution for businesses looking to provide a range of coffee choices without having to hire professional baristas or invest in specialist equipment. Coffee capsules additionally reduce waste and disarray, which is advantageous in hectic workplaces where productivity and organization are essential.
The supermarkets & hypermarkets segment is predicted to hold the greatest share of the coffee capsules market during the estimated period.
Based on the distribution channel, the global coffee capsules market is divided into supermarkets and hypermarkets, specialty stores, online stores, and others. Among these, the supermarkets & hypermarkets segment is predicted to hold the greatest share of the coffee capsules market during the estimated period. Supermarkets and hypermarkets provide a wide variety of food, drink, and everyday items. Numerous brands of coffee capsules are among the many products available in supermarkets and hypermarkets. Customers have lots of alternatives when it comes to coffee capsules because supermarkets and hypermarkets have dedicated departments for them. The producers of coffee capsules sell directly to retailers or distributors, who resell the capsules to retailers that stock supermarkets and hypermarkets.
Inquire Before Buying This Research Report: https://www.sphericalinsights.com/inquiry-before-buying/4760
Asia Pacific is expected to hold the largest share of the global coffee capsules market over the forecast period.
Asia Pacific is expected to hold the largest share of the global coffee capsules market over the forecast period. The growth of the Asia Pacific market is heavily impacted by variables such as customers’ changing lifestyles and preference for coffee over tea. Customers in the Asia-Pacific region, especially those from China, India, and Japan, prefer to purchase health-related goods. The strong demand for novel products in the Asia Pacific region is driving the market’s growth. The market for coffee capsules is growing in the Asia-Pacific region as a result of rising coffee maker supply and demand.
Europe is predicted to grow at the fastest pace in the global coffee capsules market during the projected timeframe. Coffee capsules, sometimes referred to as coffee pods, allow consumers to quickly and simply make one cup of coffee at home or at work. There are a number of factors driving the demand for coffee capsules in Europe, such as the rising popularity of single-serve coffee and the trend toward home brewing. Consumers are searching for quick and easy ways to enjoy delicious coffee at home without having to invest in bulky, costly coffee brewing supplies. coffee capsules’ ease of use and convenience have increased their appeal. Because they have already been measured, ground, and packaged, they are a hassle-free option for clients who are rushed for time.
Competitive Analysis:
The report offers the appropriate analysis of the key organizations/companies involved within the global market along with a comparative evaluation primarily based on their product offering, business overviews, geographic presence, enterprise strategies, segment market share, and SWOT analysis. The report also provides an elaborative analysis focusing on the current news and developments of the companies, which includes product development, innovations, joint ventures, partnerships, mergers & acquisitions, strategic alliances, and others. This allows for the evaluation of the overall competition within the market. Major vendors in the global coffee capsules Starbucks Corporation, illycaffè S.p.A., Coffeeza, The Kraft Heinz Company, Dualit Limited, JACOBS DOUWE EGBERTS, RAVE COFFEE, Nestle Nespresso SA, Gourmesso Coffee, Blue Tokai Coffee, Keurig Green Mountain, Inc., Gloria Jeans, DD IP Holder LLC, com, Starbucks Corporation, Others.
Get Discount At @ https://www.sphericalinsights.com/request-discount/4760
Recent Developments
Market Segment
This study forecasts revenue at global, regional, and country levels from 2020 to 2033. Spherical Insights has segmented the global coffee capsules market based on the below-mentioned segments:
Global Coffee Capsules Market, By Material
Global Coffee Capsules Market, By End Use
Global Coffee Capsule Market, By Distribution Channel
Global Coffee Capsules Market, Regional Analysis
Browse Related Reports
Global Smart Card Materials Market Size, Share, and COVID-19 Impact Analysis, By Material (Polyvinyl Chloride (PVC), Polycarbonate (PC), Acrylonitrile Butadiene Styrene (ABS), Polyethylene Terephthalate-Glycol (PETG), and Others), By Type (Contact Cards, Contactless Cards, and Multi-Component Cards), By Application (BFSI, Government, Telecommunication, Retail, Healthcare, Hospitality, and Others), and By Region (North America, Europe, Asia-Pacific, Latin America, Middle East, and Africa), Analysis and Forecast 2023 – 2033
Global Gummy Market Size, Share, and COVID-19 Impact Analysis, By Product (Vitamins, Minerals, Dietary Fibers), By Ingredients (Fruit-Based Gummies, Gelatin-Free Gummies, CBD/THC Gummies, Probiotic Gummies, Vitamin/Supplement, Collagen Gummies), By End User (Children, Adults, Seniors), and By Region (North America, Europe, Asia-Pacific, Latin America, Middle East, and Africa), Analysis and Forecast 2023 – 2033
Global Food Thickeners Market Size, Share, and COVID-19 Impact Analysis, By Type (Protein, Starch, Hydrocolloids & Others), By Source (Animal, Plant & Others), By Application (Bakery, Confectionery & Others), and By Region (North America, Europe, Asia-Pacific, Latin America, Middle East, and Africa), Analysis and Forecast 2023 – 2033
Global Diabetic Food Market Size, Share, and COVID-19 Impact Analysis, By Product (Confectionery, Snacks, Dairy Product & Others), By Distribution Channel (Supermarkets & Hypermarkets, Online & Others), and By Region (North America, Europe, Asia-Pacific, Latin America, Middle East, and Africa), Analysis and Forecast 2023 – 2033
About the Spherical Insights & Consulting
Spherical Insights & Consulting is a market research and consulting firm which provides actionable market research study, quantitative forecasting and trends analysis provides forward-looking insight especially designed for decision makers and aids ROI.
Which is catering to different industry such as financial sectors, industrial sectors, government organizations, universities, non-profits and corporations. The company’s mission is to work with businesses to achieve business objectives and maintain strategic improvements.
CONTACT US:
For More Information on Your Target Market, Please Contact Us Below:
Phone: +1 303 800 4326 (the U.S.)
Phone: +91 90289 24100 (APAC)
Email: inquiry@sphericalinsights.com, sales@sphericalinsights.com
Contact Us: https://www.sphericalinsights.com/contact-us
Follow Us: LinkedIn | Facebook | Twitter

Meanwhile, data showed that confidence among large Japanese manufacturers improved to a two-year high in the second quarter amid an improved economic outlook. Last week, the yen fell to multi-decade lows after the Finance Ministry appointed Atsushi Mimura as Japan’s top currency diplomat amid growing pressure to further defend the currency. Recently, the yen lost 2.3% against the U.S. dollar in June, extending its year-to-date decline to about 14% as the Bank of Japan took a more dovish approach to normalizing monetary policy than markets had expected.
In contrast, a growing group of Federal Reserve officials are debating the merits of communicating how they will respond to economic outcomes that diverge from their baseline expectations. Moreover, the post-pandemic recovery has repeatedly surprised economists on Wall Street and at the Fed, leading to sudden changes in market expectations for U.S. interest rates.
This has prompted a new discussion about how central bankers can better explain the risks and uncertainties surrounding the outlook for policy moves. Fed Governor Lisa Cook said last week, “The path of the economy is very uncertain – which means our response to it, which is the change in monetary policy, may also be uncertain – so why don’t we think about different scenarios?” and “It could be a very helpful tool.”
Overall, the concept of using scenarios in policymaking has gained new momentum after former Fed Chairman Ben Bernanke recommended that the Bank of England make greater use of such scenarios in its April independent review of the central bank’s forecasting approach. The word “scenario” has been peppering Fed officials’ speeches and other public comments ever since, with several officials – such as Atlanta’s Raphael Bostic and San Francisco’s Mary Daly – using scenarios to paint different ways the economy could evolve, affecting the path of borrowing costs.
The main tool the Fed uses to signal its expectations is a quarterly summary of individual officials’ forecasts for unemployment, GDP, inflation, and the interest rate. The median forecasts in this document, known as the Summary of Economic Projections, are not intended to be official baseline estimates but are often seen as such.
Some officials, such as Chicago Fed President Austan Goolsbee and former Cleveland Fed President Loretta Mester, have suggested adding more detail to the baseline to better communicate potential policy paths to the public.
My technical view on USD/JPY performance has not changed. The overall, trend remains bullish and recent gains have been enough to push all technical indicators into strong overbought levels. Technically, the trend may remain as it is until Japan intervenes in the forex markets to stem the yen’s losses or until markets and investors react to the Fed’s signals and US jobs numbers. Currently, the closest resistance levels for the currency pair are 161.75, 162.50 and 163.20, respectively.
Start trading the USD/JPY analysis and predictions. Get the best Forex brokers in Japan here.
You have reached your limit of 5 free articles for this month.
Access all our articles, insights, and analysts.
Your coupon code
Spot Gold holds to familiar levels on Tuesday, with XAU/USD now retreating from an intraday high of $2,336.72 to trade just above the $2,320 mark. The bright metal turned south as the mood somehow improved in the American session following comments from Federal Reserve (Fed) Chairman Jerome Powell. Powell participated in a monetary policy panel at the 2024 ECB Forum on Central Banking in Sintra and noted the disinflation trend shows “signs of resuming.” However, he also said that the labor market is still strong, and that policymakers need to see more data like the one they have been seeing recently.
Meanwhile, Austan Goolsbee, President of the Federal Reserve (Fed) Bank of Chicago, also hit the wires in a different event and said he still thinks a soft landing is possible and that the ark of inflation is clearly down. As a result, stock markets trimmed most of their intraday losses, although Wall Street’s major indexes remain in the red. Nevertheless, decreased demand for safety weighed on Gold.
Speculative interest now focuses on United States (US) employment-related data. The country will release the Automatic Data Processing (ADP) Research Institute’s monthly report on private sector job creation for June and Challenger Job Cuts for the same month on Wednesday. The ADP report is expected to show that the private sector added 160K new positions in June, slightly above the 152K added in May. The reports could confirm or deny the case presented by Chair Powell about the labor market still being tight.
The daily chart for XAU/USD shows it hovers around a flat 20 Simple Moving Average (SMA) for a third consecutive day, while the longer moving averages keep heading north below the current level. A bullish 100 SMA provides dynamic support at around $2,261.50. Technical indicators, in the meantime, turned modestly lower at around their midlines, lacking clear directional strength.
In the near term, and according to the 4-hour chart, XAU/USD is bearish-to-neutral, as it rests above a flat 100 SMA, while the 20 SMA turned directionless just above the current level. At the same time, the Momentum indicator heads south right below its midline, while the Relative Strength Index (RSI) indicator consolidates at around 48.
Support levels: 2,319.00 2,308.30 2,293.50
Resistance levels: 2,337.00 2,345.20 2,354.60
Spot Gold holds to familiar levels on Tuesday, with XAU/USD now retreating from an intraday high of $2,336.72 to trade just above the $2,320 mark. The bright metal turned south as the mood somehow improved in the American session following comments from Federal Reserve (Fed) Chairman Jerome Powell. Powell participated in a monetary policy panel at the 2024 ECB Forum on Central Banking in Sintra and noted the disinflation trend shows “signs of resuming.” However, he also said that the labor market is still strong, and that policymakers need to see more data like the one they have been seeing recently.
Meanwhile, Austan Goolsbee, President of the Federal Reserve (Fed) Bank of Chicago, also hit the wires in a different event and said he still thinks a soft landing is possible and that the ark of inflation is clearly down. As a result, stock markets trimmed most of their intraday losses, although Wall Street’s major indexes remain in the red. Nevertheless, decreased demand for safety weighed on Gold.
Speculative interest now focuses on United States (US) employment-related data. The country will release the Automatic Data Processing (ADP) Research Institute’s monthly report on private sector job creation for June and Challenger Job Cuts for the same month on Wednesday. The ADP report is expected to show that the private sector added 160K new positions in June, slightly above the 152K added in May. The reports could confirm or deny the case presented by Chair Powell about the labor market still being tight.
The daily chart for XAU/USD shows it hovers around a flat 20 Simple Moving Average (SMA) for a third consecutive day, while the longer moving averages keep heading north below the current level. A bullish 100 SMA provides dynamic support at around $2,261.50. Technical indicators, in the meantime, turned modestly lower at around their midlines, lacking clear directional strength.
In the near term, and according to the 4-hour chart, XAU/USD is bearish-to-neutral, as it rests above a flat 100 SMA, while the 20 SMA turned directionless just above the current level. At the same time, the Momentum indicator heads south right below its midline, while the Relative Strength Index (RSI) indicator consolidates at around 48.
Support levels: 2,319.00 2,308.30 2,293.50
Resistance levels: 2,337.00 2,345.20 2,354.60
You have reached your limit of 5 free articles for this month.
Access all our articles, insights, and analysts.
Your coupon code
The slight downtick in the US Dollar (USD) motivated the USD Index (DXY) to keep its business around 105.80 on Tuesday, extending the consolidative mood so far this week.
This modest increase in the Greenback also prompted EUR/USD to maintain its trade in the 1.0730-1.0740 band in the first half of the week, as investors continued to digest the outcomes of the French election on June 30 as well as the policy discussion between President Christine Lagarde and Chair Jerome Powell at the ECB Forum in Sintra (Portugal).
Regarding this, Lagarde asserted that the euro zone has made significant progress along its path of disinflation, though uncertainties remain about the economic growth outlook. Meanwhile, Powell suggested that the Fed needs additional data before considering interest rate cuts, aiming to confirm whether recent subdued inflation readings truly reflect ongoing price pressures.
On a broader scale, the macroeconomic situation on both sides of the Atlantic remained stable. The European Central Bank (ECB) is contemplating further rate cuts beyond the summer, with market expectations pointing to two additional cuts later in the year. Supporting further rate cuts, preliminary inflation figures in the euro area saw the CPI rising by 2.5% YoY in June, while the Core CPI challenged expectations and advanced by 2.9% over the last twelve months.
In contrast, market participants are still debating whether the Federal Reserve (Fed) will implement one or two rate cuts this year in spite of the Fed’s projection of just one cut, likely in December.
The recent improvement in the US Dollar is partly due to hawkish comments from Fed officials, while the widening monetary policy gap between the Fed and other major central banks has also contributed to the euro’s decline.
According to the CME Group’s FedWatch Tool, there is about a 69% probability of lower interest rates in September, compared to nearly a 95% chance at the December 18 meeting.
In the short term, the recent ECB rate cut, contrasted with the Fed’s decision to maintain rates, has widened the policy gap between the two central banks, potentially leading to further weakness in EUR/USD.
However, the Eurozone’s emerging economic recovery and the perceived weakening of US fundamentals are expected to narrow this disparity, possibly providing occasional support for the pair in the near future.
On the political front, the next risk event for the single currency comes from the upcoming second round of the French snap elections due on July 7.
EUR/USD daily chart
If bears retake control, EUR/USD may retest its June low of 1.0666 (June 26), then the May low of 1.0649 (May 1), and lastly the 2024 low of 1.0601 (April 16).
Meanwhile, bouts of strength may put the pair on pace to revisit the 200-day SMA at 1.0791, prior to the weekly high of 1.0852 (June 12) and the June top of 1.0916 (June 4). The breakout of this level may put the March peak of 1.0981 (March 8) back into focus, ahead of the weekly high of 1.0998 (January 11) and the psychological 1.1000 mark.
So far, the 4-hour chart shows a loss of momentum in the initial bullish effort. The initial resistance level is 1.0776, followed by 1.0794. The initial support is at 1.0666, ahead of 1.0649 and 1.0601. The Relative Strength Index (RSI) climbed to about 56.
The slight downtick in the US Dollar (USD) motivated the USD Index (DXY) to keep its business around 105.80 on Tuesday, extending the consolidative mood so far this week.
This modest increase in the Greenback also prompted EUR/USD to maintain its trade in the 1.0730-1.0740 band in the first half of the week, as investors continued to digest the outcomes of the French election on June 30 as well as the policy discussion between President Christine Lagarde and Chair Jerome Powell at the ECB Forum in Sintra (Portugal).
Regarding this, Lagarde asserted that the euro zone has made significant progress along its path of disinflation, though uncertainties remain about the economic growth outlook. Meanwhile, Powell suggested that the Fed needs additional data before considering interest rate cuts, aiming to confirm whether recent subdued inflation readings truly reflect ongoing price pressures.
On a broader scale, the macroeconomic situation on both sides of the Atlantic remained stable. The European Central Bank (ECB) is contemplating further rate cuts beyond the summer, with market expectations pointing to two additional cuts later in the year. Supporting further rate cuts, preliminary inflation figures in the euro area saw the CPI rising by 2.5% YoY in June, while the Core CPI challenged expectations and advanced by 2.9% over the last twelve months.
In contrast, market participants are still debating whether the Federal Reserve (Fed) will implement one or two rate cuts this year in spite of the Fed’s projection of just one cut, likely in December.
The recent improvement in the US Dollar is partly due to hawkish comments from Fed officials, while the widening monetary policy gap between the Fed and other major central banks has also contributed to the euro’s decline.
According to the CME Group’s FedWatch Tool, there is about a 69% probability of lower interest rates in September, compared to nearly a 95% chance at the December 18 meeting.
In the short term, the recent ECB rate cut, contrasted with the Fed’s decision to maintain rates, has widened the policy gap between the two central banks, potentially leading to further weakness in EUR/USD.
However, the Eurozone’s emerging economic recovery and the perceived weakening of US fundamentals are expected to narrow this disparity, possibly providing occasional support for the pair in the near future.
On the political front, the next risk event for the single currency comes from the upcoming second round of the French snap elections due on July 7.
EUR/USD daily chart
If bears retake control, EUR/USD may retest its June low of 1.0666 (June 26), then the May low of 1.0649 (May 1), and lastly the 2024 low of 1.0601 (April 16).
Meanwhile, bouts of strength may put the pair on pace to revisit the 200-day SMA at 1.0791, prior to the weekly high of 1.0852 (June 12) and the June top of 1.0916 (June 4). The breakout of this level may put the March peak of 1.0981 (March 8) back into focus, ahead of the weekly high of 1.0998 (January 11) and the psychological 1.1000 mark.
So far, the 4-hour chart shows a loss of momentum in the initial bullish effort. The initial resistance level is 1.0776, followed by 1.0794. The initial support is at 1.0666, ahead of 1.0649 and 1.0601. The Relative Strength Index (RSI) climbed to about 56.
You have reached your limit of 5 free articles for this month.
Access all our articles, insights, and analysts.
Your coupon code
GBP/USD spike above 1.2700 and touched its highest level since June 20 in the American session on Monday. The pair lost its traction later in the day and closed virtually unchanged at 1.2650. The pair stays on the back foot on Tuesday and trades below the key technical level at 1.2640.
The table below shows the percentage change of British Pound (GBP) against listed major currencies today. British Pound was the weakest against the Canadian Dollar.
| USD | EUR | GBP | JPY | CAD | AUD | NZD | CHF | |
|---|---|---|---|---|---|---|---|---|
| USD | 0.21% | 0.09% | 0.11% | -0.05% | 0.10% | 0.34% | 0.15% | |
| EUR | -0.21% | -0.12% | -0.09% | -0.26% | -0.11% | 0.10% | -0.06% | |
| GBP | -0.09% | 0.12% | 0.04% | -0.14% | -0.02% | 0.23% | 0.04% | |
| JPY | -0.11% | 0.09% | -0.04% | -0.18% | -0.01% | 0.19% | 0.01% | |
| CAD | 0.05% | 0.26% | 0.14% | 0.18% | 0.15% | 0.39% | 0.17% | |
| AUD | -0.10% | 0.11% | 0.02% | 0.00% | -0.15% | 0.23% | 0.04% | |
| NZD | -0.34% | -0.10% | -0.23% | -0.19% | -0.39% | -0.23% | -0.19% | |
| CHF | -0.15% | 0.06% | -0.04% | -0.01% | -0.17% | -0.04% | 0.19% |
The heat map shows percentage changes of major currencies against each other. The base currency is picked from the left column, while the quote currency is picked from the top row. For example, if you pick the British Pound from the left column and move along the horizontal line to the US Dollar, the percentage change displayed in the box will represent GBP (base)/USD (quote).
The negative shift seen in risk sentiment helps the US Dollar (USD) find demand on Tuesday and doesn’t allow GBP/USD to stage a rebound. Reflecting the souring mood, US stock index futures are down between 0.3% and 0.5%.
In the second half of the day, Federal Reserve (Fed) Chairman Jerome Powell will speak on the policy outlook at the ECB Forum on Central Banking.
Markets currently price in a nearly 35% probability of the Fed leaving the policy rate unchanged in September, according to the CME FedWatch Tool. In case Powell acknowledges improving inflation outlook following last Friday’s Personal Consumption Expenditures (PCE) Price Index, the USD could have a hard time finding demand. On the other hand, the market positioning suggests that there is room for further USD strength if Powell pushes back against the market expectation for a rate reduction in September.
The 100-day and the 50-day Simple Moving Averages form a strong technical area at 1.2640. If this level stays intact, sellers could remain interested. On the downside, 1.2600 (psychological level, static level) could be seen as interim support before 1.2580 (Fibonacci 50% retracement of the latest uptrend) and 1.2520 (Fibonacci 61.8% retracement).
1.2640 aligns as first resistance. A daily close above this level could attract technical buyers. 1.2700 (20-day SMA, psychological level) and 1.2720 (Fibonacci 23.6% retracement) could be seen as next resistance levels.
The Pound Sterling (GBP) is the oldest currency in the world (886 AD) and the official currency of the United Kingdom. It is the fourth most traded unit for foreign exchange (FX) in the world, accounting for 12% of all transactions, averaging $630 billion a day, according to 2022 data. Its key trading pairs are GBP/USD, aka ‘Cable’, which accounts for 11% of FX, GBP/JPY, or the ‘Dragon’ as it is known by traders (3%), and EUR/GBP (2%). The Pound Sterling is issued by the Bank of England (BoE).
The single most important factor influencing the value of the Pound Sterling is monetary policy decided by the Bank of England. The BoE bases its decisions on whether it has achieved its primary goal of “price stability” – a steady inflation rate of around 2%. Its primary tool for achieving this is the adjustment of interest rates. When inflation is too high, the BoE will try to rein it in by raising interest rates, making it more expensive for people and businesses to access credit. This is generally positive for GBP, as higher interest rates make the UK a more attractive place for global investors to park their money. When inflation falls too low it is a sign economic growth is slowing. In this scenario, the BoE will consider lowering interest rates to cheapen credit so businesses will borrow more to invest in growth-generating projects.
Data releases gauge the health of the economy and can impact the value of the Pound Sterling. Indicators such as GDP, Manufacturing and Services PMIs, and employment can all influence the direction of the GBP. A strong economy is good for Sterling. Not only does it attract more foreign investment but it may encourage the BoE to put up interest rates, which will directly strengthen GBP. Otherwise, if economic data is weak, the Pound Sterling is likely to fall.
Another significant data release for the Pound Sterling is the Trade Balance. This indicator measures the difference between what a country earns from its exports and what it spends on imports over a given period. If a country produces highly sought-after exports, its currency will benefit purely from the extra demand created from foreign buyers seeking to purchase these goods. Therefore, a positive net Trade Balance strengthens a currency and vice versa for a negative balance.
GBP/USD spike above 1.2700 and touched its highest level since June 20 in the American session on Monday. The pair lost its traction later in the day and closed virtually unchanged at 1.2650. The pair stays on the back foot on Tuesday and trades below the key technical level at 1.2640.
The table below shows the percentage change of British Pound (GBP) against listed major currencies today. British Pound was the weakest against the Canadian Dollar.
| USD | EUR | GBP | JPY | CAD | AUD | NZD | CHF | |
|---|---|---|---|---|---|---|---|---|
| USD | 0.21% | 0.09% | 0.11% | -0.05% | 0.10% | 0.34% | 0.15% | |
| EUR | -0.21% | -0.12% | -0.09% | -0.26% | -0.11% | 0.10% | -0.06% | |
| GBP | -0.09% | 0.12% | 0.04% | -0.14% | -0.02% | 0.23% | 0.04% | |
| JPY | -0.11% | 0.09% | -0.04% | -0.18% | -0.01% | 0.19% | 0.01% | |
| CAD | 0.05% | 0.26% | 0.14% | 0.18% | 0.15% | 0.39% | 0.17% | |
| AUD | -0.10% | 0.11% | 0.02% | 0.00% | -0.15% | 0.23% | 0.04% | |
| NZD | -0.34% | -0.10% | -0.23% | -0.19% | -0.39% | -0.23% | -0.19% | |
| CHF | -0.15% | 0.06% | -0.04% | -0.01% | -0.17% | -0.04% | 0.19% |
The heat map shows percentage changes of major currencies against each other. The base currency is picked from the left column, while the quote currency is picked from the top row. For example, if you pick the British Pound from the left column and move along the horizontal line to the US Dollar, the percentage change displayed in the box will represent GBP (base)/USD (quote).
The negative shift seen in risk sentiment helps the US Dollar (USD) find demand on Tuesday and doesn’t allow GBP/USD to stage a rebound. Reflecting the souring mood, US stock index futures are down between 0.3% and 0.5%.
In the second half of the day, Federal Reserve (Fed) Chairman Jerome Powell will speak on the policy outlook at the ECB Forum on Central Banking.
Markets currently price in a nearly 35% probability of the Fed leaving the policy rate unchanged in September, according to the CME FedWatch Tool. In case Powell acknowledges improving inflation outlook following last Friday’s Personal Consumption Expenditures (PCE) Price Index, the USD could have a hard time finding demand. On the other hand, the market positioning suggests that there is room for further USD strength if Powell pushes back against the market expectation for a rate reduction in September.
The 100-day and the 50-day Simple Moving Averages form a strong technical area at 1.2640. If this level stays intact, sellers could remain interested. On the downside, 1.2600 (psychological level, static level) could be seen as interim support before 1.2580 (Fibonacci 50% retracement of the latest uptrend) and 1.2520 (Fibonacci 61.8% retracement).
1.2640 aligns as first resistance. A daily close above this level could attract technical buyers. 1.2700 (20-day SMA, psychological level) and 1.2720 (Fibonacci 23.6% retracement) could be seen as next resistance levels.
The Pound Sterling (GBP) is the oldest currency in the world (886 AD) and the official currency of the United Kingdom. It is the fourth most traded unit for foreign exchange (FX) in the world, accounting for 12% of all transactions, averaging $630 billion a day, according to 2022 data. Its key trading pairs are GBP/USD, aka ‘Cable’, which accounts for 11% of FX, GBP/JPY, or the ‘Dragon’ as it is known by traders (3%), and EUR/GBP (2%). The Pound Sterling is issued by the Bank of England (BoE).
The single most important factor influencing the value of the Pound Sterling is monetary policy decided by the Bank of England. The BoE bases its decisions on whether it has achieved its primary goal of “price stability” – a steady inflation rate of around 2%. Its primary tool for achieving this is the adjustment of interest rates. When inflation is too high, the BoE will try to rein it in by raising interest rates, making it more expensive for people and businesses to access credit. This is generally positive for GBP, as higher interest rates make the UK a more attractive place for global investors to park their money. When inflation falls too low it is a sign economic growth is slowing. In this scenario, the BoE will consider lowering interest rates to cheapen credit so businesses will borrow more to invest in growth-generating projects.
Data releases gauge the health of the economy and can impact the value of the Pound Sterling. Indicators such as GDP, Manufacturing and Services PMIs, and employment can all influence the direction of the GBP. A strong economy is good for Sterling. Not only does it attract more foreign investment but it may encourage the BoE to put up interest rates, which will directly strengthen GBP. Otherwise, if economic data is weak, the Pound Sterling is likely to fall.
Another significant data release for the Pound Sterling is the Trade Balance. This indicator measures the difference between what a country earns from its exports and what it spends on imports over a given period. If a country produces highly sought-after exports, its currency will benefit purely from the extra demand created from foreign buyers seeking to purchase these goods. Therefore, a positive net Trade Balance strengthens a currency and vice versa for a negative balance.
Natural Gas (NG) is trading at $2.46, marking a decrease of 0.44%. Analyzing the 2-hour chart, the current pivot point is precisely at $2.46. Resistance levels are set at $2.53, $2.59, and $2.64, respectively. On the downside, immediate support can be found at $2.42, with further support levels at $2.36 and $2.32.
In conclusion, the outlook for Natural Gas is bearish below $2.46. A move above this pivot could suggest a shift towards a more bullish trend, while failure to surpass it may reinforce bearish pressures.
WTI Oil Price Forecast
The USD/JPY price analysis shows a strong uptrend as the yen continues its slide due to the interest rate differential between Japan and the US. At the same time, economic data from Japan shows a small chance that the Bank of Japan will hike rates at the next policy meeting.
–Are you interested in learning more about forex conventions? Check our detailed guide-
The dollar continued its rally against the yen on Tuesday as the market focused on the wide interest rate gap between Japan and the US. Notably, data from Japan on Monday showed that the country downgraded its Q1 GDP figures, showing that the economy shrank more than reported. The economy contracted 2.9% annually, compared to the reported 1.8% decline.
These new figures complicate the outlook for rate hikes in Japan. A vulnerable economy could weaken further with high borrowing costs. However, if the Bank of Japan continues to delay rate hikes, the rate gap between Japan and the US will remain wide, hurting the yen.
At the same time, a rally in US Treasury yields weighed on the yen. Yields soared in the previous session, boosting the dollar as markets priced in the possibility of a Trump win. This came after last week’s debate, in which Trump came out stronger than Biden. A Trump government would likely lead to an increase in inflation, which would strengthen the dollar.
Meanwhile, investors are awaiting Fed Chair Powell’s speech later today for clues on the rate cut outlook. A cautious tone could further boost the dollar.
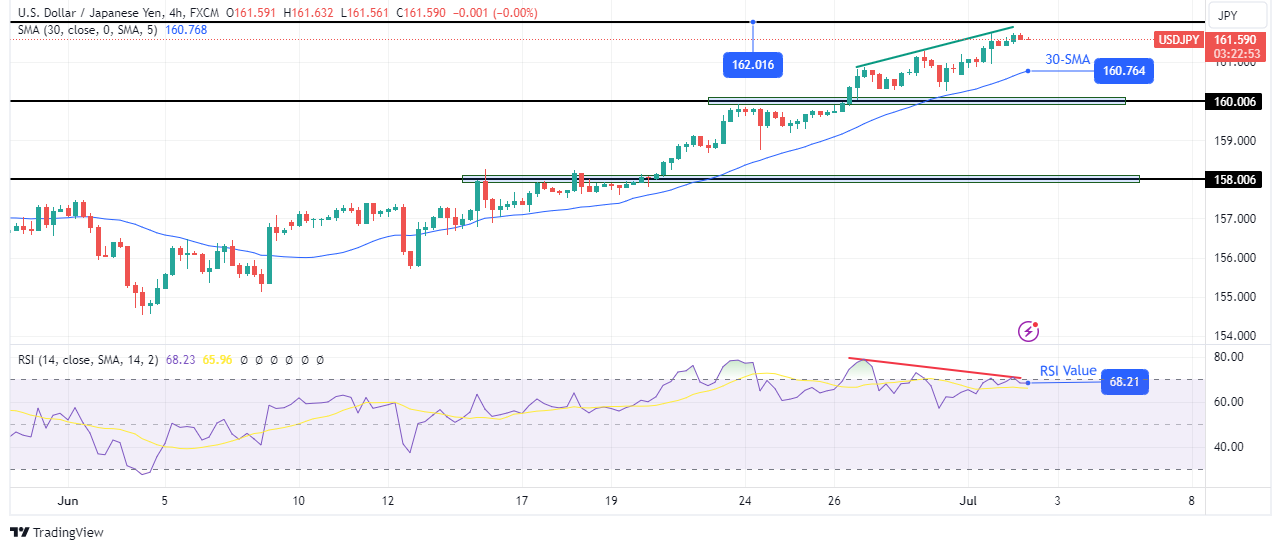
On the technical side, USD/JPY is quickly approaching the 162.01 level. The price is in a steep bullish trend, well above the 30-SMA. At the same time, the RSI trades near the overbought region, supporting bullish momentum.
–Are you interested in learning more about Ethereum price prediction? Check our detailed guide-
However, it has made a lower high while the price has made a higher high. This indicates a bearish divergence due to fading bullish momentum. Therefore, there is a high chance that the price will soon reverse. If this happens, it might retest the 30-SMA or break below to the 160.00 support level.
Looking to trade forex now? Invest at eToro!
68% of retail investor accounts lose money when trading CFDs with this provider. You should consider whether you can afford to take the high risk of losing your money.
You have reached your limit of 5 free articles for this month.
Access all our articles, insights, and analysts.
Your coupon code
Following a bullish opening to the week, EUR/USD climbed to its highest level in over two weeks above 1.0770 on Monday. The pair, however, lost its momentum and declined below 1.0750.
The table below shows the percentage change of Euro (EUR) against listed major currencies today. Euro was the weakest against the Canadian Dollar.
| USD | EUR | GBP | JPY | CAD | AUD | NZD | CHF | |
|---|---|---|---|---|---|---|---|---|
| USD | 0.25% | 0.16% | 0.10% | -0.02% | 0.18% | 0.37% | 0.18% | |
| EUR | -0.25% | -0.09% | -0.14% | -0.26% | -0.07% | 0.10% | -0.06% | |
| GBP | -0.16% | 0.09% | -0.04% | -0.16% | 0.00% | 0.20% | 0.01% | |
| JPY | -0.10% | 0.14% | 0.04% | -0.13% | 0.09% | 0.25% | 0.07% | |
| CAD | 0.02% | 0.26% | 0.16% | 0.13% | 0.20% | 0.39% | 0.20% | |
| AUD | -0.18% | 0.07% | 0.00% | -0.09% | -0.20% | 0.18% | -0.01% | |
| NZD | -0.37% | -0.10% | -0.20% | -0.25% | -0.39% | -0.18% | -0.19% | |
| CHF | -0.18% | 0.06% | -0.01% | -0.07% | -0.20% | 0.00% | 0.19% |
The heat map shows percentage changes of major currencies against each other. The base currency is picked from the left column, while the quote currency is picked from the top row. For example, if you pick the Euro from the left column and move along the horizontal line to the US Dollar, the percentage change displayed in the box will represent EUR (base)/USD (quote).
The Euro gathered strength to start the week as markets reacted to the outcome of the first round of France’s parliamentary election, as Marine Le Pen’s far-right National Rally (RN) party won by a smaller gap than initially projected. The positive impact of this development on the Euro’s valuation faded away later in the day, causing EUR/USD to erase its daily gains.
On Tuesday, the data published by Eurostat showed that the Harmonized Index of Consumer Prices, the European Central Bank’s (ECB) preferred gauge of inflation, rose 2.5% on a yearly basis in June, down from 2.6% in May. This reading came in line with the market expectation. In the same period, the core HICP, which excludes volatile food and energy prices, rose 2.9% to match May’s increase. These figures failed to trigger a noticeable market reaction.
Later in the day, ECB President Christine Lagarde and Federal Reserve (Fed) Chairman Jerome Powell will speak on policy outlook at the ECB Forum on Central Banking.
In case this event highlights the diverging monetary policies between the Fed and the ECB, EUR/USD could extend its slide in the American session. On the other hand, investors could continue to price in a September Fed rate cut and cause the USD could come under bearish pressure if Powell acknowledges improvements in inflation.
The Relative Strength Index (RSI) indicator on the 4-hour chart retreated below 50 in the European session on Tuesday, reflecting the loss of bullish momentum. On the downside, 1.0700 (static level, psychological level) aligns as immediate support before 1.0670 (Fibonacci 78.6% retracement of the latest uptrend) and 1.0600 (static level).
The 100-period Simple Moving Average (SMA) of the 4-hour chart could be seen as interim resistance at 1.0730 before 1.0780-1.0790 (100-day SMA, 200-day SMA).
Central Banks have a key mandate which is making sure that there is price stability in a country or region. Economies are constantly facing inflation or deflation when prices for certain goods and services are fluctuating. Constant rising prices for the same goods means inflation, constant lowered prices for the same goods means deflation. It is the task of the central bank to keep the demand in line by tweaking its policy rate. For the biggest central banks like the US Federal Reserve (Fed), the European Central Bank (ECB) or the Bank of England (BoE), the mandate is to keep inflation close to 2%.
A central bank has one important tool at its disposal to get inflation higher or lower, and that is by tweaking its benchmark policy rate, commonly known as interest rate. On pre-communicated moments, the central bank will issue a statement with its policy rate and provide additional reasoning on why it is either remaining or changing (cutting or hiking) it. Local banks will adjust their savings and lending rates accordingly, which in turn will make it either harder or easier for people to earn on their savings or for companies to take out loans and make investments in their businesses. When the central bank hikes interest rates substantially, this is called monetary tightening. When it is cutting its benchmark rate, it is called monetary easing.
A central bank is often politically independent. Members of the central bank policy board are passing through a series of panels and hearings before being appointed to a policy board seat. Each member in that board often has a certain conviction on how the central bank should control inflation and the subsequent monetary policy. Members that want a very loose monetary policy, with low rates and cheap lending, to boost the economy substantially while being content to see inflation slightly above 2%, are called ‘doves’. Members that rather want to see higher rates to reward savings and want to keep a lit on inflation at all time are called ‘hawks’ and will not rest until inflation is at or just below 2%.
Normally, there is a chairman or president who leads each meeting, needs to create a consensus between the hawks or doves and has his or her final say when it would come down to a vote split to avoid a 50-50 tie on whether the current policy should be adjusted. The chairman will deliver speeches which often can be followed live, where the current monetary stance and outlook is being communicated. A central bank will try to push forward its monetary policy without triggering violent swings in rates, equities, or its currency. All members of the central bank will channel their stance toward the markets in advance of a policy meeting event. A few days before a policy meeting takes place until the new policy has been communicated, members are forbidden to talk publicly. This is called the blackout period.
Following a bullish opening to the week, EUR/USD climbed to its highest level in over two weeks above 1.0770 on Monday. The pair, however, lost its momentum and declined below 1.0750.
The table below shows the percentage change of Euro (EUR) against listed major currencies today. Euro was the weakest against the Canadian Dollar.
| USD | EUR | GBP | JPY | CAD | AUD | NZD | CHF | |
|---|---|---|---|---|---|---|---|---|
| USD | 0.25% | 0.16% | 0.10% | -0.02% | 0.18% | 0.37% | 0.18% | |
| EUR | -0.25% | -0.09% | -0.14% | -0.26% | -0.07% | 0.10% | -0.06% | |
| GBP | -0.16% | 0.09% | -0.04% | -0.16% | 0.00% | 0.20% | 0.01% | |
| JPY | -0.10% | 0.14% | 0.04% | -0.13% | 0.09% | 0.25% | 0.07% | |
| CAD | 0.02% | 0.26% | 0.16% | 0.13% | 0.20% | 0.39% | 0.20% | |
| AUD | -0.18% | 0.07% | 0.00% | -0.09% | -0.20% | 0.18% | -0.01% | |
| NZD | -0.37% | -0.10% | -0.20% | -0.25% | -0.39% | -0.18% | -0.19% | |
| CHF | -0.18% | 0.06% | -0.01% | -0.07% | -0.20% | 0.00% | 0.19% |
The heat map shows percentage changes of major currencies against each other. The base currency is picked from the left column, while the quote currency is picked from the top row. For example, if you pick the Euro from the left column and move along the horizontal line to the US Dollar, the percentage change displayed in the box will represent EUR (base)/USD (quote).
The Euro gathered strength to start the week as markets reacted to the outcome of the first round of France’s parliamentary election, as Marine Le Pen’s far-right National Rally (RN) party won by a smaller gap than initially projected. The positive impact of this development on the Euro’s valuation faded away later in the day, causing EUR/USD to erase its daily gains.
On Tuesday, the data published by Eurostat showed that the Harmonized Index of Consumer Prices, the European Central Bank’s (ECB) preferred gauge of inflation, rose 2.5% on a yearly basis in June, down from 2.6% in May. This reading came in line with the market expectation. In the same period, the core HICP, which excludes volatile food and energy prices, rose 2.9% to match May’s increase. These figures failed to trigger a noticeable market reaction.
Later in the day, ECB President Christine Lagarde and Federal Reserve (Fed) Chairman Jerome Powell will speak on policy outlook at the ECB Forum on Central Banking.
In case this event highlights the diverging monetary policies between the Fed and the ECB, EUR/USD could extend its slide in the American session. On the other hand, investors could continue to price in a September Fed rate cut and cause the USD could come under bearish pressure if Powell acknowledges improvements in inflation.
The Relative Strength Index (RSI) indicator on the 4-hour chart retreated below 50 in the European session on Tuesday, reflecting the loss of bullish momentum. On the downside, 1.0700 (static level, psychological level) aligns as immediate support before 1.0670 (Fibonacci 78.6% retracement of the latest uptrend) and 1.0600 (static level).
The 100-period Simple Moving Average (SMA) of the 4-hour chart could be seen as interim resistance at 1.0730 before 1.0780-1.0790 (100-day SMA, 200-day SMA).
Central Banks have a key mandate which is making sure that there is price stability in a country or region. Economies are constantly facing inflation or deflation when prices for certain goods and services are fluctuating. Constant rising prices for the same goods means inflation, constant lowered prices for the same goods means deflation. It is the task of the central bank to keep the demand in line by tweaking its policy rate. For the biggest central banks like the US Federal Reserve (Fed), the European Central Bank (ECB) or the Bank of England (BoE), the mandate is to keep inflation close to 2%.
A central bank has one important tool at its disposal to get inflation higher or lower, and that is by tweaking its benchmark policy rate, commonly known as interest rate. On pre-communicated moments, the central bank will issue a statement with its policy rate and provide additional reasoning on why it is either remaining or changing (cutting or hiking) it. Local banks will adjust their savings and lending rates accordingly, which in turn will make it either harder or easier for people to earn on their savings or for companies to take out loans and make investments in their businesses. When the central bank hikes interest rates substantially, this is called monetary tightening. When it is cutting its benchmark rate, it is called monetary easing.
A central bank is often politically independent. Members of the central bank policy board are passing through a series of panels and hearings before being appointed to a policy board seat. Each member in that board often has a certain conviction on how the central bank should control inflation and the subsequent monetary policy. Members that want a very loose monetary policy, with low rates and cheap lending, to boost the economy substantially while being content to see inflation slightly above 2%, are called ‘doves’. Members that rather want to see higher rates to reward savings and want to keep a lit on inflation at all time are called ‘hawks’ and will not rest until inflation is at or just below 2%.
Normally, there is a chairman or president who leads each meeting, needs to create a consensus between the hawks or doves and has his or her final say when it would come down to a vote split to avoid a 50-50 tie on whether the current policy should be adjusted. The chairman will deliver speeches which often can be followed live, where the current monetary stance and outlook is being communicated. A central bank will try to push forward its monetary policy without triggering violent swings in rates, equities, or its currency. All members of the central bank will channel their stance toward the markets in advance of a policy meeting event. A few days before a policy meeting takes place until the new policy has been communicated, members are forbidden to talk publicly. This is called the blackout period.
Silver price (XAG/USD) halts its three-day winning streak, hovering around $29.30 per troy ounce during the European trading hours on Tuesday. The price of Silver faces the challenge of an improved US Dollar (USD), which could be attributed to the higher UST yields. Traders await Tuesday’s speech by Federal Reserve Chairman Jerome Powell to assess the monetary policy outlook.
The price of the grey metal may regain its ground as the recent US inflation data raised the expectations of the Federal Reserve (Fed) reducing interest rates in 2024. Lower interest rates could spark the demand of non-yielding assets like Silver.
On Friday, the US Bureau of Economic Analysis reported that recent US inflation eased to its lowest annual rate in over three years. The US Personal Consumption Expenditures (PCE) Price Index increased by 2.6% year-over-year in May, down from 2.7% in April. Meanwhile, Core PCE inflation rose by 2.6% year-over-year in May, down from 2.8% in April.
However, Federal Reserve Bank of San Francisco President Mary Daly remarked on Friday, “If inflation stays sticky or comes down slowly, rates would need to be higher for longer,” according to Reuters.
Demand uncertainties in China might contribute to the pressure on Silver prices after an official report indicated a second consecutive month of manufacturing downturn in June. China’s National Bureau of Statistics (NBS) reported that the Manufacturing PMI remained at 49.5.
Silver is a precious metal highly traded among investors. It has been historically used as a store of value and a medium of exchange. Although less popular than Gold, traders may turn to Silver to diversify their investment portfolio, for its intrinsic value or as a potential hedge during high-inflation periods. Investors can buy physical Silver, in coins or in bars, or trade it through vehicles such as Exchange Traded Funds, which track its price on international markets.
Silver prices can move due to a wide range of factors. Geopolitical instability or fears of a deep recession can make Silver price escalate due to its safe-haven status, although to a lesser extent than Gold’s. As a yieldless asset, Silver tends to rise with lower interest rates. Its moves also depend on how the US Dollar (USD) behaves as the asset is priced in dollars (XAG/USD). A strong Dollar tends to keep the price of Silver at bay, whereas a weaker Dollar is likely to propel prices up. Other factors such as investment demand, mining supply – Silver is much more abundant than Gold – and recycling rates can also affect prices.
Silver is widely used in industry, particularly in sectors such as electronics or solar energy, as it has one of the highest electric conductivity of all metals – more than Copper and Gold. A surge in demand can increase prices, while a decline tends to lower them. Dynamics in the US, Chinese and Indian economies can also contribute to price swings: for the US and particularly China, their big industrial sectors use Silver in various processes; in India, consumers’ demand for the precious metal for jewellery also plays a key role in setting prices.
Silver prices tend to follow Gold’s moves. When Gold prices rise, Silver typically follows suit, as their status as safe-haven assets is similar. The Gold/Silver ratio, which shows the number of ounces of Silver needed to equal the value of one ounce of Gold, may help to determine the relative valuation between both metals. Some investors may consider a high ratio as an indicator that Silver is undervalued, or Gold is overvalued. On the contrary, a low ratio might suggest that Gold is undervalued relative to Silver.