The main category of Forex News.
You can use the search box below to find what you need.
[wd_asp id=1]
The main category of Forex News.
You can use the search box below to find what you need.
[wd_asp id=1]
You have reached your limit of 5 free articles for this month.
Access all our articles, insights, and analysts.
Your coupon code
Spot Gold holds to familiar levels on Tuesday, with XAU/USD now retreating from an intraday high of $2,336.72 to trade just above the $2,320 mark. The bright metal turned south as the mood somehow improved in the American session following comments from Federal Reserve (Fed) Chairman Jerome Powell. Powell participated in a monetary policy panel at the 2024 ECB Forum on Central Banking in Sintra and noted the disinflation trend shows “signs of resuming.” However, he also said that the labor market is still strong, and that policymakers need to see more data like the one they have been seeing recently.
Meanwhile, Austan Goolsbee, President of the Federal Reserve (Fed) Bank of Chicago, also hit the wires in a different event and said he still thinks a soft landing is possible and that the ark of inflation is clearly down. As a result, stock markets trimmed most of their intraday losses, although Wall Street’s major indexes remain in the red. Nevertheless, decreased demand for safety weighed on Gold.
Speculative interest now focuses on United States (US) employment-related data. The country will release the Automatic Data Processing (ADP) Research Institute’s monthly report on private sector job creation for June and Challenger Job Cuts for the same month on Wednesday. The ADP report is expected to show that the private sector added 160K new positions in June, slightly above the 152K added in May. The reports could confirm or deny the case presented by Chair Powell about the labor market still being tight.
The daily chart for XAU/USD shows it hovers around a flat 20 Simple Moving Average (SMA) for a third consecutive day, while the longer moving averages keep heading north below the current level. A bullish 100 SMA provides dynamic support at around $2,261.50. Technical indicators, in the meantime, turned modestly lower at around their midlines, lacking clear directional strength.
In the near term, and according to the 4-hour chart, XAU/USD is bearish-to-neutral, as it rests above a flat 100 SMA, while the 20 SMA turned directionless just above the current level. At the same time, the Momentum indicator heads south right below its midline, while the Relative Strength Index (RSI) indicator consolidates at around 48.
Support levels: 2,319.00 2,308.30 2,293.50
Resistance levels: 2,337.00 2,345.20 2,354.60
Spot Gold holds to familiar levels on Tuesday, with XAU/USD now retreating from an intraday high of $2,336.72 to trade just above the $2,320 mark. The bright metal turned south as the mood somehow improved in the American session following comments from Federal Reserve (Fed) Chairman Jerome Powell. Powell participated in a monetary policy panel at the 2024 ECB Forum on Central Banking in Sintra and noted the disinflation trend shows “signs of resuming.” However, he also said that the labor market is still strong, and that policymakers need to see more data like the one they have been seeing recently.
Meanwhile, Austan Goolsbee, President of the Federal Reserve (Fed) Bank of Chicago, also hit the wires in a different event and said he still thinks a soft landing is possible and that the ark of inflation is clearly down. As a result, stock markets trimmed most of their intraday losses, although Wall Street’s major indexes remain in the red. Nevertheless, decreased demand for safety weighed on Gold.
Speculative interest now focuses on United States (US) employment-related data. The country will release the Automatic Data Processing (ADP) Research Institute’s monthly report on private sector job creation for June and Challenger Job Cuts for the same month on Wednesday. The ADP report is expected to show that the private sector added 160K new positions in June, slightly above the 152K added in May. The reports could confirm or deny the case presented by Chair Powell about the labor market still being tight.
The daily chart for XAU/USD shows it hovers around a flat 20 Simple Moving Average (SMA) for a third consecutive day, while the longer moving averages keep heading north below the current level. A bullish 100 SMA provides dynamic support at around $2,261.50. Technical indicators, in the meantime, turned modestly lower at around their midlines, lacking clear directional strength.
In the near term, and according to the 4-hour chart, XAU/USD is bearish-to-neutral, as it rests above a flat 100 SMA, while the 20 SMA turned directionless just above the current level. At the same time, the Momentum indicator heads south right below its midline, while the Relative Strength Index (RSI) indicator consolidates at around 48.
Support levels: 2,319.00 2,308.30 2,293.50
Resistance levels: 2,337.00 2,345.20 2,354.60
You have reached your limit of 5 free articles for this month.
Access all our articles, insights, and analysts.
Your coupon code
The slight downtick in the US Dollar (USD) motivated the USD Index (DXY) to keep its business around 105.80 on Tuesday, extending the consolidative mood so far this week.
This modest increase in the Greenback also prompted EUR/USD to maintain its trade in the 1.0730-1.0740 band in the first half of the week, as investors continued to digest the outcomes of the French election on June 30 as well as the policy discussion between President Christine Lagarde and Chair Jerome Powell at the ECB Forum in Sintra (Portugal).
Regarding this, Lagarde asserted that the euro zone has made significant progress along its path of disinflation, though uncertainties remain about the economic growth outlook. Meanwhile, Powell suggested that the Fed needs additional data before considering interest rate cuts, aiming to confirm whether recent subdued inflation readings truly reflect ongoing price pressures.
On a broader scale, the macroeconomic situation on both sides of the Atlantic remained stable. The European Central Bank (ECB) is contemplating further rate cuts beyond the summer, with market expectations pointing to two additional cuts later in the year. Supporting further rate cuts, preliminary inflation figures in the euro area saw the CPI rising by 2.5% YoY in June, while the Core CPI challenged expectations and advanced by 2.9% over the last twelve months.
In contrast, market participants are still debating whether the Federal Reserve (Fed) will implement one or two rate cuts this year in spite of the Fed’s projection of just one cut, likely in December.
The recent improvement in the US Dollar is partly due to hawkish comments from Fed officials, while the widening monetary policy gap between the Fed and other major central banks has also contributed to the euro’s decline.
According to the CME Group’s FedWatch Tool, there is about a 69% probability of lower interest rates in September, compared to nearly a 95% chance at the December 18 meeting.
In the short term, the recent ECB rate cut, contrasted with the Fed’s decision to maintain rates, has widened the policy gap between the two central banks, potentially leading to further weakness in EUR/USD.
However, the Eurozone’s emerging economic recovery and the perceived weakening of US fundamentals are expected to narrow this disparity, possibly providing occasional support for the pair in the near future.
On the political front, the next risk event for the single currency comes from the upcoming second round of the French snap elections due on July 7.
EUR/USD daily chart
If bears retake control, EUR/USD may retest its June low of 1.0666 (June 26), then the May low of 1.0649 (May 1), and lastly the 2024 low of 1.0601 (April 16).
Meanwhile, bouts of strength may put the pair on pace to revisit the 200-day SMA at 1.0791, prior to the weekly high of 1.0852 (June 12) and the June top of 1.0916 (June 4). The breakout of this level may put the March peak of 1.0981 (March 8) back into focus, ahead of the weekly high of 1.0998 (January 11) and the psychological 1.1000 mark.
So far, the 4-hour chart shows a loss of momentum in the initial bullish effort. The initial resistance level is 1.0776, followed by 1.0794. The initial support is at 1.0666, ahead of 1.0649 and 1.0601. The Relative Strength Index (RSI) climbed to about 56.
The slight downtick in the US Dollar (USD) motivated the USD Index (DXY) to keep its business around 105.80 on Tuesday, extending the consolidative mood so far this week.
This modest increase in the Greenback also prompted EUR/USD to maintain its trade in the 1.0730-1.0740 band in the first half of the week, as investors continued to digest the outcomes of the French election on June 30 as well as the policy discussion between President Christine Lagarde and Chair Jerome Powell at the ECB Forum in Sintra (Portugal).
Regarding this, Lagarde asserted that the euro zone has made significant progress along its path of disinflation, though uncertainties remain about the economic growth outlook. Meanwhile, Powell suggested that the Fed needs additional data before considering interest rate cuts, aiming to confirm whether recent subdued inflation readings truly reflect ongoing price pressures.
On a broader scale, the macroeconomic situation on both sides of the Atlantic remained stable. The European Central Bank (ECB) is contemplating further rate cuts beyond the summer, with market expectations pointing to two additional cuts later in the year. Supporting further rate cuts, preliminary inflation figures in the euro area saw the CPI rising by 2.5% YoY in June, while the Core CPI challenged expectations and advanced by 2.9% over the last twelve months.
In contrast, market participants are still debating whether the Federal Reserve (Fed) will implement one or two rate cuts this year in spite of the Fed’s projection of just one cut, likely in December.
The recent improvement in the US Dollar is partly due to hawkish comments from Fed officials, while the widening monetary policy gap between the Fed and other major central banks has also contributed to the euro’s decline.
According to the CME Group’s FedWatch Tool, there is about a 69% probability of lower interest rates in September, compared to nearly a 95% chance at the December 18 meeting.
In the short term, the recent ECB rate cut, contrasted with the Fed’s decision to maintain rates, has widened the policy gap between the two central banks, potentially leading to further weakness in EUR/USD.
However, the Eurozone’s emerging economic recovery and the perceived weakening of US fundamentals are expected to narrow this disparity, possibly providing occasional support for the pair in the near future.
On the political front, the next risk event for the single currency comes from the upcoming second round of the French snap elections due on July 7.
EUR/USD daily chart
If bears retake control, EUR/USD may retest its June low of 1.0666 (June 26), then the May low of 1.0649 (May 1), and lastly the 2024 low of 1.0601 (April 16).
Meanwhile, bouts of strength may put the pair on pace to revisit the 200-day SMA at 1.0791, prior to the weekly high of 1.0852 (June 12) and the June top of 1.0916 (June 4). The breakout of this level may put the March peak of 1.0981 (March 8) back into focus, ahead of the weekly high of 1.0998 (January 11) and the psychological 1.1000 mark.
So far, the 4-hour chart shows a loss of momentum in the initial bullish effort. The initial resistance level is 1.0776, followed by 1.0794. The initial support is at 1.0666, ahead of 1.0649 and 1.0601. The Relative Strength Index (RSI) climbed to about 56.
You have reached your limit of 5 free articles for this month.
Access all our articles, insights, and analysts.
Your coupon code
GBP/USD spike above 1.2700 and touched its highest level since June 20 in the American session on Monday. The pair lost its traction later in the day and closed virtually unchanged at 1.2650. The pair stays on the back foot on Tuesday and trades below the key technical level at 1.2640.
The table below shows the percentage change of British Pound (GBP) against listed major currencies today. British Pound was the weakest against the Canadian Dollar.
| USD | EUR | GBP | JPY | CAD | AUD | NZD | CHF | |
|---|---|---|---|---|---|---|---|---|
| USD | 0.21% | 0.09% | 0.11% | -0.05% | 0.10% | 0.34% | 0.15% | |
| EUR | -0.21% | -0.12% | -0.09% | -0.26% | -0.11% | 0.10% | -0.06% | |
| GBP | -0.09% | 0.12% | 0.04% | -0.14% | -0.02% | 0.23% | 0.04% | |
| JPY | -0.11% | 0.09% | -0.04% | -0.18% | -0.01% | 0.19% | 0.01% | |
| CAD | 0.05% | 0.26% | 0.14% | 0.18% | 0.15% | 0.39% | 0.17% | |
| AUD | -0.10% | 0.11% | 0.02% | 0.00% | -0.15% | 0.23% | 0.04% | |
| NZD | -0.34% | -0.10% | -0.23% | -0.19% | -0.39% | -0.23% | -0.19% | |
| CHF | -0.15% | 0.06% | -0.04% | -0.01% | -0.17% | -0.04% | 0.19% |
The heat map shows percentage changes of major currencies against each other. The base currency is picked from the left column, while the quote currency is picked from the top row. For example, if you pick the British Pound from the left column and move along the horizontal line to the US Dollar, the percentage change displayed in the box will represent GBP (base)/USD (quote).
The negative shift seen in risk sentiment helps the US Dollar (USD) find demand on Tuesday and doesn’t allow GBP/USD to stage a rebound. Reflecting the souring mood, US stock index futures are down between 0.3% and 0.5%.
In the second half of the day, Federal Reserve (Fed) Chairman Jerome Powell will speak on the policy outlook at the ECB Forum on Central Banking.
Markets currently price in a nearly 35% probability of the Fed leaving the policy rate unchanged in September, according to the CME FedWatch Tool. In case Powell acknowledges improving inflation outlook following last Friday’s Personal Consumption Expenditures (PCE) Price Index, the USD could have a hard time finding demand. On the other hand, the market positioning suggests that there is room for further USD strength if Powell pushes back against the market expectation for a rate reduction in September.
The 100-day and the 50-day Simple Moving Averages form a strong technical area at 1.2640. If this level stays intact, sellers could remain interested. On the downside, 1.2600 (psychological level, static level) could be seen as interim support before 1.2580 (Fibonacci 50% retracement of the latest uptrend) and 1.2520 (Fibonacci 61.8% retracement).
1.2640 aligns as first resistance. A daily close above this level could attract technical buyers. 1.2700 (20-day SMA, psychological level) and 1.2720 (Fibonacci 23.6% retracement) could be seen as next resistance levels.
The Pound Sterling (GBP) is the oldest currency in the world (886 AD) and the official currency of the United Kingdom. It is the fourth most traded unit for foreign exchange (FX) in the world, accounting for 12% of all transactions, averaging $630 billion a day, according to 2022 data. Its key trading pairs are GBP/USD, aka ‘Cable’, which accounts for 11% of FX, GBP/JPY, or the ‘Dragon’ as it is known by traders (3%), and EUR/GBP (2%). The Pound Sterling is issued by the Bank of England (BoE).
The single most important factor influencing the value of the Pound Sterling is monetary policy decided by the Bank of England. The BoE bases its decisions on whether it has achieved its primary goal of “price stability” – a steady inflation rate of around 2%. Its primary tool for achieving this is the adjustment of interest rates. When inflation is too high, the BoE will try to rein it in by raising interest rates, making it more expensive for people and businesses to access credit. This is generally positive for GBP, as higher interest rates make the UK a more attractive place for global investors to park their money. When inflation falls too low it is a sign economic growth is slowing. In this scenario, the BoE will consider lowering interest rates to cheapen credit so businesses will borrow more to invest in growth-generating projects.
Data releases gauge the health of the economy and can impact the value of the Pound Sterling. Indicators such as GDP, Manufacturing and Services PMIs, and employment can all influence the direction of the GBP. A strong economy is good for Sterling. Not only does it attract more foreign investment but it may encourage the BoE to put up interest rates, which will directly strengthen GBP. Otherwise, if economic data is weak, the Pound Sterling is likely to fall.
Another significant data release for the Pound Sterling is the Trade Balance. This indicator measures the difference between what a country earns from its exports and what it spends on imports over a given period. If a country produces highly sought-after exports, its currency will benefit purely from the extra demand created from foreign buyers seeking to purchase these goods. Therefore, a positive net Trade Balance strengthens a currency and vice versa for a negative balance.
GBP/USD spike above 1.2700 and touched its highest level since June 20 in the American session on Monday. The pair lost its traction later in the day and closed virtually unchanged at 1.2650. The pair stays on the back foot on Tuesday and trades below the key technical level at 1.2640.
The table below shows the percentage change of British Pound (GBP) against listed major currencies today. British Pound was the weakest against the Canadian Dollar.
| USD | EUR | GBP | JPY | CAD | AUD | NZD | CHF | |
|---|---|---|---|---|---|---|---|---|
| USD | 0.21% | 0.09% | 0.11% | -0.05% | 0.10% | 0.34% | 0.15% | |
| EUR | -0.21% | -0.12% | -0.09% | -0.26% | -0.11% | 0.10% | -0.06% | |
| GBP | -0.09% | 0.12% | 0.04% | -0.14% | -0.02% | 0.23% | 0.04% | |
| JPY | -0.11% | 0.09% | -0.04% | -0.18% | -0.01% | 0.19% | 0.01% | |
| CAD | 0.05% | 0.26% | 0.14% | 0.18% | 0.15% | 0.39% | 0.17% | |
| AUD | -0.10% | 0.11% | 0.02% | 0.00% | -0.15% | 0.23% | 0.04% | |
| NZD | -0.34% | -0.10% | -0.23% | -0.19% | -0.39% | -0.23% | -0.19% | |
| CHF | -0.15% | 0.06% | -0.04% | -0.01% | -0.17% | -0.04% | 0.19% |
The heat map shows percentage changes of major currencies against each other. The base currency is picked from the left column, while the quote currency is picked from the top row. For example, if you pick the British Pound from the left column and move along the horizontal line to the US Dollar, the percentage change displayed in the box will represent GBP (base)/USD (quote).
The negative shift seen in risk sentiment helps the US Dollar (USD) find demand on Tuesday and doesn’t allow GBP/USD to stage a rebound. Reflecting the souring mood, US stock index futures are down between 0.3% and 0.5%.
In the second half of the day, Federal Reserve (Fed) Chairman Jerome Powell will speak on the policy outlook at the ECB Forum on Central Banking.
Markets currently price in a nearly 35% probability of the Fed leaving the policy rate unchanged in September, according to the CME FedWatch Tool. In case Powell acknowledges improving inflation outlook following last Friday’s Personal Consumption Expenditures (PCE) Price Index, the USD could have a hard time finding demand. On the other hand, the market positioning suggests that there is room for further USD strength if Powell pushes back against the market expectation for a rate reduction in September.
The 100-day and the 50-day Simple Moving Averages form a strong technical area at 1.2640. If this level stays intact, sellers could remain interested. On the downside, 1.2600 (psychological level, static level) could be seen as interim support before 1.2580 (Fibonacci 50% retracement of the latest uptrend) and 1.2520 (Fibonacci 61.8% retracement).
1.2640 aligns as first resistance. A daily close above this level could attract technical buyers. 1.2700 (20-day SMA, psychological level) and 1.2720 (Fibonacci 23.6% retracement) could be seen as next resistance levels.
The Pound Sterling (GBP) is the oldest currency in the world (886 AD) and the official currency of the United Kingdom. It is the fourth most traded unit for foreign exchange (FX) in the world, accounting for 12% of all transactions, averaging $630 billion a day, according to 2022 data. Its key trading pairs are GBP/USD, aka ‘Cable’, which accounts for 11% of FX, GBP/JPY, or the ‘Dragon’ as it is known by traders (3%), and EUR/GBP (2%). The Pound Sterling is issued by the Bank of England (BoE).
The single most important factor influencing the value of the Pound Sterling is monetary policy decided by the Bank of England. The BoE bases its decisions on whether it has achieved its primary goal of “price stability” – a steady inflation rate of around 2%. Its primary tool for achieving this is the adjustment of interest rates. When inflation is too high, the BoE will try to rein it in by raising interest rates, making it more expensive for people and businesses to access credit. This is generally positive for GBP, as higher interest rates make the UK a more attractive place for global investors to park their money. When inflation falls too low it is a sign economic growth is slowing. In this scenario, the BoE will consider lowering interest rates to cheapen credit so businesses will borrow more to invest in growth-generating projects.
Data releases gauge the health of the economy and can impact the value of the Pound Sterling. Indicators such as GDP, Manufacturing and Services PMIs, and employment can all influence the direction of the GBP. A strong economy is good for Sterling. Not only does it attract more foreign investment but it may encourage the BoE to put up interest rates, which will directly strengthen GBP. Otherwise, if economic data is weak, the Pound Sterling is likely to fall.
Another significant data release for the Pound Sterling is the Trade Balance. This indicator measures the difference between what a country earns from its exports and what it spends on imports over a given period. If a country produces highly sought-after exports, its currency will benefit purely from the extra demand created from foreign buyers seeking to purchase these goods. Therefore, a positive net Trade Balance strengthens a currency and vice versa for a negative balance.
Natural Gas (NG) is trading at $2.46, marking a decrease of 0.44%. Analyzing the 2-hour chart, the current pivot point is precisely at $2.46. Resistance levels are set at $2.53, $2.59, and $2.64, respectively. On the downside, immediate support can be found at $2.42, with further support levels at $2.36 and $2.32.
In conclusion, the outlook for Natural Gas is bearish below $2.46. A move above this pivot could suggest a shift towards a more bullish trend, while failure to surpass it may reinforce bearish pressures.
WTI Oil Price Forecast
The USD/JPY price analysis shows a strong uptrend as the yen continues its slide due to the interest rate differential between Japan and the US. At the same time, economic data from Japan shows a small chance that the Bank of Japan will hike rates at the next policy meeting.
–Are you interested in learning more about forex conventions? Check our detailed guide-
The dollar continued its rally against the yen on Tuesday as the market focused on the wide interest rate gap between Japan and the US. Notably, data from Japan on Monday showed that the country downgraded its Q1 GDP figures, showing that the economy shrank more than reported. The economy contracted 2.9% annually, compared to the reported 1.8% decline.
These new figures complicate the outlook for rate hikes in Japan. A vulnerable economy could weaken further with high borrowing costs. However, if the Bank of Japan continues to delay rate hikes, the rate gap between Japan and the US will remain wide, hurting the yen.
At the same time, a rally in US Treasury yields weighed on the yen. Yields soared in the previous session, boosting the dollar as markets priced in the possibility of a Trump win. This came after last week’s debate, in which Trump came out stronger than Biden. A Trump government would likely lead to an increase in inflation, which would strengthen the dollar.
Meanwhile, investors are awaiting Fed Chair Powell’s speech later today for clues on the rate cut outlook. A cautious tone could further boost the dollar.
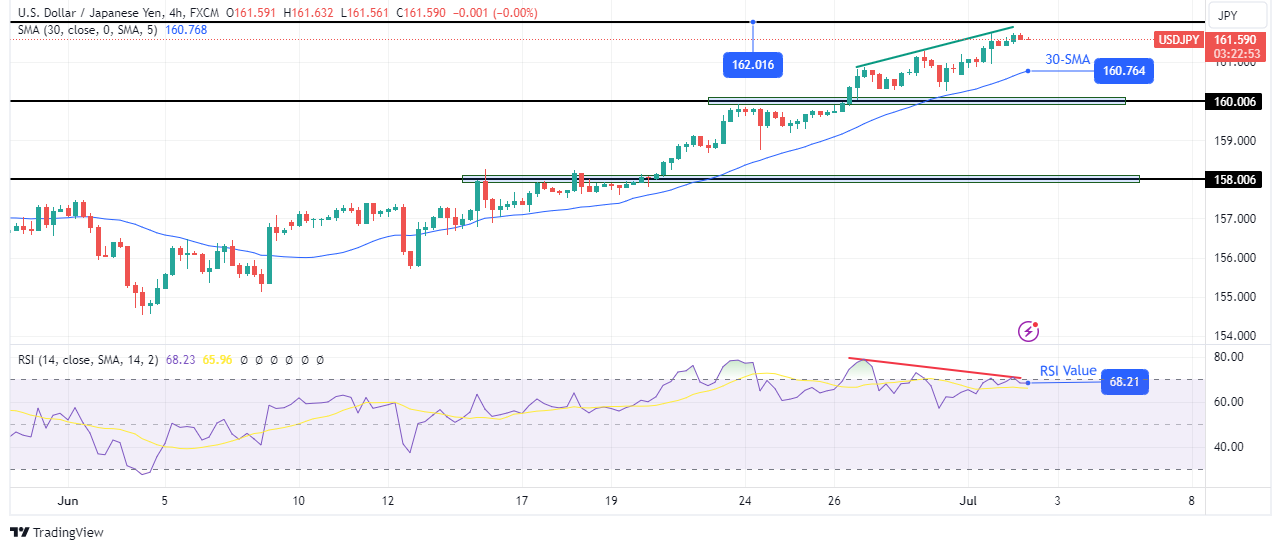
On the technical side, USD/JPY is quickly approaching the 162.01 level. The price is in a steep bullish trend, well above the 30-SMA. At the same time, the RSI trades near the overbought region, supporting bullish momentum.
–Are you interested in learning more about Ethereum price prediction? Check our detailed guide-
However, it has made a lower high while the price has made a higher high. This indicates a bearish divergence due to fading bullish momentum. Therefore, there is a high chance that the price will soon reverse. If this happens, it might retest the 30-SMA or break below to the 160.00 support level.
Looking to trade forex now? Invest at eToro!
68% of retail investor accounts lose money when trading CFDs with this provider. You should consider whether you can afford to take the high risk of losing your money.
You have reached your limit of 5 free articles for this month.
Access all our articles, insights, and analysts.
Your coupon code
Following a bullish opening to the week, EUR/USD climbed to its highest level in over two weeks above 1.0770 on Monday. The pair, however, lost its momentum and declined below 1.0750.
The table below shows the percentage change of Euro (EUR) against listed major currencies today. Euro was the weakest against the Canadian Dollar.
| USD | EUR | GBP | JPY | CAD | AUD | NZD | CHF | |
|---|---|---|---|---|---|---|---|---|
| USD | 0.25% | 0.16% | 0.10% | -0.02% | 0.18% | 0.37% | 0.18% | |
| EUR | -0.25% | -0.09% | -0.14% | -0.26% | -0.07% | 0.10% | -0.06% | |
| GBP | -0.16% | 0.09% | -0.04% | -0.16% | 0.00% | 0.20% | 0.01% | |
| JPY | -0.10% | 0.14% | 0.04% | -0.13% | 0.09% | 0.25% | 0.07% | |
| CAD | 0.02% | 0.26% | 0.16% | 0.13% | 0.20% | 0.39% | 0.20% | |
| AUD | -0.18% | 0.07% | 0.00% | -0.09% | -0.20% | 0.18% | -0.01% | |
| NZD | -0.37% | -0.10% | -0.20% | -0.25% | -0.39% | -0.18% | -0.19% | |
| CHF | -0.18% | 0.06% | -0.01% | -0.07% | -0.20% | 0.00% | 0.19% |
The heat map shows percentage changes of major currencies against each other. The base currency is picked from the left column, while the quote currency is picked from the top row. For example, if you pick the Euro from the left column and move along the horizontal line to the US Dollar, the percentage change displayed in the box will represent EUR (base)/USD (quote).
The Euro gathered strength to start the week as markets reacted to the outcome of the first round of France’s parliamentary election, as Marine Le Pen’s far-right National Rally (RN) party won by a smaller gap than initially projected. The positive impact of this development on the Euro’s valuation faded away later in the day, causing EUR/USD to erase its daily gains.
On Tuesday, the data published by Eurostat showed that the Harmonized Index of Consumer Prices, the European Central Bank’s (ECB) preferred gauge of inflation, rose 2.5% on a yearly basis in June, down from 2.6% in May. This reading came in line with the market expectation. In the same period, the core HICP, which excludes volatile food and energy prices, rose 2.9% to match May’s increase. These figures failed to trigger a noticeable market reaction.
Later in the day, ECB President Christine Lagarde and Federal Reserve (Fed) Chairman Jerome Powell will speak on policy outlook at the ECB Forum on Central Banking.
In case this event highlights the diverging monetary policies between the Fed and the ECB, EUR/USD could extend its slide in the American session. On the other hand, investors could continue to price in a September Fed rate cut and cause the USD could come under bearish pressure if Powell acknowledges improvements in inflation.
The Relative Strength Index (RSI) indicator on the 4-hour chart retreated below 50 in the European session on Tuesday, reflecting the loss of bullish momentum. On the downside, 1.0700 (static level, psychological level) aligns as immediate support before 1.0670 (Fibonacci 78.6% retracement of the latest uptrend) and 1.0600 (static level).
The 100-period Simple Moving Average (SMA) of the 4-hour chart could be seen as interim resistance at 1.0730 before 1.0780-1.0790 (100-day SMA, 200-day SMA).
Central Banks have a key mandate which is making sure that there is price stability in a country or region. Economies are constantly facing inflation or deflation when prices for certain goods and services are fluctuating. Constant rising prices for the same goods means inflation, constant lowered prices for the same goods means deflation. It is the task of the central bank to keep the demand in line by tweaking its policy rate. For the biggest central banks like the US Federal Reserve (Fed), the European Central Bank (ECB) or the Bank of England (BoE), the mandate is to keep inflation close to 2%.
A central bank has one important tool at its disposal to get inflation higher or lower, and that is by tweaking its benchmark policy rate, commonly known as interest rate. On pre-communicated moments, the central bank will issue a statement with its policy rate and provide additional reasoning on why it is either remaining or changing (cutting or hiking) it. Local banks will adjust their savings and lending rates accordingly, which in turn will make it either harder or easier for people to earn on their savings or for companies to take out loans and make investments in their businesses. When the central bank hikes interest rates substantially, this is called monetary tightening. When it is cutting its benchmark rate, it is called monetary easing.
A central bank is often politically independent. Members of the central bank policy board are passing through a series of panels and hearings before being appointed to a policy board seat. Each member in that board often has a certain conviction on how the central bank should control inflation and the subsequent monetary policy. Members that want a very loose monetary policy, with low rates and cheap lending, to boost the economy substantially while being content to see inflation slightly above 2%, are called ‘doves’. Members that rather want to see higher rates to reward savings and want to keep a lit on inflation at all time are called ‘hawks’ and will not rest until inflation is at or just below 2%.
Normally, there is a chairman or president who leads each meeting, needs to create a consensus between the hawks or doves and has his or her final say when it would come down to a vote split to avoid a 50-50 tie on whether the current policy should be adjusted. The chairman will deliver speeches which often can be followed live, where the current monetary stance and outlook is being communicated. A central bank will try to push forward its monetary policy without triggering violent swings in rates, equities, or its currency. All members of the central bank will channel their stance toward the markets in advance of a policy meeting event. A few days before a policy meeting takes place until the new policy has been communicated, members are forbidden to talk publicly. This is called the blackout period.
Following a bullish opening to the week, EUR/USD climbed to its highest level in over two weeks above 1.0770 on Monday. The pair, however, lost its momentum and declined below 1.0750.
The table below shows the percentage change of Euro (EUR) against listed major currencies today. Euro was the weakest against the Canadian Dollar.
| USD | EUR | GBP | JPY | CAD | AUD | NZD | CHF | |
|---|---|---|---|---|---|---|---|---|
| USD | 0.25% | 0.16% | 0.10% | -0.02% | 0.18% | 0.37% | 0.18% | |
| EUR | -0.25% | -0.09% | -0.14% | -0.26% | -0.07% | 0.10% | -0.06% | |
| GBP | -0.16% | 0.09% | -0.04% | -0.16% | 0.00% | 0.20% | 0.01% | |
| JPY | -0.10% | 0.14% | 0.04% | -0.13% | 0.09% | 0.25% | 0.07% | |
| CAD | 0.02% | 0.26% | 0.16% | 0.13% | 0.20% | 0.39% | 0.20% | |
| AUD | -0.18% | 0.07% | 0.00% | -0.09% | -0.20% | 0.18% | -0.01% | |
| NZD | -0.37% | -0.10% | -0.20% | -0.25% | -0.39% | -0.18% | -0.19% | |
| CHF | -0.18% | 0.06% | -0.01% | -0.07% | -0.20% | 0.00% | 0.19% |
The heat map shows percentage changes of major currencies against each other. The base currency is picked from the left column, while the quote currency is picked from the top row. For example, if you pick the Euro from the left column and move along the horizontal line to the US Dollar, the percentage change displayed in the box will represent EUR (base)/USD (quote).
The Euro gathered strength to start the week as markets reacted to the outcome of the first round of France’s parliamentary election, as Marine Le Pen’s far-right National Rally (RN) party won by a smaller gap than initially projected. The positive impact of this development on the Euro’s valuation faded away later in the day, causing EUR/USD to erase its daily gains.
On Tuesday, the data published by Eurostat showed that the Harmonized Index of Consumer Prices, the European Central Bank’s (ECB) preferred gauge of inflation, rose 2.5% on a yearly basis in June, down from 2.6% in May. This reading came in line with the market expectation. In the same period, the core HICP, which excludes volatile food and energy prices, rose 2.9% to match May’s increase. These figures failed to trigger a noticeable market reaction.
Later in the day, ECB President Christine Lagarde and Federal Reserve (Fed) Chairman Jerome Powell will speak on policy outlook at the ECB Forum on Central Banking.
In case this event highlights the diverging monetary policies between the Fed and the ECB, EUR/USD could extend its slide in the American session. On the other hand, investors could continue to price in a September Fed rate cut and cause the USD could come under bearish pressure if Powell acknowledges improvements in inflation.
The Relative Strength Index (RSI) indicator on the 4-hour chart retreated below 50 in the European session on Tuesday, reflecting the loss of bullish momentum. On the downside, 1.0700 (static level, psychological level) aligns as immediate support before 1.0670 (Fibonacci 78.6% retracement of the latest uptrend) and 1.0600 (static level).
The 100-period Simple Moving Average (SMA) of the 4-hour chart could be seen as interim resistance at 1.0730 before 1.0780-1.0790 (100-day SMA, 200-day SMA).
Central Banks have a key mandate which is making sure that there is price stability in a country or region. Economies are constantly facing inflation or deflation when prices for certain goods and services are fluctuating. Constant rising prices for the same goods means inflation, constant lowered prices for the same goods means deflation. It is the task of the central bank to keep the demand in line by tweaking its policy rate. For the biggest central banks like the US Federal Reserve (Fed), the European Central Bank (ECB) or the Bank of England (BoE), the mandate is to keep inflation close to 2%.
A central bank has one important tool at its disposal to get inflation higher or lower, and that is by tweaking its benchmark policy rate, commonly known as interest rate. On pre-communicated moments, the central bank will issue a statement with its policy rate and provide additional reasoning on why it is either remaining or changing (cutting or hiking) it. Local banks will adjust their savings and lending rates accordingly, which in turn will make it either harder or easier for people to earn on their savings or for companies to take out loans and make investments in their businesses. When the central bank hikes interest rates substantially, this is called monetary tightening. When it is cutting its benchmark rate, it is called monetary easing.
A central bank is often politically independent. Members of the central bank policy board are passing through a series of panels and hearings before being appointed to a policy board seat. Each member in that board often has a certain conviction on how the central bank should control inflation and the subsequent monetary policy. Members that want a very loose monetary policy, with low rates and cheap lending, to boost the economy substantially while being content to see inflation slightly above 2%, are called ‘doves’. Members that rather want to see higher rates to reward savings and want to keep a lit on inflation at all time are called ‘hawks’ and will not rest until inflation is at or just below 2%.
Normally, there is a chairman or president who leads each meeting, needs to create a consensus between the hawks or doves and has his or her final say when it would come down to a vote split to avoid a 50-50 tie on whether the current policy should be adjusted. The chairman will deliver speeches which often can be followed live, where the current monetary stance and outlook is being communicated. A central bank will try to push forward its monetary policy without triggering violent swings in rates, equities, or its currency. All members of the central bank will channel their stance toward the markets in advance of a policy meeting event. A few days before a policy meeting takes place until the new policy has been communicated, members are forbidden to talk publicly. This is called the blackout period.
Silver price (XAG/USD) halts its three-day winning streak, hovering around $29.30 per troy ounce during the European trading hours on Tuesday. The price of Silver faces the challenge of an improved US Dollar (USD), which could be attributed to the higher UST yields. Traders await Tuesday’s speech by Federal Reserve Chairman Jerome Powell to assess the monetary policy outlook.
The price of the grey metal may regain its ground as the recent US inflation data raised the expectations of the Federal Reserve (Fed) reducing interest rates in 2024. Lower interest rates could spark the demand of non-yielding assets like Silver.
On Friday, the US Bureau of Economic Analysis reported that recent US inflation eased to its lowest annual rate in over three years. The US Personal Consumption Expenditures (PCE) Price Index increased by 2.6% year-over-year in May, down from 2.7% in April. Meanwhile, Core PCE inflation rose by 2.6% year-over-year in May, down from 2.8% in April.
However, Federal Reserve Bank of San Francisco President Mary Daly remarked on Friday, “If inflation stays sticky or comes down slowly, rates would need to be higher for longer,” according to Reuters.
Demand uncertainties in China might contribute to the pressure on Silver prices after an official report indicated a second consecutive month of manufacturing downturn in June. China’s National Bureau of Statistics (NBS) reported that the Manufacturing PMI remained at 49.5.
Silver is a precious metal highly traded among investors. It has been historically used as a store of value and a medium of exchange. Although less popular than Gold, traders may turn to Silver to diversify their investment portfolio, for its intrinsic value or as a potential hedge during high-inflation periods. Investors can buy physical Silver, in coins or in bars, or trade it through vehicles such as Exchange Traded Funds, which track its price on international markets.
Silver prices can move due to a wide range of factors. Geopolitical instability or fears of a deep recession can make Silver price escalate due to its safe-haven status, although to a lesser extent than Gold’s. As a yieldless asset, Silver tends to rise with lower interest rates. Its moves also depend on how the US Dollar (USD) behaves as the asset is priced in dollars (XAG/USD). A strong Dollar tends to keep the price of Silver at bay, whereas a weaker Dollar is likely to propel prices up. Other factors such as investment demand, mining supply – Silver is much more abundant than Gold – and recycling rates can also affect prices.
Silver is widely used in industry, particularly in sectors such as electronics or solar energy, as it has one of the highest electric conductivity of all metals – more than Copper and Gold. A surge in demand can increase prices, while a decline tends to lower them. Dynamics in the US, Chinese and Indian economies can also contribute to price swings: for the US and particularly China, their big industrial sectors use Silver in various processes; in India, consumers’ demand for the precious metal for jewellery also plays a key role in setting prices.
Silver prices tend to follow Gold’s moves. When Gold prices rise, Silver typically follows suit, as their status as safe-haven assets is similar. The Gold/Silver ratio, which shows the number of ounces of Silver needed to equal the value of one ounce of Gold, may help to determine the relative valuation between both metals. Some investors may consider a high ratio as an indicator that Silver is undervalued, or Gold is overvalued. On the contrary, a low ratio might suggest that Gold is undervalued relative to Silver.
Short-term pullbacks should end up being buying opportunities and I would be very interested closer to the 203.50 level and area that we had broken above early during the session. After that, you have the 202 yen level and then the 200 yen level, both offering support and with the 50 day EMA racing towards the 200 yen level then I think you’ve got a situation where it does end up being like the perfect floor, if you will, for market memory is concerned. The 205 yen level above is a major barrier and did cause a little bit of a headache during the session, but really at this point it’s just yet another psychological barrier. It’s not really anything of significant importance.
I do think that the Bank of Japan is stuck and even if they do intervene, that’s only going to attract a lot of inflows because you can just pick up cheap British pounds. Really what the Japanese yen needs is everybody else to start cutting aggressively. We just don’t see that happening quite yet with inflation still relatively high around the world. With all of this being the case, the GBP/JPY pair continues to be one of my favorite trades in the overall markets, and as long as we see the same kind of interest rate situation, then I like the idea of being long, and at this point just don’t have any evidence of something changing anytime soon.
Ready to trade our Forex daily forecast? We’ve shortlisted the best regulated forex brokers UK in the industry for you.
The Euro rallied a bit during the course of the trading session on Monday to reach the crucial 0.85 level. The 0.85 level is an area that has been very important more than once, so therefore I think you need to be cognizant of the fact that it has a certain amount of “market memory” attached to it. Furthermore, we have the 50-Day EMA hanging around the same level, and that of course is a major influence on what happens next. We have pulled back from their rather aggressively, so it shows that there is quite a bit of selling pressure in that general vicinity.

That being said, if we can get a daily close above the 0.85 level, then I think we have an opportunity to pick up value on any short-term dip, and the main reason I say this is due to the fact that we had recently tested a major support level underneath, which is right around the 0.84 level. This is an area that people had paid attention to on longer-term charts via a monthly action, and perhaps even yearly. All things being equal, the idea that one of these currencies are actually going to suddenly take off against the other for a longer-term move is probably a bit of a stretch, mainly due to the fact that the US dollar is king at the moment, and I think it will continue to be so.
This brings me to the main reason to follow this pair, which of course is the fact that it can give you relative strength characterization of either the euro or the British pound, and then you can trade these currencies against the other ones using this information. In other words, both of them are weak against the US dollar, but the euro is weaker than the British pound, then the trade is to short the EUR/USD pair. This is a process called “triangulation”, that I have found to be very profitable over the longer term.
Ready to trade our EUR to GBP Forecast? We’ve made this forex brokers list for you to check out.
You have reached your limit of 5 free articles for this month.
Access all our articles, insights, and analysts.
Your coupon code
Gold price is looking to build on the previous upswing in the Asian session on Tuesday. Gold buyers, however, could turn cautious heading into the key US JOLTs Job Openings data and US Federal Reserve (Fed) Chair Jerome Powell’s speech later in the day.
Despite the upbeat momentum in Gold price, buyers seem to be struggling, as the US Dollar recovers overnight losses amid a softer risk tone. The Greenback also capitalizes on the fresh leg higher in the USD/JPY pair, as the Japanese Yen continues to fall toward the 162.00 mark.
The latest gains in Gold price could be attributed to a retreat in the US Treasury bond yields across the curve, as traders resort to profit-taking ahead of critical US event risks. The benchmark US 10-year Treasury bond yields pull back after facing resistance at the key 4.50% level.
Looking ahead, the expected decline in the US JOLTs Job Openings data to 7.9M in May from April’s 8.05M could provide signs of some loosening in the labor market, fanning September Fed rate cut expectations. Powell’s words, however, in the Policy Panel at the European Central Bank (ECB) Forum in Sintra are likely to play a pivotal role in the Gold price action.
Markets are currently pricing in a 64% chance of the Fed cutting interest rates in September and another cut in December, according to the CME Group’s FedWatch Tool.
On Monday, Gold price witnessed a good two-way price movement, initially trading with caution starting a big week. Gold price also took a hit after the US Dollar jumped notwithstanding the mixed US ISM Manufacturing PMI data. The ISM’s manufacturing PMI slipped to 48.5 last month from 48.7 in May. The ISM Manufacturing Price Paid sub-index also dropped sharply to 52.1 in June from May’s 57.0, missing the expected 55.9 print.
However, the uptick of the US Dollar was short-lived, as traders weighed the downbeat data, which supported the Fed’s bets for a policy pivot as early as September. The renewed US Dollar weakness helped Gold price stage a decent recovery, further aided by a short-covering by the shorter-term traders and some perceived bargain buying in the cash market.
With the 14-day Relative Strength Index (RSI) regaining the 50 level and Gold price closing Monday above the 21-day Simple Moving Average (SMA) at $2,328, buyers are back in the game.
However, they need to seek a daily candlestick closing above the immediate 50-day SMA barrier at $2,338 to resume the recovery from the monthly low of $2,287.
The next relevant upside barrier is aligned at the $2,350 psychological level, above which the two-week high of $2,369 could be challenged.
On the flip side, the 21-day SMA resistance-turned-support at $2,328 could offer immediate cushion. A sustained move below the latter will test the previous day’s low of $2,319.
Additional declines could threaten the $2,300 threshold, below which the $2,290 support area will come into play. Around that level, the previous week’s low and the June low hang around.
Jerome H. Powell took office as a member of the Board of Governors of the Federal Reserve System on May 25, 2012, to fill an unexpired term. On November 2, 2017, President Donald Trump nominated Powell to serve as the next Chairman of the Federal Reserve. Powell assumed office as Chair on February 5, 2018.
Read more.
Frequency: Irregular
Consensus: –
Previous: –
Source: Federal Reserve
Gold price is looking to build on the previous upswing in the Asian session on Tuesday. Gold buyers, however, could turn cautious heading into the key US JOLTs Job Openings data and US Federal Reserve (Fed) Chair Jerome Powell’s speech later in the day.
Despite the upbeat momentum in Gold price, buyers seem to be struggling, as the US Dollar recovers overnight losses amid a softer risk tone. The Greenback also capitalizes on the fresh leg higher in the USD/JPY pair, as the Japanese Yen continues to fall toward the 162.00 mark.
The latest gains in Gold price could be attributed to a retreat in the US Treasury bond yields across the curve, as traders resort to profit-taking ahead of critical US event risks. The benchmark US 10-year Treasury bond yields pull back after facing resistance at the key 4.50% level.
Looking ahead, the expected decline in the US JOLTs Job Openings data to 7.9M in May from April’s 8.05M could provide signs of some loosening in the labor market, fanning September Fed rate cut expectations. Powell’s words, however, in the Policy Panel at the European Central Bank (ECB) Forum in Sintra are likely to play a pivotal role in the Gold price action.
Markets are currently pricing in a 64% chance of the Fed cutting interest rates in September and another cut in December, according to the CME Group’s FedWatch Tool.
On Monday, Gold price witnessed a good two-way price movement, initially trading with caution starting a big week. Gold price also took a hit after the US Dollar jumped notwithstanding the mixed US ISM Manufacturing PMI data. The ISM’s manufacturing PMI slipped to 48.5 last month from 48.7 in May. The ISM Manufacturing Price Paid sub-index also dropped sharply to 52.1 in June from May’s 57.0, missing the expected 55.9 print.
However, the uptick of the US Dollar was short-lived, as traders weighed the downbeat data, which supported the Fed’s bets for a policy pivot as early as September. The renewed US Dollar weakness helped Gold price stage a decent recovery, further aided by a short-covering by the shorter-term traders and some perceived bargain buying in the cash market.
With the 14-day Relative Strength Index (RSI) regaining the 50 level and Gold price closing Monday above the 21-day Simple Moving Average (SMA) at $2,328, buyers are back in the game.
However, they need to seek a daily candlestick closing above the immediate 50-day SMA barrier at $2,338 to resume the recovery from the monthly low of $2,287.
The next relevant upside barrier is aligned at the $2,350 psychological level, above which the two-week high of $2,369 could be challenged.
On the flip side, the 21-day SMA resistance-turned-support at $2,328 could offer immediate cushion. A sustained move below the latter will test the previous day’s low of $2,319.
Additional declines could threaten the $2,300 threshold, below which the $2,290 support area will come into play. Around that level, the previous week’s low and the June low hang around.
Jerome H. Powell took office as a member of the Board of Governors of the Federal Reserve System on May 25, 2012, to fill an unexpired term. On November 2, 2017, President Donald Trump nominated Powell to serve as the next Chairman of the Federal Reserve. Powell assumed office as Chair on February 5, 2018.
Read more.
Frequency: Irregular
Consensus: –
Previous: –
Source: Federal Reserve