The main category of Forex News.
You can use the search box below to find what you need.
[wd_asp id=1]
The main category of Forex News.
You can use the search box below to find what you need.
[wd_asp id=1]
When you look at the chart, it doesn’t take a lot of imagination to see an ascending triangle, and typically those will resolve to the upside. Furthermore, you have to keep in mind that the interest rate differential continues to favor the United States, and that of course is a major driver of where this pair may go in the future. If we can break above the 158 yen level, that would obviously be a victory, but I think the real fight is beyond there, and it’s closer to the 160 yen, that seems to be the area that the Bank of Japan found intolerable and jumped into the market to intervene several weeks ago. On the downside, if we see the US dollar fall from here, I think the most obvious support level is close to the 155 yen level, not only due to the fact that it has shown itself to be resilient previously, but we also have the 50-day EMA hanging around that same general area.

With this, I think that would be a potentially excellent opportunity, assuming that we even get it. I have no interest in shorting this market, you have to pay swap to do so, and of course would be swimming upstream as it were as the trend is so obviously bullish. I’m a buyer of dips, I’m a holder of this pair, and will continue to be both. With that being the case, I do believe that this is still a very much “long term trade” just waiting to happen.
Want to trade our daily forex analysis and predictions? Here’s a list of forex brokers in Japan to check out.
Lower prices begin to put recent bullish activity at risk of failure. Although there could still be a brief drop lower in the short term, if a quick recovery follows it will put natural gas back in a position to progress its uptrend. The 61.8% Fibonacci retracement level is at 2.74. If the 20-Day line is busted, currently at 2.76, then natural gas will likely reach the 2.74 area.
If support is seen from there, followed by a recovery above the 20-Day line, the bullish price structure will be maintained. However, a drop below the 20-Day line where natural gas then stays below the line, will be short-term bearish. A failure of the bull pennant breakout is indicated on a drop below the center line at 2.70.
If a bullish setup completes today, then a decisive breakout above today’s high of 2.85 will be a sign of strength. Today’s candlestick pattern may take the form of a bull hammer candlestick pattern. A daily close in the top third of the day’s range will be a stronger indication than a close lower than the top third of the range. A decisive advance above today’s high would then be a sign of strength that should continue to higher prices.
Today’s decline in natural gas also triggered a bearish reversal on a weekly time frame. The weekly pattern last week was of a bearish shooting start candle. It triggered today on a drop below 2.86 and it will confirm on a daily close below that price level.
For a look at all of today’s economic events, check out our economic calendar.
You have reached your limit of 5 free articles for this month.
Access all our articles, insights, and analysts.
Your coupon code
The US Dollar (USD) started the week on the back foot, easing some ground following the strong rebound in the second half of last week. It is worth noting that this rebound was supported by the expectation that the Federal Reserve (Fed) will implement just one interest rate cut this year.
In this atmosphere, EUR/USD reversed its course, bouncing off multi-week lows near 1.0670 (June 14) despite political concerns on the old continent and mainly in France, which remained unabated.
Meanwhile, market participants continued to evaluate the hawkish hold by the Fed at its meeting on June 12, along with the rising expectations for a December rate cut, as indicated by the Committee on Wednesday. Regarding the latter, Neel Kashkari, the president of the Minneapolis Federal Reserve, said on Sunday that it is a “reasonable prediction” that the Fed will lower interest rates once this year, most likely delaying the action until December.
According to the CME Group’s FedWatch Tool, there is now nearly a 65% probability of lower interest rates by the September 18 meeting.
In the short term, the recent rate cut by the European Central Bank (ECB) compared to the Fed’s on-hold stance has widened the policy gap between the two central banks, potentially exposing EUR/USD to further weakness. However, in the longer term, the emerging economic recovery in the Eurozone, coupled with perceived slowdowns in the US economy, should help mitigate this disparity, providing some support to the pair.
Back at the ECB, Chief Economist Philip Lane stated that the full impact of earlier ECB rate rises on eurozone inflation has yet to be realised. He also stated that the present upheaval in eurozone bond markets, notably in France, is not chaotic, implying that ECB action is unnecessary. Lane emphasised the importance of a fall in service inflation momentum this year in validating the ECB’s disinflation story, while hinting that there will be minimal fresh material available before the July meeting. He is confident that inflation will return to the 2% target next year, despite some “noisy” inflation.
EUR/USD daily chart
The continuation of the downtrend could see EUR/USD revisit the June low of 1.0667 (June 14), prior to the May low of 1.0649 (May 1), and ultimately the 2024 bottom of 1.0601 (April 16).
Looking up, the 200-day SMA emerges first at 1.0788 ahead of the weekly high of 1.0852 (June 12), seconded by the June top of 1.0916 (June 4), and the March peak of 1.0981 (March 8). Further north aligns the weekly high of 1.0998 (January 11) before the crucial 1.1000 threshold.
The 4-hour chart thus far shows some incipient recovery. That said, bulls should aim for 1.0809 prior to 1.0852, then 1.0916 and 1.0942. Immediately to the downside comes 1.0667, preceding 1.0649 and 1.0601. The Relative Strength Index (RSI) settled around 43.
The US Dollar (USD) started the week on the back foot, easing some ground following the strong rebound in the second half of last week. It is worth noting that this rebound was supported by the expectation that the Federal Reserve (Fed) will implement just one interest rate cut this year.
In this atmosphere, EUR/USD reversed its course, bouncing off multi-week lows near 1.0670 (June 14) despite political concerns on the old continent and mainly in France, which remained unabated.
Meanwhile, market participants continued to evaluate the hawkish hold by the Fed at its meeting on June 12, along with the rising expectations for a December rate cut, as indicated by the Committee on Wednesday. Regarding the latter, Neel Kashkari, the president of the Minneapolis Federal Reserve, said on Sunday that it is a “reasonable prediction” that the Fed will lower interest rates once this year, most likely delaying the action until December.
According to the CME Group’s FedWatch Tool, there is now nearly a 65% probability of lower interest rates by the September 18 meeting.
In the short term, the recent rate cut by the European Central Bank (ECB) compared to the Fed’s on-hold stance has widened the policy gap between the two central banks, potentially exposing EUR/USD to further weakness. However, in the longer term, the emerging economic recovery in the Eurozone, coupled with perceived slowdowns in the US economy, should help mitigate this disparity, providing some support to the pair.
Back at the ECB, Chief Economist Philip Lane stated that the full impact of earlier ECB rate rises on eurozone inflation has yet to be realised. He also stated that the present upheaval in eurozone bond markets, notably in France, is not chaotic, implying that ECB action is unnecessary. Lane emphasised the importance of a fall in service inflation momentum this year in validating the ECB’s disinflation story, while hinting that there will be minimal fresh material available before the July meeting. He is confident that inflation will return to the 2% target next year, despite some “noisy” inflation.
EUR/USD daily chart
The continuation of the downtrend could see EUR/USD revisit the June low of 1.0667 (June 14), prior to the May low of 1.0649 (May 1), and ultimately the 2024 bottom of 1.0601 (April 16).
Looking up, the 200-day SMA emerges first at 1.0788 ahead of the weekly high of 1.0852 (June 12), seconded by the June top of 1.0916 (June 4), and the March peak of 1.0981 (March 8). Further north aligns the weekly high of 1.0998 (January 11) before the crucial 1.1000 threshold.
The 4-hour chart thus far shows some incipient recovery. That said, bulls should aim for 1.0809 prior to 1.0852, then 1.0916 and 1.0942. Immediately to the downside comes 1.0667, preceding 1.0649 and 1.0601. The Relative Strength Index (RSI) settled around 43.
You have reached your limit of 5 free articles for this month.
Access all our articles, insights, and analysts.
Your coupon code
XAU/USD came under selling pressure after Wall Street’s opening and trades near an intraday low of $2,309.84. The US Dollar was generally stronger throughout the Asian and European sessions as caution prevailed. China released mixed data at the beginning of the day, as May Industrial Production rose by 5.6% YoY, missing expectations, while Retail Sales in the same period were up 3.7%, beating estimates. The news fell short of boosting the market mood, which remained sour also during European trading hours amid political turmoil following far-right parties victory in the European Parlamentary election.
The optimistic tone of Wall Street, however, undermined demand for safe-haven assets. The US Dollar is down against most major rivals, while Gold loses ground against the USD. Firmer government bond yields add to XAU/USD slide, as the 10-year Treasury note offers 4.28%, up 7 basis points (bps), while the 2-year note yields 4.75%, also adding 7 bps.
Investors will now focus on Retail Sales, as the United States (US) will release May data on Tuesday. Sales are expected to have increased by a modest 0.2% in the month, improving from the previous 0% reading. The country will also release Industrial Production and Capacity Utilization for the same month.
The daily chart for XAU/USD shows a bearish 20 Simple Moving Average (SMA) that keeps attracting selling interest, providing dynamic resistance at around $2,340. The longer moving averages remain below the current level with bullish slopes, yet they are not close enough to be relevant. Finally, technical indicators aim lower within negative levels with limited downward momentum. Overall, the risk skews to the downside, yet the pair would need to pierce the June monthly low at 2,286.69 to signal a bearish continuation.
In the near term, and according to the 4-hour chart, XAU/USD is neutral-to-bearish. Gold trades below all its moving averages, although the 20 SMA is not far above the current level and flat, suggesting selling interest is limited. Technical indicators, in the meantime, turned marginally lower but remain within neutral levels.
Support levels: 2,298.10 2,286.70 2,271.90
Resistance levels: 2,321.55 2,333.10 2,340.00
XAU/USD came under selling pressure after Wall Street’s opening and trades near an intraday low of $2,309.84. The US Dollar was generally stronger throughout the Asian and European sessions as caution prevailed. China released mixed data at the beginning of the day, as May Industrial Production rose by 5.6% YoY, missing expectations, while Retail Sales in the same period were up 3.7%, beating estimates. The news fell short of boosting the market mood, which remained sour also during European trading hours amid political turmoil following far-right parties victory in the European Parlamentary election.
The optimistic tone of Wall Street, however, undermined demand for safe-haven assets. The US Dollar is down against most major rivals, while Gold loses ground against the USD. Firmer government bond yields add to XAU/USD slide, as the 10-year Treasury note offers 4.28%, up 7 basis points (bps), while the 2-year note yields 4.75%, also adding 7 bps.
Investors will now focus on Retail Sales, as the United States (US) will release May data on Tuesday. Sales are expected to have increased by a modest 0.2% in the month, improving from the previous 0% reading. The country will also release Industrial Production and Capacity Utilization for the same month.
The daily chart for XAU/USD shows a bearish 20 Simple Moving Average (SMA) that keeps attracting selling interest, providing dynamic resistance at around $2,340. The longer moving averages remain below the current level with bullish slopes, yet they are not close enough to be relevant. Finally, technical indicators aim lower within negative levels with limited downward momentum. Overall, the risk skews to the downside, yet the pair would need to pierce the June monthly low at 2,286.69 to signal a bearish continuation.
In the near term, and according to the 4-hour chart, XAU/USD is neutral-to-bearish. Gold trades below all its moving averages, although the 20 SMA is not far above the current level and flat, suggesting selling interest is limited. Technical indicators, in the meantime, turned marginally lower but remain within neutral levels.
Support levels: 2,298.10 2,286.70 2,271.90
Resistance levels: 2,321.55 2,333.10 2,340.00
It’s probably worth noting that the Swiss franc is probably going to pick up a little bit of momentum anyway, due to the fact that it is considered to be a safety currency. We are in the midst of a lot of geopolitical tensions, and that of course helps the Swiss franc. Furthermore, the European Union seems to be falling apart, and the European central bank has recently cut rates. While the Swiss National Bank has done the same, the reality is that traders are used to low rates in Switzerland as in is more or less considered to be a place where you park your money for safety.
The fact that we made a fresh, new high and broke above the 176 yen level is a very big deal. That we are going to continue to see momentum jumping into this market, and although this is one of the slower moving yen denominated pairs, I like to look at this chart as a bit of an indication as to where funding currencies may go over the next several sessions. As it looks right now, I suspect that the Japanese yen is about to face another round of pressure, and although I’m not necessarily keen on the Swiss franc itself, I would much rather own it than the Japanese yen, as seen on this chart. With this, I continue to buy short-term dips, as they offer a bit of value.
Ready to trade our Forex daily forecast? We’ve shortlisted the best forex broker list for you to check out.
Monday’s economic reports from China painted a mixed picture. Retail sales exceeded forecasts due to a holiday boost, but other key metrics, including industrial output and fixed-asset investment, indicated slower growth. Additionally, oil refining activity in China fell to its lowest rate this year due to maintenance shutdowns, raising concerns about the country’s overall demand for crude.
Global benchmark Brent crude futures were slightly up . West Texas Intermediate (WTI) crude futures edged higher. This performance comes after both benchmarks posted their first weekly gains in a month, driven by expectations of a significant drop in oil inventories with the onset of the summer driving season.
Last week, reports from OPEC and the International Energy Agency (IEA) provided some optimism, despite differing views on the strength of oil demand growth for the remainder of the year. OPEC’s forecast for robust demand in 2024 has faced skepticism due to its vested interests, while the IEA’s more conservative outlook suggests a need for strong economic recovery in China to sustain demand growth.
The recent drop in U.S. consumer sentiment to a seven-month low in June has also added a bearish sentiment to the market, raising doubts about the resilience of American consumer spending amid rising interest rates and cost-of-living pressures. Additionally, geopolitical tensions remain a concern, with potential for escalation in the Middle East following increased cross-border fire between Israel and Lebanon’s Hezbollah.
Given the current balance of positive and negative influences, the short-term outlook for oil prices remains cautiously bullish. The anticipated increase in demand from the summer driving season and potential inventory drawdowns support a positive trend. However, continued weak economic performance in China and global geopolitical risks could limit significant price advances. Traders should monitor Chinese economic data closely, as any signs of stronger recovery could provide further support for oil prices.
Important DisclaimersThe content provided on the website includes general news and publications, our personal analysis and opinions, and contents provided by third parties, which are intended for educational and research purposes only. It does not constitute, and should not be read as, any recommendation or advice to take any action whatsoever, including to make any investment or buy any product. When making any financial decision, you should perform your own due diligence checks, apply your own discretion and consult your competent advisors. The content of the website is not personally directed to you, and we does not take into account your financial situation or needs.The information contained in this website is not necessarily provided in real-time nor is it necessarily accurate. Prices provided herein may be provided by market makers and not by exchanges.Any trading or other financial decision you make shall be at your full responsibility, and you must not rely on any information provided through the website. FX Empire does not provide any warranty regarding any of the information contained in the website, and shall bear no responsibility for any trading losses you might incur as a result of using any information contained in the website.The website may include advertisements and other promotional contents, and FX Empire may receive compensation from third parties in connection with the content. FX Empire does not endorse any third party or recommends using any third party’s services, and does not assume responsibility for your use of any such third party’s website or services.FX Empire and its employees, officers, subsidiaries and associates, are not liable nor shall they be held liable for any loss or damage resulting from your use of the website or reliance on the information provided on this website.Risk DisclaimersThis website includes information about cryptocurrencies, contracts for difference (CFDs) and other financial instruments, and about brokers, exchanges and other entities trading in such instruments. Both cryptocurrencies and CFDs are complex instruments and come with a high risk of losing money. You should carefully consider whether you understand how these instruments work and whether you can afford to take the high risk of losing your money.FX Empire encourages you to perform your own research before making any investment decision, and to avoid investing in any financial instrument which you do not fully understand how it works and what are the risks involved.
You have reached your limit of 5 free articles for this month.
Access all our articles, insights, and analysts.
Your coupon code
The EUR/USD pair trades at around 1.0710 ahead of the United States (US) opening, marginally higher at the beginning of the week. The pair advances despite the US Dollar retaining its latest strength against other major rivals and European political turmoil. Following French President Emmanuel Macron’s call for a snap election, the Marine le Pen far-right party continues to lead surveys. Le Pen said that should her party win parliamentary elections, she will not seek President Emmanuel Macron’s resignation. “I’m respectful of institutions; I do not call for institutional chaos,” Le Pen told local media.
Meanwhile, European Central Bank (ECB) President Christine Lagarde said that the ECB pays close attention to the smooth functioning of financial markets at an event in France, subtly referring to the French snap elections coming on June 30.
Data-wise, the Eurozone released Q1 Labor Cost, which rose 5.1%, much higher than the previous 3.4% and above the 4.9% expected. Across the pond, the US published the New York Empire State Manufacturing Index, which improved to -6 in June from -15.6 in the previous month.
From a technical point of view, EUR/USD is at risk of falling further. The pair hovers around Friday’s close, and the daily chart shows it remains below all its moving averages, with the 20 Simple Moving Average (SMA) gaining downward traction above directionless 100 and 200 SMAs. Furthermore, technical indicators consolidate within negative levels without signs of a certain directional interest.
In the near term, and according to the 4-hour chart, the chance of an upward extension seems limited. Technical indicators recovered from oversold readings, but their bullish momentum is limited while they remain far below their midlines. Finally, a firmly bearish 20 SMA extends its slide below the longer ones, providing dynamic resistance at around 1.0750.
Support levels: 1.0710 1.0665 1.0620
Resistance levels: 1.0750 1.0800 1.0840
The EUR/USD pair trades at around 1.0710 ahead of the United States (US) opening, marginally higher at the beginning of the week. The pair advances despite the US Dollar retaining its latest strength against other major rivals and European political turmoil. Following French President Emmanuel Macron’s call for a snap election, the Marine le Pen far-right party continues to lead surveys. Le Pen said that should her party win parliamentary elections, she will not seek President Emmanuel Macron’s resignation. “I’m respectful of institutions; I do not call for institutional chaos,” Le Pen told local media.
Meanwhile, European Central Bank (ECB) President Christine Lagarde said that the ECB pays close attention to the smooth functioning of financial markets at an event in France, subtly referring to the French snap elections coming on June 30.
Data-wise, the Eurozone released Q1 Labor Cost, which rose 5.1%, much higher than the previous 3.4% and above the 4.9% expected. Across the pond, the US published the New York Empire State Manufacturing Index, which improved to -6 in June from -15.6 in the previous month.
From a technical point of view, EUR/USD is at risk of falling further. The pair hovers around Friday’s close, and the daily chart shows it remains below all its moving averages, with the 20 Simple Moving Average (SMA) gaining downward traction above directionless 100 and 200 SMAs. Furthermore, technical indicators consolidate within negative levels without signs of a certain directional interest.
In the near term, and according to the 4-hour chart, the chance of an upward extension seems limited. Technical indicators recovered from oversold readings, but their bullish momentum is limited while they remain far below their midlines. Finally, a firmly bearish 20 SMA extends its slide below the longer ones, providing dynamic resistance at around 1.0750.
Support levels: 1.0710 1.0665 1.0620
Resistance levels: 1.0750 1.0800 1.0840
For its part, the Bank of Japan kept interest rates at 0.1% at its last policy meeting, in line with consensus expectations. However, there were expectations that the BoJ would decide to limit bond purchases at this meeting, especially since Governor Ueda hinted that this was a possibility in a speech he gave last week. In this case, there were no changes to the bond purchases, which again confused the market and exposed the Japanese yen to another round of violent selling. However, the Bank of Japan stated that its plans to reduce purchases over the next year or two will be presented at the policy meeting in July.
Commenting on the performance of reliable trading platforms, Christopher Wong, FX analyst at OCBC, said, “The yen is suffering after there was a perception that the BoJ is in no hurry to normalize policy. USD/JPY is likely to challenge its previous high of 160, and this is likely to see increased risks of intervention. But intervention, at best, is an option to slow the pace. of consumption and not a tool to reverse the trend.”
He added, “For USD/JPY to retreat more decisively, it would require dollar friendliness or for the BoJ to signal an intention to normalize urgently. Neither of these seems to be happening, and the path of least resistance for USD/JPY is up.”
In general, investment banks have been discussing the BoJ’s tactics on interest rates and bond buying. Norihiro Yamaguchi, chief Japan economist at Oxford Economics, commented, “The BoJ was unlikely to react to the recent yen weakness by raising interest rates, as it would put them in the position of a ‘dog chasing its own tail’, as Alan Blinder put it. If they did react, the market would have expected them to do so. To do the same next time.”
Danske Bank, for its part, pointed to economic weakness: “Regardless of the decision, Japan is too fragile to raise interest rates now with the economy stagnating and price pressures low. Therefore, we expect the next rate hike to happen in September or October, when the economy has recovered a bit and consumers are regaining some purchasing power.” According to Kohei Okazaki, chief economist at Nomura Securities, “My first impression is that the BoJ is buying time. If Japanese government bonds are cut easily under these circumstances, there is a possibility of creating an environment where markets will be under pressure from anticipation.” The Bank of Japan has taken measures to ward off such pressures.
According to the performance on the daily chart, the general trend of the USD/JPY price is upward and the chance of returning to the psychological resistance level of 160.00 is strong, through which the technical indicators will move towards strong overbought levels. Consequently, there will be more talk about an imminent Japanese intervention in the Forex currency markets to prevent further collapse of the currency exchange rate, which harms the Japanese economy.
Want to trade our daily forex analysis and predictions? Here’s a list of forex brokers in Japan to check out.
The EUR/USD forecast points to a bearish trend as the euro lingers near a recent low reached last week due to political uncertainty in the Eurozone. At the same time, investors were waiting for more data this week to give clues on the outlook for Fed rate cuts.
–Are you interested in learning more about Bitcoin price prediction? Check our detailed guide-
The announcement of a snap election in France has caused considerable turmoil in the Eurozone. Investors are concerned that a new government would worsen the country’s financial state. This has weighed on the euro and boosted the US dollar.
At the same time, the ECB has remained quiet about supporting French markets, which have sold off since the announcement. This uncertainty will likely keep the euro on the back foot for some time.
On the other hand, the dollar has remained strong as safe-haven demand rises with the uncertainty in the Eurozone. Moreover, markets are still absorbing Fed forecasts for one rate cut this year in December. Notably, on Sunday, Fed’s Neel Kashkari supported this outlook, saying it was reasonable to cut rates once. This has reversed moves after softer-than-expected US inflation.
Nevertheless, market participants are pricing in the possibility of a rate cut in September since the economy is showing signs of slowing down. A survey on Friday showed a significant decline in US consumer sentiment amid inflation concerns. Meanwhile, another report showed a decrease in US import prices, supporting the view that inflation is easing. Traders are awaiting data on retail sales and flash PMIs later this week.
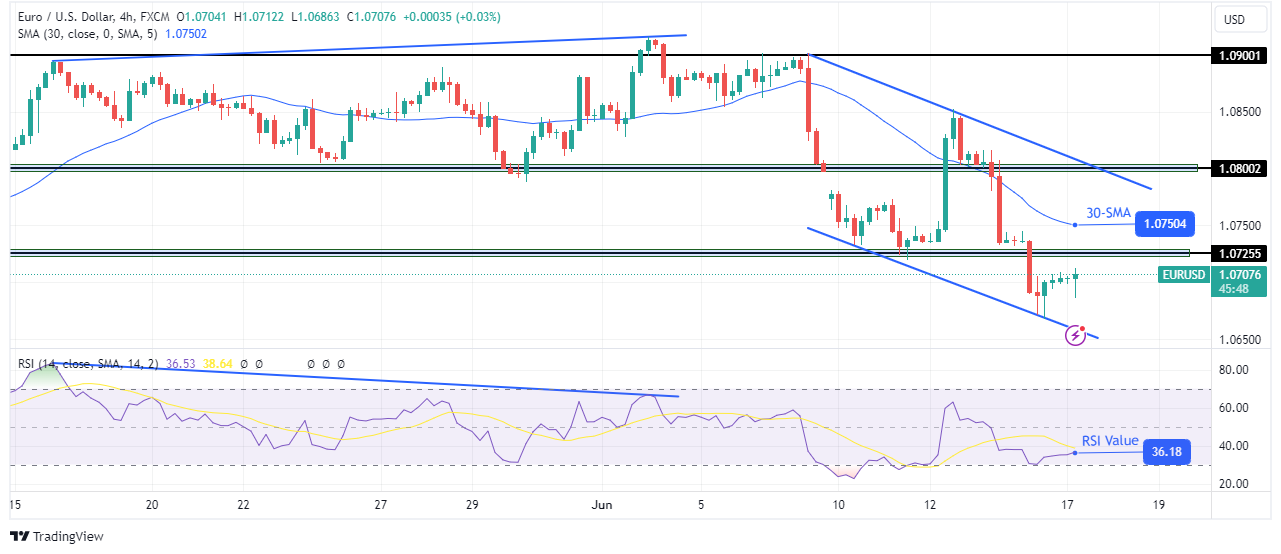
On the technical side, the EUR/USD price is in a bearish trend after breaking out of its consolidation area. Previously, it had been caught between the 1.0800 support and the 1.0900 resistance level. However, when bulls tried to break out of the range, they failed and the RSI made a bearish divergence, indicating weaker bullish momentum.
–Are you interested in learning more about forex basics? Check our detailed guide-
After this, bears took over with enough strength to break below the 1.0800 range support. Currently, the price is trading in a new bearish channel. Furthermore, bears recently broke below the 1.0725 critical level, a sign that the price could continue lower.
Looking to trade forex now? Invest at eToro!
68% of retail investor accounts lose money when trading CFDs with this provider. You should consider whether you can afford to take the high risk of losing your money.