Category: Forex News, News
Next on the upside comes the 200-day SMA
You have reached your limit of 5 free articles for this month.
Get Premium without limits for only $479.76 for the first month
Access all our articles, insights, and analysts. Your coupon code
UNLOCK OFFER
- EUR/USD regains some upside traction after recent sharp losses.
- The US Dollar faced some renewed selling interest.
- Investors continue to see the Fed cutting rates twice this year.
The US Dollar (USD) started the week on the back foot, easing some ground following the strong rebound in the second half of last week. It is worth noting that this rebound was supported by the expectation that the Federal Reserve (Fed) will implement just one interest rate cut this year.
In this atmosphere, EUR/USD reversed its course, bouncing off multi-week lows near 1.0670 (June 14) despite political concerns on the old continent and mainly in France, which remained unabated.
Meanwhile, market participants continued to evaluate the hawkish hold by the Fed at its meeting on June 12, along with the rising expectations for a December rate cut, as indicated by the Committee on Wednesday. Regarding the latter, Neel Kashkari, the president of the Minneapolis Federal Reserve, said on Sunday that it is a “reasonable prediction” that the Fed will lower interest rates once this year, most likely delaying the action until December.
According to the CME Group’s FedWatch Tool, there is now nearly a 65% probability of lower interest rates by the September 18 meeting.
In the short term, the recent rate cut by the European Central Bank (ECB) compared to the Fed’s on-hold stance has widened the policy gap between the two central banks, potentially exposing EUR/USD to further weakness. However, in the longer term, the emerging economic recovery in the Eurozone, coupled with perceived slowdowns in the US economy, should help mitigate this disparity, providing some support to the pair.
Back at the ECB, Chief Economist Philip Lane stated that the full impact of earlier ECB rate rises on eurozone inflation has yet to be realised. He also stated that the present upheaval in eurozone bond markets, notably in France, is not chaotic, implying that ECB action is unnecessary. Lane emphasised the importance of a fall in service inflation momentum this year in validating the ECB’s disinflation story, while hinting that there will be minimal fresh material available before the July meeting. He is confident that inflation will return to the 2% target next year, despite some “noisy” inflation.
EUR/USD daily chart
EUR/USD short-term technical outlook
The continuation of the downtrend could see EUR/USD revisit the June low of 1.0667 (June 14), prior to the May low of 1.0649 (May 1), and ultimately the 2024 bottom of 1.0601 (April 16).
Looking up, the 200-day SMA emerges first at 1.0788 ahead of the weekly high of 1.0852 (June 12), seconded by the June top of 1.0916 (June 4), and the March peak of 1.0981 (March 8). Further north aligns the weekly high of 1.0998 (January 11) before the crucial 1.1000 threshold.
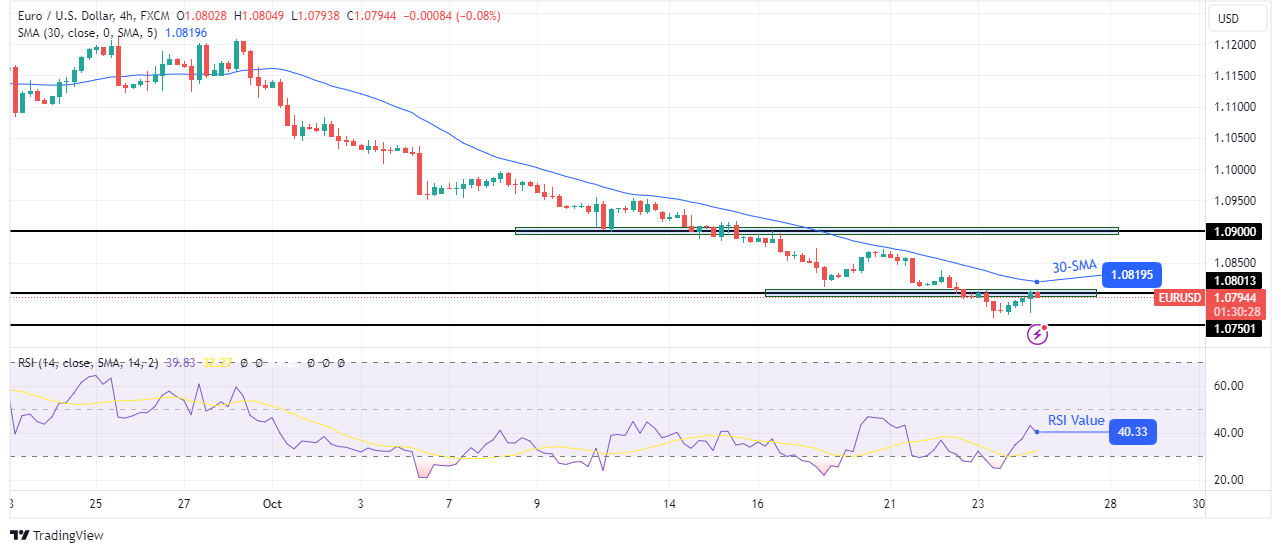
The 4-hour chart thus far shows some incipient recovery. That said, bulls should aim for 1.0809 prior to 1.0852, then 1.0916 and 1.0942. Immediately to the downside comes 1.0667, preceding 1.0649 and 1.0601. The Relative Strength Index (RSI) settled around 43.
Written by : Editorial team of BIPNs
Main team of content of bipns.com. Any type of content should be approved by us.
Share this article:


