
Category: Forex News, News
GBP/USD, EUR/USD Forecast: Two trades to watch
GBP/USD Struggles as Starmer on Resignation Watch
GBP/USD is trading close to this year’s lows as political uncertainty builds and speculation surrounding Prime Minister Keir Starmer’s future adds another headwind for sterling.

Starmer may step down as soon as today, although it is still unclear whether he will or whether he will remain in power to fight any potential leadership challenge from Greater Manchester Mayor Andy Burnham, whose victory in the Makerfield by-election has given him a path to Westminster.
For the pound, the key focus is fiscal policy. Should Burnham become Prime Minister, markets will want clarity on his spending plans and whether he would maintain the current fiscal rules. Any suggestion of increased borrowing could be poorly received by the UK bond market, particularly given the UK’s already stretched debt position.
A potential increase in gilt issuance to fund higher spending could make investors nervous at a time when concerns surrounding public finances remain elevated.
The pound has also come under pressure after cooler-than-expected UK CPI data last week prompted markets to scale back expectations for a Bank of England rate hike this year.
This contrasts with the more hawkish tone from the Federal Reserve following last week’s FOMC meeting.
The Fed’s hawkish tilt helped lift the US Dollar Index to a fresh 2026 high and could continue to support the greenback.
Attention now turns to US Core PCE inflation data, which could provide further clues over the outlook for US interest rates.
GBP/USD Forecast – Technical Analysis
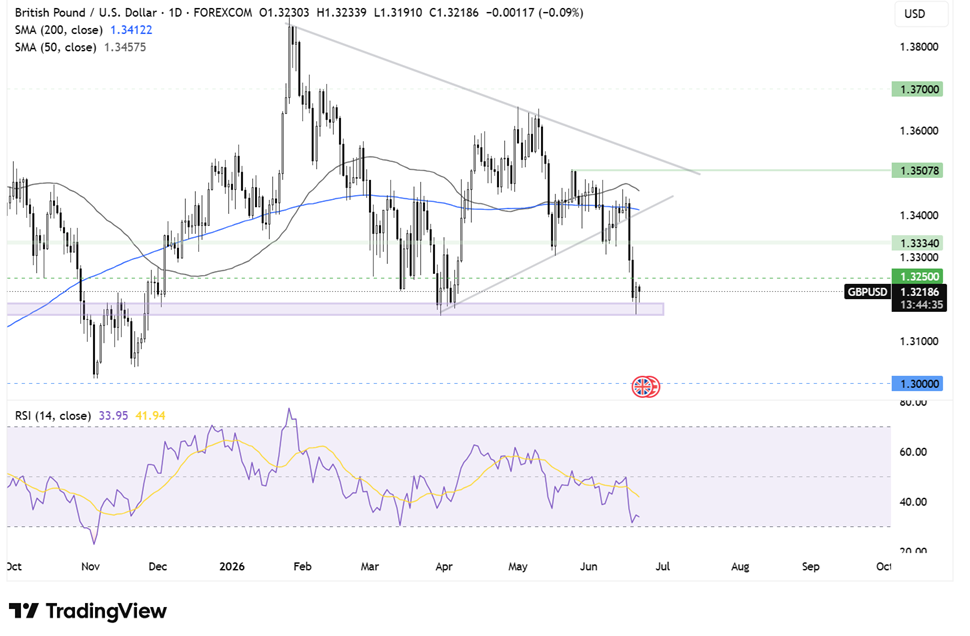
GBP/USD broke below its symmetrical triangle pattern, falling to a low of 1.3160 before recovering back above 1.3200. The pair continues to trade below its 50 and 200 SMAs, while the RSI remains below 50, keeping sellers hopeful of further downside.
Sellers will look for a break below 1.3160 to create a lower low and open the door towards the psychological 1.3000 level.
Buyers may be encouraged by the hammer candlestick reversal pattern. However, they will need to reclaim 1.3250 before bringing 1.3335 into focus. Above here, the 200 SMA around 1.3400 and the rising trendline resistance come into view.
EUR/USD Caught Between Falling Oil Prices and a Hawkish Fed
EUR/USD fell to 1.1410 last week, its lowest level since March, as the US dollar surged following the hawkish FOMC meeting. While the pair has recovered some ground, it remains well below 1.1500.
The euro is finding some support today after progress was reported in the first session of talks between the US and Iran. Oil prices have fallen further as vessels continue to move through the Strait of Hormuz.
This is positive for Europe, which remains heavily dependent on imported energy.
However, gains in EUR/USD could remain limited by continued US dollar strength. Last week’s FOMC meeting saw the Fed leave rates unchanged, but nine of 18 policymakers now expect a rate hike before the end of the year. Meanwhile, new Fed Chair Kevin Walsh doubled down on the importance of returning inflation to target, reinforcing the hawkish message.
Attention this week will focus on US Core PCE, the Fed’s preferred inflation gauge, which could provide further clues over the path of US interest rates.
While the ECB raised rates just a week before the Federal Reserve, that move already appears to have faded into the background. The ECB maintained a cautious, data-dependent tone and another rate hike risks placing additional pressure on an already fragile Eurozone economy.
Today, attention turns to Eurozone consumer confidence, which is expected to remain broadly stable around -18. ECB President Christine Lagarde is also due to speak.
Tomorrow’s PMI figures could provide further insight into the health of the Eurozone economy after May’s composite PMI remained in contraction territory. Another weak reading could keep pressure on the euro.
EUR/USD Forecast – Technical Analysis
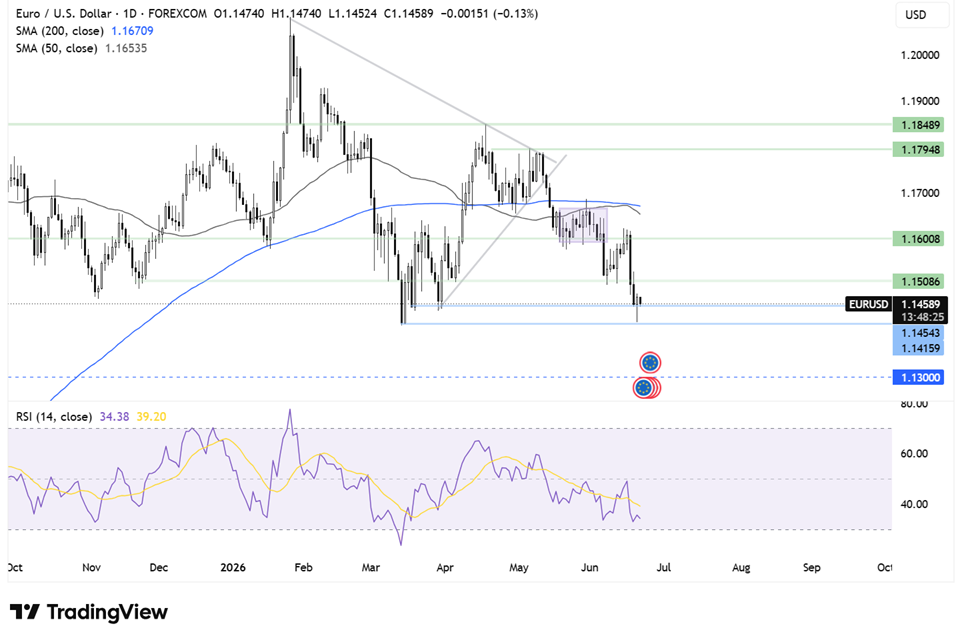
EUR/USD broke down from its symmetrical triangle pattern, falling below its 200 SMA and dropping to a low of 1.1410. This, combined with the RSI below 50, keeps sellers hopeful of further downside.
Immediate support can be seen at 1.1450, with a break below opening the door to 1.1400. Sellers will be looking to take out this level to create a lower low and extend the decline towards 1.1300.
Buyers may be encouraged by the long lower wick on Friday’s candle, suggesting demand emerged at lower levels. The hammer candlestick could signal a reversal. In that scenario, buyers would need to rise above 1.1500 to bring 1.1600 into focus, before exposing the 200 SMA at 1.1670.


Written by : Editorial team of BIPNs
Main team of content of bipns.com. Any type of content should be approved by us.


Share this article: