
Category: Gold News
Gold futures trade to a new record high of $2225.30
Right after this month’s FOMC meeting concluded and Chairman Powell held his regular press conference, gold began to move into uncharted territory. As of 5:40 PM EDT, gold futures basis most active April contract is currently fixed at $2183.80,which is a net loss of $6.30, or 0.29% today. However, the history that was made today was not in gold’s closing price but rather its intraday high. Gold traded to an intraday high over $20 above the former record high of $2203 when traders pushed gold to $2225.30 in today’s trading.
On Tuesday, we identified a Western technical chart pattern called a bullish flag formation. This pattern occurs after a strong uptrend. Gold price began a strong advance on February 29 when gold futures were trading at $2053.10. What followed was six consecutive days in which gold traded to a higher high, a higher low, and a higher close than the previous day.

On March 11, gold traded to a higher close, gaining $2.80 and closing at $2189. The strong price advance over the seven days created the “pole” of the bullish flag formation. For the next six days, from March 12 through March 19, the flag was created as gold consolidated with a downside bias.
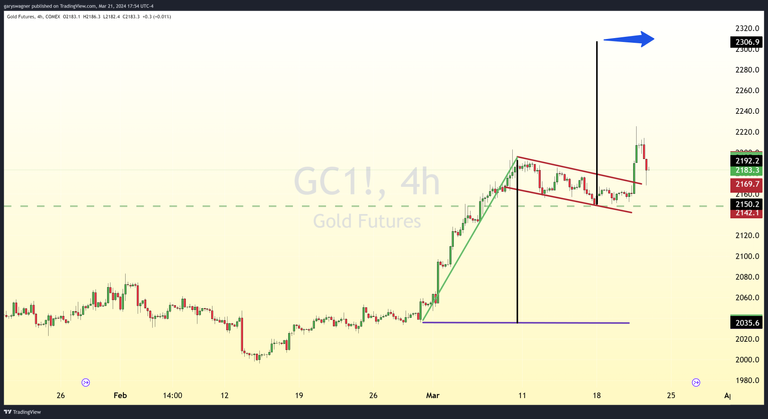
The chart above is a four-hour Japanese candlestick chart of gold futures. The pole is colored green, and the flag is colored red. Yesterday, following the conclusion of the FOMC meeting, the release of the SEP, and the press conference, gold prices spiked to their highest level in history.
Although gold has retraced from those highs at the time of writing, the pattern identified (Bull Flag) can be used to project where the current rally in gold could conclude. The projection (black dashed line) is based upon measuring the price move from the beginning to the end of the “pole”, and then projecting that same distance from the bottom of the flag.
This particular bull flag pattern suggests that gold could trade above $2300 by the completion of this pattern.
For those who wish to learn more about our service, please go to the links below:
Information, Track Record, Trading system, Testimonials, Free trial

Wishing you as always good trading,
Gary S. Wagner
Disclaimer: The views expressed in this article are those of the author and may not reflect those of Kitco Metals Inc. The author has made every effort to ensure accuracy of information provided; however, neither Kitco Metals Inc. nor the author can guarantee such accuracy. This article is strictly for informational purposes only. It is not a solicitation to make any exchange in commodities, securities or other financial instruments. Kitco Metals Inc. and the author of this article do not accept culpability for losses and/ or damages arising from the use of this publication.
Source link


Written by : Editorial team of BIPNs
Main team of content of bipns.com. Any type of content should be approved by us.


Share this article: