The main category of The Gold News.
You can use the search box below to find what you need.
[wd_asp id=1]
The main category of The Gold News.
You can use the search box below to find what you need.
[wd_asp id=1]
To gain an edge, this is what you need to know today.
The Message For Prudent Investors
Please click here for an enlarged version of the chart of SPDR Gold Trust ![]() GLD.
GLD.
Note the following:
Europe
European Central Bank (ECB) left interest rates unchanged as expected.
Japan
Speculation is building that Japan will raise interest rates in March. If this occurs, this will be the first interest rate hike since 2007.
As we have written before in detail, Bank of Japan (BOJ) policies will have a major impact on the stock market in the US.
As full disclosure, two Japan related ETFs are in ZYX Allocation Core Model Portfolio.
Magnificent Seven Money Flows
In the early trade, money flows are positive in Apple Inc ![]() AAPL, Amazon.com, Inc.
AAPL, Amazon.com, Inc. ![]() AMZN, Alphabet Inc Class C
AMZN, Alphabet Inc Class C ![]() GOOG, Meta Platforms Inc
GOOG, Meta Platforms Inc ![]() META, Microsoft Corp
META, Microsoft Corp ![]() MSFT and NVDA.
MSFT and NVDA.
In the early trade, money flows are negative in Tesla Inc ![]() TSLA.
TSLA.
In the early trade, money flows are positive in SPDR S&P 500 ETF Trust ![]() SPY and Invesco QQQ Trust Series 1
SPY and Invesco QQQ Trust Series 1 ![]() QQQ.
QQQ.
Momo Crowd And Smart Money In Stocks
The momo crowd is buying in the early trade. Smart money is inactive in the early trade.
Gold
The momo crowd is buying in the early trade. Smart money is inactive in the early trade.
For longer-term, please see gold and silver ratings.
The most popular ETF for gold is GLD. The most popular ETF for silver is iShares Silver Trust ![]() SLV.
SLV.
Oil
The momo crowd is buying oil in the early trade. Smart money is inactive in the early trade.
For longer-term, please see oil ratings.
The most popular ETF for oil is United States Oil ETF ![]() USO.
USO.
Bitcoin
Bitcoin is range bound. Bitcoin whales are pushing the narrative of bitcoin going to $80K over the weekend. Bitcoin is trading at $67,027 as of this writing.
Protection Band And What To Do Now
It is important for investors to look ahead and not in the rearview mirror.
Consider continuing to hold good, very long term, existing positions. Based on individual risk preference, consider a protection band consisting of cash or Treasury bills or short-term tactical trades as well as short to medium term hedges and short term hedges. This is a good way to protect yourself and participate in the upside at the same time.
You can determine your protection bands by adding cash to hedges. The high band of the protection is appropriate for those who are older or conservative. The low band of the protection is appropriate for those who are younger or aggressive. If you do not hedge, the total cash level should be more than stated above but significantly less than cash plus hedges.
It is worth reminding that you cannot take advantage of new upcoming opportunities if you are not holding enough cash. When adjusting hedge levels, consider adjusting partial stop quantities for stock positions (non ETF); consider using wider stops on remaining quantities and also allowing more room for high beta stocks. High beta stocks are the ones that move more than the market.
Traditional 60/40 Portfolio
Probability based risk reward adjusted for inflation does not favor long duration strategic bond allocation at this time.
Those who want to stick to traditional 60% allocation to stocks and 40% to bonds may consider focusing on only high quality bonds and bonds of seven year duration or less. Those willing to bring sophistication to their investing may consider using bond ETFs as tactical positions and not strategic positions at this time.
The Arora Report is known for its accurate calls. The Arora Report correctly called the big artificial intelligence rally before anyone else, the new bull market of 2023, the bear market of 2022, new stock market highs right after the virus low in 2020, the virus drop in 2020, the DJIA rally to 30,000 when it was trading at 16,000, the start of a mega bull market in 2009, and the financial crash of 2008. Please click here to sign up for a free forever Generate Wealth Newsletter.
This article is from an unpaid external contributor. It does not represent Benzinga’s reporting and has not been edited for content or accuracy.
© 2024 Benzinga.com. Benzinga does not provide investment advice. All rights reserved.
US stock futures traded flat ahead of Thursday’s opening bell.
Traders will be eyeing Jerome Powell’s congressional testimony, where he may give clues about rate cuts.
Meanwhile, gold’s strong recent run continued as the precious metal set a new record high.
Stocks looked set to tread water at Thursday’s opening bell, but gold extended its strong recent run as the precious metal hit another record high.
Futures for the S&P 500 and Nasdaq 100 edged up by less than 0.2% in premarket trading, while Dow Jones Industrial Average futures slipped lower.
The muted trading came with investors waiting for the second day of Federal Reserve chair Jerome Powell’s congressional testimony.
His comments could give the market some much-needed signals about when the central bank will start cutting interest rates.
Powell stuck to the expected script when he appeared before the House Financial Services Committee on Wednesday.
He said the Fed will cut borrowing costs this year, but is waiting for more data that shows inflation is definitely cooling toward its 2% target level.
Meanwhile, gold climbed 0.3% to set a new high of $2,161.48 an ounce.
The precious metal tends to struggle when interest rates are likely to fall but may have drawn in buyers looking for safe havens due to ongoing tensions in Ukraine and the Middle East.
Read the original article on Business Insider
Yes, gold price confirmed its breakout – in daily closing price terms. Yes, it is important.
At the moment of writing these words, gold price is trading at about $2,161 – it’s new all-time highs in nominal terms, which is slightly higher than the late-2023 high. Gold price is trying to stay above this level, and while it’s been successful so far, the extremely overbought RSI suggests that it won’t stay as high for long.
And yet…
Gold is already after a confirmed breakout to new highs. Yesterday was the fourth consecutive daily close above the late-2023 highs (I marked the early-December one, but it was also the case with the late-December one).
A confirmed breakout opens the door to higher prices, and since it was a breakout to new all-time highs, gold could move much higher in the medium term.
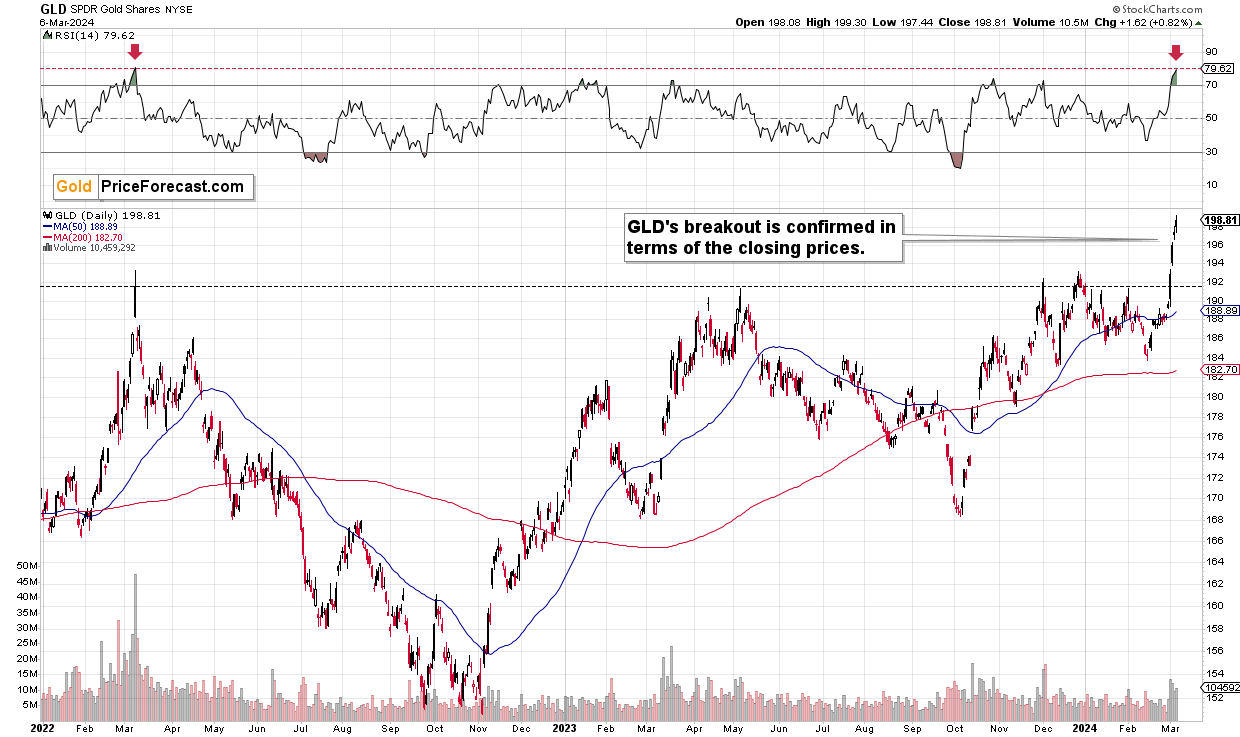
We see the same thing in the GLD ETF and while focusing on the 2022 top.
Generally, three daily closes are needed to confirm a breakout and we saw more than that. The breakout was confirmed, and the implications are bullish.
Those are the facts.
But those are not the only facts that are present right now.
It’s also true that gold price is extremely overbought – the RSI based on the GLD ETF is almost as overbought as it was at the 2022 top. After that high, gold price declined for hundreds of dollars.
It’s also true that mining stocks are underperforming gold and the rally that we saw in gold was not even similarly big in case of silver. Nothing special happened in platinum nor palladium. So, we don’t have the bullish confirmations here.
Please just look at the long-term HUI Index chart below and see the recent rally’s size.
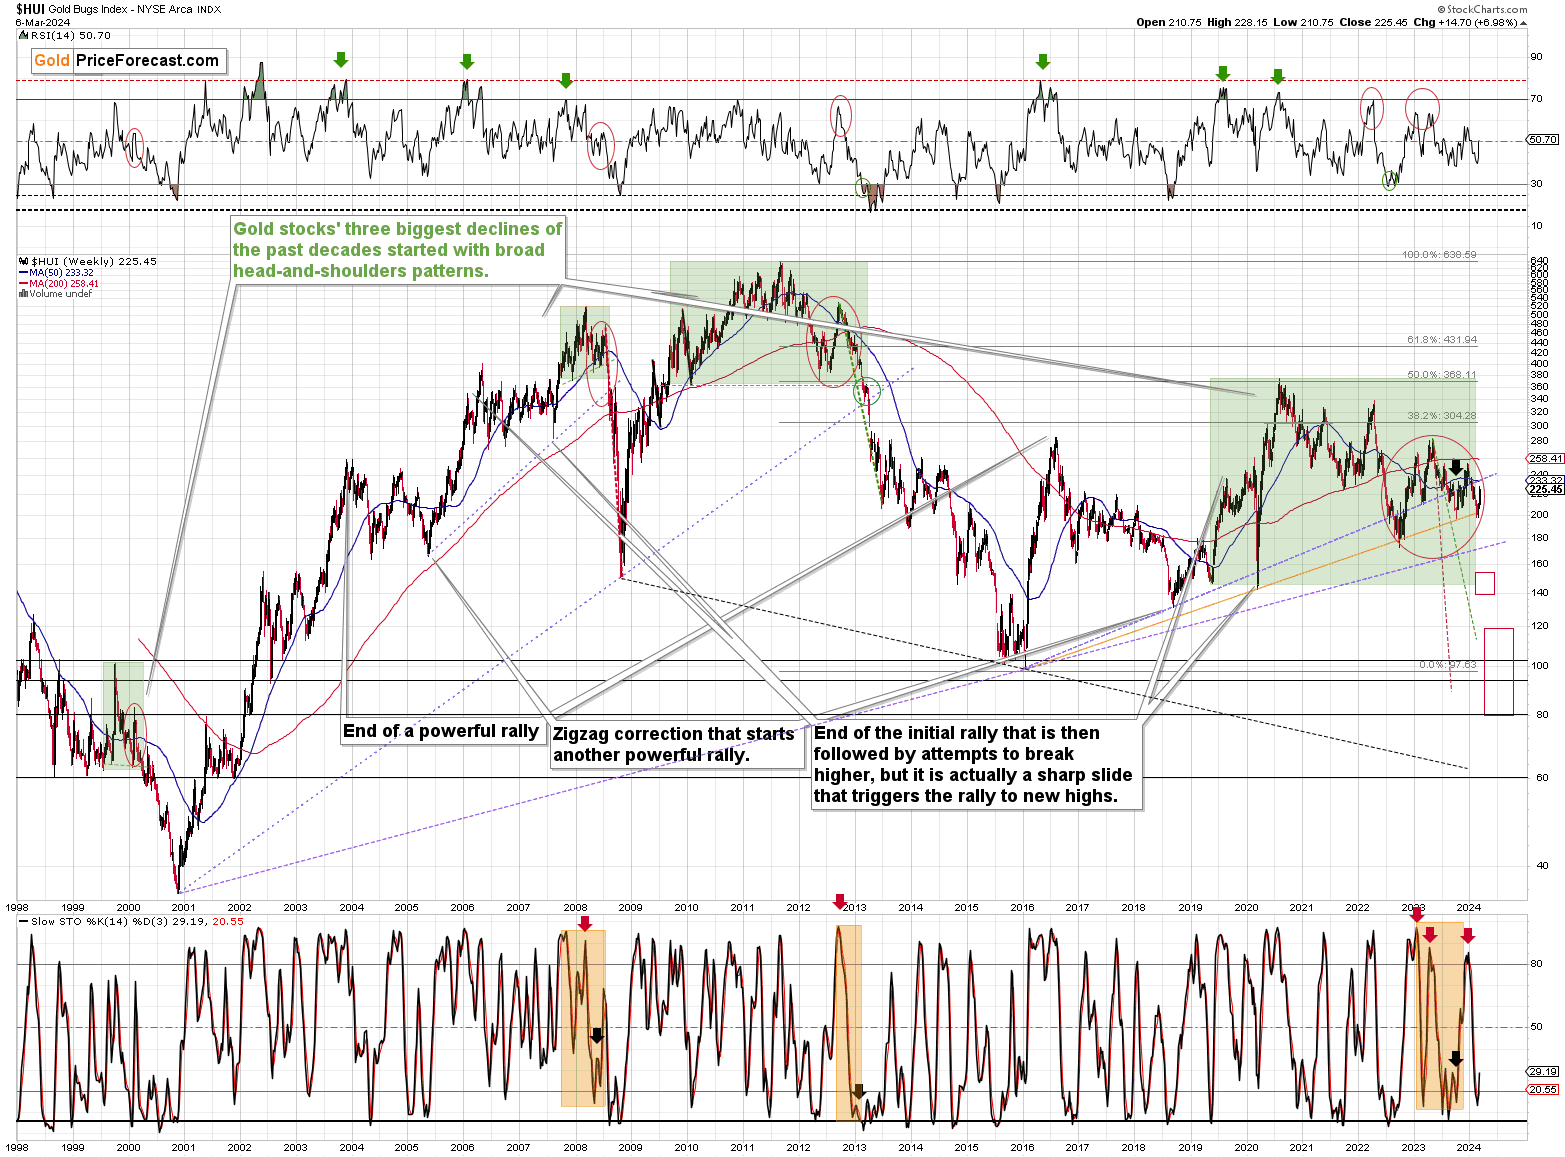
Barely noticeable, right? Gold – the metal those mining companies produce and sell just moved to new all-time highs. Why are the miners’ prices not soaring?
Why is this rally pretty much invisible from the long-term point of view, and why are gold stocks so low compared to their own all-time (2011) high? Those are extremely bearish signs for the precious metals market.
We have the USD Index that’s likely to move higher in the medium term, and we have stock market that is extremely overbought, and we all remember what happened to the prices of gold, silver, and mining stocks when stocks plunged in 2020 or 2008.
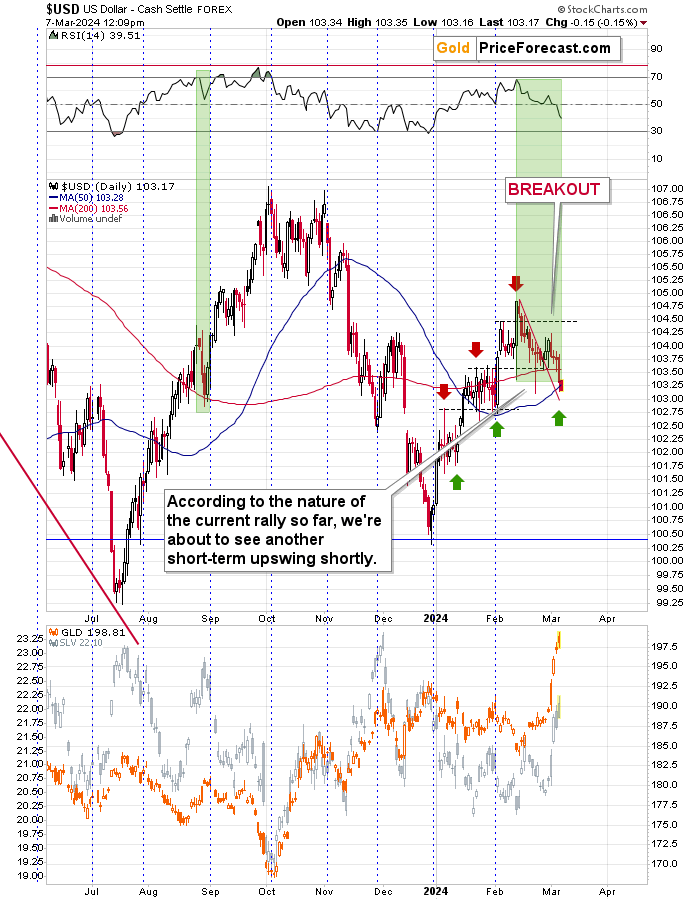
The USDX is close to its recent intraday lows as well as its 50-day moving average. It’s also close to the levels that stopped its decline during the August 2023 correction. It seems that it can turn up any day or hour now.
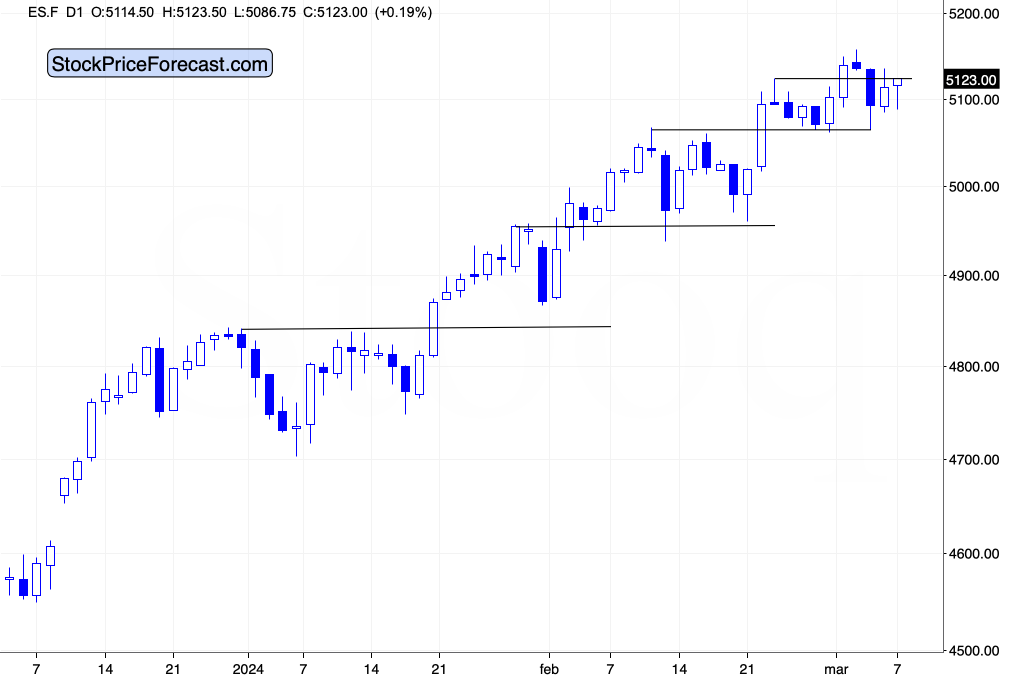
Stocks moved below their late-Feb high recently and while they are trying to get back above it, the fact that they finally did move below the said high already makes the current situation different.
Was that the final top for stocks? If so, it could have been the case that gold (and bitcoin, which soared recently as well) we pushed higher on the wave of the overall dovish and bullish sentiment.
And as stocks move lower, gold might plunge as well.
All right, so what is gold likely to do now?
It’s extremely overbought, so it’s likely to decline – regardless of the breakout and the fact that the medium-term outlook for gold might have just changed to bullish.
Why? Because even if it is the case that gold is going to soar substantially in the following months – despite everything happening on other markets – it’s still likely to correct to the previous highs and verify them as support. Even in the bullish scenario.
And then the real test will take place. Will gold really be able to hold above the previous highs in terms of the closing prices?
If it does, it might be off to new highs shortly thereafter. If it doesn’t, it’s a long way down from there.
The above creates not one, but two major trading opportunities (one clear, and one will depend on the result of gold’s verification), and I’m discussing them both in today’s Gold Trading Alert. I’m also explaining the possibility of seeing a big disconnect within the precious metals sector. Times are changing, and you’ll likely thank yourself for being prepared for those changes. I encourage you to join my subscribers and get more details today, especially that for new subscribers, the first week is free.
Thank you.
Przemyslaw K. Radomski, CFA
Founder, Editor-in-chief
In global markets, gold is on the rise fueled by predictions
that the U.S. Federal Reserve (FED) will lower interest rates this
year, Azernews reports.
The sharp increase in the price of gold persists, reaching a new
record today.
In the past six sessions, bullion has gained approximately 7%,
with the price of one ounce of gold reaching $2167 today. Over the
past year, gold has appreciated by more than 18%.
Federal Reserve Chair Jerome Powell stated on Wednesday that it
would be appropriate to begin reducing interest rates. Citigroup
has raised its gold price forecast for the next three months to
$2200 per ounce and increased its forecast for the next 6-12 months
to $2300.
Lower interest rates enhance the attractiveness of gold.
Typically, when the FED reduces interest rates, the U.S. Dollar
depreciates. It is expected that central banks will continue their
gold purchases amid geopolitical uncertainties. The slowdown of the
Chinese economy is also anticipated to impact global economic
growth. Therefore, in an uncertain financial environment, gold
remains a secure investment for banks and investors. These factors
contribute to the ongoing appreciation of gold.
—
Follow us on Twitter @AzerNewsAz
The price of gold traded at $2,159.81 per troy ounce, as of 9 a.m. ET. That’s up 0.95% since yesterday’s gold price per ounce and up 4.52% from the beginning of the year.
The lowest trading price within the last 24 hours: $2,132.45 per ounce. The highest gold spot price in the last 24 hours: $2,164.77 per ounce.
XAU/USD is the label for finding the spot gold price traded in U.S. dollars. In this case, gold (XAU) is traded against the dollar, and the price represents the cost of one (troy) ounce of gold in USD. But there are other foreign exchange markets, such as XAU/EUR for trading in euros and XAU/GBP for trading in British pounds.
The spot gold price represents the price at which gold can be exchanged and delivered, and prices are typically quoted in gold price per troy ounce in U.S. dollars. But prices can also be quoted per gram and kilo. It’s worth noting that a troy ounce is slightly heavier than a standard ounce.
The chart below shows how the spot price of gold is trending over the year. The data is as of 9 a.m. ET and doesn’t display intraday highs or lows.
Year to date, gold is up 4.52% from the beginning of the year, as of 9 a.m. ET. The 52-week intraday high reached $2,164.77 on March 7, 2024, and the 52-week intraday low dropped to $1,809.55 on March 8, 2023.
Remember that the spot price of gold is quoted in real time and represents the current price at which gold can be bought or sold for immediate delivery. For most investors, the spot price usually differs from the price they’ll pay or receive when they decide to purchase or sell their gold.
For example, buying physical gold involves overheads like storage costs and insurance.
When trading physical gold, the difference between the buying and selling price, known as the spread, can eat into returns. Dealers often incorporate their markups and transaction fees within these spreads, which means the actual price an investor pays might be higher than the current market rate, while the selling price they receive might be lower.
While gold certificates, gold exchange-traded funds and gold trusts offer more liquidity and are easier to manage than physical gold, they come with their own risks. These investment vehicles might only sometimes match the performance of the spot price of gold due to management fees and potential discrepancies in tracking.
In essence, while the spot price provides a general benchmark for the value of gold, the actual returns and costs an investor encounters differ based on the medium of purchase and the specifics of the investment.
Buying physical gold involves overheads like storage costs and insurance.
When trading physical gold, the difference between the buying and selling price, known as the spread, can eat into returns. Dealers often incorporate their markups and transaction fees within these spreads, which means the actual price an investor pays might be higher than the current market rate, while the selling price they receive might be lower.
While gold certificates, gold exchange-traded funds and gold trusts offer more liquidity and are easier to manage than physical gold, they come with their own risks. These investment vehicles might only sometimes match the performance of the spot price of gold due to management fees and potential discrepancies in tracking.
In essence, while the spot price provides a general benchmark for the value of gold, the actual returns and costs an investor encounters differ based on the medium of purchase and the specifics of the investment.
Precious metals have long served as investment vehicles and industrial commodities. Like gold, the spot prices of silver, platinum and palladium fluctuate based on various market, economic and geopolitical factors.
Silver possesses both monetary and industrial value. While it’s used as a hedge against economic volatility, it’s also crucial in the electronics, automotive and medical industries. Its dual-use nature can lead to different market dynamics compared to gold.
The price of silver opened at $24.26 per ounce, as of 9 a.m. ET. That’s up 1.78% since the previous day’s silver price per ounce and up 1.40% since the beginning of the year.
The lowest trading price within the last day: $23.80 per ounce. The highest silver spot price in the last 24 hours: $24.35 per ounce.
Platinum is another precious metal that commands attention. Rarer than gold and silver, its primary use is in automotive catalytic converters, which help reduce harmful emissions. Given the push for cleaner automotive technologies, the demand dynamics for platinum can vary, influencing its spot price.
The price of platinum opened at $922.60 per ounce, as of 9 a.m. ET. That’s up 2.70% since yesterday’s platinum price per ounce and down 6.60% year to date.
The lowest trading price within the last 24 hours: $896.65 per ounce. The highest platinum spot price in the last 24 hours: $926.05 per ounce.
Palladium, like platinum, is pivotal in the automotive industry for catalytic converters. In recent times, there has been a surge in palladium demand due to stricter emission standards worldwide. Its scarcity and rising industrial demand have led to significant price volatility.
The price of palladium is $1,031.92 per ounce, as of 9 a.m. ET. That’s up 1.89% since yesterday’s palladium price per ounce and down 6.15% year to date.
The lowest trading price within the last 24 hours: $1,019.00 per ounce. The highest palladium spot price in the last 24 hours: $1,066.75 per ounce.
The highest price gold ever reached was $2,164.77 on March 7, 2024.
One notable recent high includes the yellow metal’s high of $1,971.17 per troy ounce in August 2020. This surge can be partially attributed to the economic uncertainty surrounding the COVID-19 pandemic.
The global outbreak of COVID-19 brought about unprecedented economic challenges. With central banks worldwide implementing low interest rate policies and massive fiscal stimulus packages to support their economies, there were concerns about potential inflation and the devaluation of fiat currencies. In this scenario, some investors turned to gold as a safe asset, given its history as a store of value during times of economic instability.
Geopolitical tensions, trade wars, and supply chain disruptions during this period further contributed to investors seeking refuge in assets deemed more stable, and gold has historically been a preferred choice for many. As a result, demand for gold increased, driving its price to a record high in August 2020.
Remember that while the COVID-19 pandemic’s economic repercussions significantly contributed to gold’s price rise in 2020, other factors likely also played a part.
Gold’s value tends to fluctuate based on economic, geopolitical and market factors, so the answer to this question depends on the measured period. It’s also difficult to pinpoint the direction of future price trends ahead of time.
From the beginning of the year to March 7, 2024, the price of gold rose from $2,066.32 per troy ounce to $2,159.81, representing a 4.52% increase.
Gold prices extended gains to hit an all-time high on Thursday after comments from Federal Reserve Chair Jerome Powell fostered expectations for lower U.S. interest rates this year.
Gold tends to rise when interest rates are low, which reduces the opportunity cost of holding non-yielding bullion.
Spot gold gained 0.4% to $2,157.51 per ounce, as of 1003 GMT. U.S. gold futures rose 0.3% to $2,165.20.
Bullion hit a record high of $2,161.09 earlier in the session and was on track for its longest intra-day winning streak since at least November 2021.
Powell said on Wednesday rate cuts will “likely be appropriate” later this year “if the economy evolves broadly as expected” and once officials gain more confidence in inflation’s steady deceleration. Powell will speak again on Thursday.
“The primary driver in this recent rally in gold is a continued decline in real yields, with inflation expectations continuing to cool, pushing buyers into gold from money market accounts and Treasuries,” said SP Angel analyst Arthur Parish.
Powell’s remarks, coupled with data released the same day indicating softer labour market conditions, pushed U.S. Treasury yields and the dollar lower, boosting demand for gold.
The near-time focus will be on European Central Bank’s rate decision, due at 1315 GMT, when the central bank is expected to keep interest rates unchanged at record highs.
Friday’s U.S. non-farm payrolls report for February is expected to provide more clarity on U.S. rate cuts. It is expected to show employers added 200,000 jobs during the month, according to economists’ polled by Reuters.
“A weaker-than-expected figure is likely to push gold closer to $2,200/oz in the spot market,” Parish said.
Spot silver was steady at $24.16, platinum climbed 0.9% to $915.60 per ounce, while palladium slipped 1.3% to $1,028.52, after a sharp rise in the last session.
On Wednesday, March 6th, U.S. markets closed in green, boosted by economic data and remarks from Federal Reserve Chair Jerome Powell, which strengthened predictions of a U.S. interest rate cut this year.
In economic data, U.S. private sector job growth increased to 140,000 in February from January’s 111,000, below the expected 150,000. Job openings slightly dropped to 8.863 million, and wholesale inventories decreased by 0.3% in January.
Nine out of 11 key S&P 500 sectors closed higher, with utilities and information technology leading gains, while consumer discretionary saw the largest decline.
The Dow Jones Industrial Average gained 0.20% to close at 38,661.05. The S&P 500 increased 0.50%, ending the day at 5,104.76, and the Nasdaq Composite rose 0.58%, finishing the session at 16,031.54.
Asian Markets Today
Eurozone at 06:30 AM ET
Commodities at 06:30 AM ET
US Futures at 06:30 AM ET
Dow futures were up 0.09%, S&P 500 futures gained 0.23%, and Nasdaq 100 Futures rose 0.40%.
Forex at 06:30 AM ET
The U.S. Dollar Index declined 0.15% to 103.21, USD/JPY was down 0.99% to 147.88, and USD/AUD slid 0.60% to 1.5136.
Photo by Markus Spiske on Unsplash
© 2024 Benzinga.com. Benzinga does not provide investment advice. All rights reserved.
The gold price hit a new record level at $2,161.25 per ounce. Therefore, United Overseas Bank Ltd. sees the next important resistance level at $2,167 per ounce.
Weak US economic data and banking tensions have helped drive a 5% jump in bullion prices over the past four trading sessions, with recent gains on Tuesday and Wednesday surpassing the previous high set in December. However, the speed and scale of the move surprised many market watchers, especially given the lack of any major change in expectations for when the Federal Reserve will start cutting US interest rates, which has been the main focus. Certainly, the backdrop looks favorable for gold with geopolitical tensions higher than ever. Gold’s performance over the past year has surprised some seasoned market watchers long before the current rally, as prices have remained at elevated levels despite rising real interest rates. Usually, Gold has an inverse relationship with bond yields, but it has received support from strong buying by global central banks and consumer demand in China in particular.
Therefore, is the rise in gold just a flash in the pan, or is the yellow metal just getting started? Here are four key things to watch to determine the direction of the gold price in the coming months:
Real Yields
The primary driver for the gold price over the past year has been the market’s anticipation of when the Federal Reserve would begin to lower borrowing costs. Swap markets show a 65% chance of a cut in June, compared to 58% at the end of February. Yesterday, Federal Reserve Chairman Jerome Powell reassured lawmakers that the central bank is not in a hurry to cut interest rates until policymakers are convinced, they have won their battle over inflation. When the Fed eventually pivots, it will reduce the opportunity cost of holding gold, which bears no interest. Real yields in the United States have been declining since last October, but the recent surge in the gold price has far exceeded expectations.
Technical Indicators
The gold price hit a new record level at $2,161.25 per ounce. Therefore, United Overseas Bank Ltd. sees the next important resistance level at $2,167 per ounce. However, for Ronan O’Connell, market analysis head at StoneX Financial Ltd., the gold price is already in overbought territory above $2,115 per ounce. She noted that weak US figures last weekend triggered technical and momentum trading.
Gold Futures Open Interest
The latest COMEX data shows fund managers adding long new positions, leading to gains in gold. This increase in open interest suggests that investors are becoming more optimistic about gold, rather than just closing out existing short positions.
Chinese purchase
Swiss exports to China – usually a good indicator of Chinese demand for gold – nearly tripled in January, as consumers sought to hedge against turmoil in the country’s stock market and real estate sector. With the country’s largest state-owned lenders cutting deposit rates, putting money in the bank has become relatively less attractive compared to bullion. In addition, China is among the global central banks that buy gold to reduce its dependence on the US dollar. Obviously, China was among the largest hordes of gold last year, as countries from Poland to Singapore diversified their financial reserves by adding the precious metal.
According to the performance on the daily chart, the general trend of the gold price is still upward. Recent gains were enough to push all the technical indicators towards strong levels of saturation with buying. Therefore, it is risky to buy from these peaks, and it is better to think about selling, but without risk and at several levels if the rise continues, as it is natural for it to occur. The nearest resistance levels for gold are currently $2163 and $2175, respectively.
Ready to trade our Gold forecast? We’ve shortlisted the best Gold brokers in the industry for you.
Expand
Expand
Gold prices opened on the Multi Commodity Exchange (MCX) on Thursday at Rs 65,205 per 10 grams and hit an intraday low of Rs 65,205. In the international market, prices hovered around $2,156.24 per troy ounce.
Meanwhile, silver opened at Rs 74,444 per kg and hit an intraday low of Rs 73,840 on the MCX. The price hovered around $24.13 per troy ounce in the international market.
Manav Modi, Analyst, Commodity and Currency, MOFSL, “Gold rallied to a record high building on stellar momentum driven mostly by bets for U.S. monetary easing.”
The dollar index slipped in the yesterday’s session after Governor Jerome Powell’s testimony, where he signalled a possible rate cut later this year.
Governor Powell in his testimony reiterated his stance from earlier, mentioning that the Fed does not expect a rate cut until there is more confidence regarding ease off in inflation.
Fed chair also mentioned that the labour market is still tight, and they will carefully assess incoming data before taking any further steps.
“Bets for a rate cut in the June Fed meeting have increased from 40% last month to ~60% now, supporting an up-move in safe-haven assets,” said Modi.
On the data front, US ADP private payroll data was reported at 140k against the expectations of 149k, The focus now shifts to the non-farm payroll data scheduled tomorrow to get further clarity on the US labour market and the Fed’s stance ahead.
Jateen Trivedi, VP Research Analyst, LKP Securities, said, “Prices managed to maintain levels above 64650, albeit encountering resistance around the 64900 mark. This suggests a consolidation phase in the gold market today, following a recent strong uptrend from 62500 to 65000.”
“Market participants are closely monitoring the testimony of Federal Reserve Chair Powell, as it is expected to provide significant insights into the Fed’s projection regarding interest rate cuts in the United States. This event could potentially influence gold prices in the near term, as market sentiment and expectations regarding monetary policy shifts often have a notable impact on precious metal markets,” added Trivedi.
Also read: How should I invest Rs 20,000 in mutual fund SIPs to save for my daughter’s higher education?
COMEX Gold futures rose for the sixth straight day and touched a fresh record high of $2160.7 per troy ounce amid weak US data, renewed concerns about the US banking sector and Powell’s testimony, as per Kotak Securities research report.
COMEX Silver prices rose on Wednesday, tracking gains in bullions and base metals. Still, lack of signs of robust economic recovery from China coupled with weak factory output across major economies continue to weigh on demand prospects.
Meanwhile, China’s 5% bullish growth target for 2024 was seen as a target without plans and failed to entice investors. Chinese inflation numbers during the weekend will be used to gauge whether the recent support measures have aided consumption, as per Kotak Securities research report.


