The main category of The Gold News.
You can use the search box below to find what you need.
[wd_asp id=1]
The main category of The Gold News.
You can use the search box below to find what you need.
[wd_asp id=1]
Happy Friday, traders. Welcome to our weekly market wrap, where we take a look back at these last five trading days with a focus on the market news, economic data and headlines that had the most impact on gold prices and other key correlated assets—and may continue to into the future.
Gold prices are ripping towards a week-over-week gain beyond +2% on Friday, as markets reassess expectations for the timing of the first FOMC rate-cut of 2024.
If there’s one trend that’s been a reliable mainstay for the gold market in the first two months of 2024, it’s a mostly stable trading range of $2020 to $2040/oz in the spot market. If there are two trends that have been a reliable mainstay for the gold market in the first two months of 2024, the second has been weeks that trade with relative calm and are then capped by a burst of volatility. Here, on the first trading day of March 2024, that second trend has kicked into gear so hard that may eliminate the first, going forward.
Because the macro-data calendar was basically empty for the first half of the week and there was little in the way of headline news that might shift the US Dollar, Treasuries, or commodities markets in a meaningful way, gold spot prices again traded flat through the first three days of this week, showing little interest in pushing much beyond $2035/oz but also marking reliable support above $2025. The first real point of interest for traders and investors looked to be Thursday’s PCE Price Index release, an update on the Federal Reserve’s preferred metric for inflation in the US. There was little expectation of a big surprise in the January number—the primary inputs to the PCE data set are the Consumer and Producer Price Indexes for the same period, which printed earlier in the month. The market broadly knew to expect a slight increase in both the “core PCE” basket of prices, and in the more volatile headline PCE number. To this point, February’s data did not surprise or disappoint, printing in-line with the consensus projection. What nobody was really looking out for, however, was the downward revision of December’s month-over-month inflation data, to just +0.1% for both headline and core PCE. In reaction that, admittedly, felt overblown, investors across multiple asset classes appeared to immediately recalibrate their assessment of the odds that the Federal Reserve might consider cutting interest rates before June. Going into this week, thanks largely to the statement and Q&A from January’s FOMC meeting, the market had mostly written-off this possibility, but the slide in the US Dollar and climbing Treasury paper prices that followed Thursday’s PCE report indicate that investors are all too happy to reconsider those odds. As we would expect in that case, gold prices jumped on Thursday morning as well, to $2046/oz and higher, immediately testing the top boundary of the recent range.
It was also a little surprising that, as Thursday’s trading went on, we didn’t see a big rush to take profit on the morning’s rally, being the final trading day of the month. It wasn’t the be, as gold traded flat through the afternoon, consolidating the new gains. Moving into Friday’s US session—the yellow metal had continued to hold its serve through the Asia sessions and the European morning trading—there was some checking-again to see if the first session March 2024 would see prices correct lower.
Instead, the argument for the Fed to begin cutting interest rates sooner than later gained another argument in its favor. After some other data and anecdotal reporting around the US’ industrial sector suggested a level of strength that would give the FOMC cover to continue restricting economic activity with higher rates, Friday’s ISM Manufacturing Index was a clear letdown, missing expectations for a modest increase in the key number and instead indicating more contraction than the previous months. Whereas the PCE data set on Thursday suggested the Fed could get comfortable with ending the brief era of “elevated” interest rates in its battle against inflation, the signal that things may be faltering in the engine room of the US economy implies that the Fed maybe should consider easing monetary policy sooner.
In the gold market, this drove a repeat of Thursday’s jump, and then some. The initial surge brought spot prices for the precious metal above $2060/oz with very little resistance to be seen, and the rally that followed the open of cash market trading in New York has delivered spot prices north of $2085/oz, as the US Dollar has softened farther at the end of the week and yields on the US Treasury’s 10-year Note have slipped below +4.10%.
This sharp gain at the end of the week, and the start of the final month of Q3, has reset the table for gold prices and for expectations around FOMC policy decisions. Both will get a considerable test next week: first we’ll see (from the ISM again) if the “services sector” of the US economy is slowing like manufacturing, in a Tuesday morning report. And at the end of the week, we’ll see the February Jobs Report and a vital update on the health of the US labor market. In between the two, Fed Chair Jerome Powell will offer his semi-annual testimony to Congress, from which we expect to get a little more shading on the Fed’s forward planning.
For now, traders, I hope you can get out and safely enjoy your weekend for the next couple of days. After that, I’ll see everyone back here next week for another market recap.
Toronto, Ontario–(Newsfile Corp. – March 1, 2024) – The Canadian Securities Exchange (“CSE” or “the Exchange”) today welcomed the listing of Galloper Gold Corp. The company’s common shares began trading on the CSE earlier today under the symbol BOOM.
A Vancouver-based resource company, Galloper is focused on prospective gold and base metals projects at Glover Island and Mint Pond, both of which are located in Newfoundland, one of the world’s premier mining jurisdictions. Led by a team with successful exploration and production backgrounds, initial drilling is planned for 2024.
“Newfoundland has a distinguished history of mining exploration and development by exciting junior companies,” said James Black, the CSE’s Vice President, Listings Development. “We are pleased to welcome BOOM, a company that exemplifies the entrepreneurial spirit that the CSE is committed to support.”
About the Canadian Securities Exchange:
The Canadian Securities Exchange is a rapidly growing exchange invested in working with entrepreneurs, innovators and disruptors to access public capital markets in Canada. The Exchange’s efficient operating model, advanced technology and competitive fee structure help its listed issuers of all sectors and sizes minimize their cost of capital and enhance global liquidity.
Our client-centric approach and corresponding products and services ensure businesses have the support they need to confidently realize their vision.
The CSE offers global investors access to an innovative collection of growing and mature companies.
STAY CONNECTED WITH THE CSE
=============================
Website: https://thecse.com/
Blog: https://blog.thecse.com/
CSE TV on YouTube: https://www.youtube.com/csetv
CSE’s “The Exchange for Entrepreneurs™” Podcast: https://blog.thecse.com/category/cse-podcast/
Linkedin: https://ca.linkedin.com/company/canadian-securities-exchange
Twitter: https://twitter.com/CSE_News
Instagram: https://www.instagram.com/canadianexchange/
Facebook: https://www.facebook.com/CanadianSecuritiesExchange/
Contact:
Richard Carleton, CEO
416-367-7360
richard.carleton@thecse.com

To view the source version of this press release, please visit https://www.newsfilecorp.com/release/200101
By
Mar 1, 2024 | 7:15 AM
GLASGOW, United Kingdom — Sarah Mitton set a Canadian record and claimed the gold medal in women’s shot put at the world athletics indoor championships on Friday.
Mitton’s record throw, on her fifth attempt, measured 20.22 metres.
The reigning Commonwealth and Pan American Games champion from Brooklyn, N.S., had already clinched victory on her fourth throw, which measured 20.20, also setting a national mark.
Yemisi Ogunleye of Germany won silver with a throw of 20.19, while Chase Jackson of the United States claimed bronze with a throw of 19.67.
Headlines:
Markets:
There wasn’t too much action in European trading today, as FX continues to struggle for volatility on the week.
The dollar was little changed overall, keeping steadier despite some back and forth action in the bond market. 10-year Treasury yields rose to 4.28% early on before dipping to a low of 4.22% during the session. That did little to wake up currency traders, although USD/JPY did ease back from 150.60 to 150.30-40 levels.
EUR/USD was subdued around 1.0810-20 levels mostly while GBP/USD is just up slightly from 1.2630 to 1.2645 at the moment. AUD/USD continues to sit near the 0.6500 mark, staying little changed mostly on the day near the figure level.
Instead, it was gold that benefited the most as the precious metal rose from $2,040 to $2,050 levels currently and eyeing a break of key trendline resistance at $2,045 as outlined here.
In the equities space, European stocks are still ripping higher as investors continue the hot run from February. But US futures are more tentative for now, with S&P 500 futures marginally lower ahead of the March open.
In terms of data, we got Eurozone CPI for February and that saw core prices remain more stubborn just above 3%. It still is a minor drop from January, allowing for the ECB to stay on the rate cut path at least. However, it also reaffirms the potential for prices to be stickier and more difficult to return to 2% in the months ahead.
Accurate at the point of publication.
The price of gold today, as of 9:08am, was £1,607.58 per ounce. That’s up 0.02% on yesterday’s closing price of £1,607.29.
Compared to last week, the price of gold is up 0.27%, and it’s up 0.93% from one month ago.
The 52-week gold price high is £1,616.07, while the 52-week gold price low is £1,581.70.
Many investors consider gold to be the ultimate safe-haven asset, relying on the theory that when the prices of shares, bonds and property drop sharply, gold may hold its value – and its price can even increase as nervous investors rush in to buy.
Investing in gold is also a way to add diversification to your investment portfolio. When you hold a diversified mix of different assets, including gold, varying returns can protect the value of your investments.
There are several ways to invest in gold. Each has pros and cons…
One option is to buy gold in physical form:
Alternatively, investors can invest in gold indirectly:
You should consider investing in gold if you’re looking to hedge against risk or diversify your portfolio. Gold would probably not be your first choice to earn long-term capital growth.
Over the past five years, the price of gold has appreciated approximately 36% while the total return of the S&P 500 has been 60%.
Gold prices can be extremely volatile, and that means that gold isn’t an entirely stable investment. In fact, you can easily craft a well-diversified investment portfolio entirely without gold.
It should also be noted that gold in its physical form, unlike other investments, does not produce an income or yield.
If you buy physical gold, you also need to consider where you are going to keep it, and whether there will be costs associated with secure storage.
Studies have found that gold may be an effective way to defend your wealth against inflation, but only over extremely long periods of time, measured in decades or even centuries.
Over shorter time periods, the inflation-adjusted price of gold fluctuates dramatically, typically making it a poor near-term hedge for inflation.
Inflation reduces the ‘real’ value of a currency over time. Or, put another way, £50 today buys you less than it did 10 years ago. However, gold can provide a way of protecting the ‘real’ value of your wealth against inflation.
During a period of high inflation, as is currently the case in the UK and US, investors may revert to buying gold as a real physical asset that holds its value.
Periods of high inflation often correspond with a rise in interest rates and general economic uncertainty. As a result, gold is seen to some as a safe haven and, in theory, increased demand results in a rise in price.
Over the last 20 years, annual inflation has averaged 3% in the UK, according to the Office for National Statistics. Over the same period, the price of gold has increased by an average of 9% per year (according to the World Gold Council). Whereas the average base rate (a proxy for the interest rate on savings) was 3% over this period, according to the Bank of England.
Adjusting for the inflation rate of 3%, the ‘real’ value of gold has therefore increased by an average of 6% per year. In comparison, savers would have experienced no ‘real’ increase in the value of cash held in savings accounts due to the impact of inflation.
Gold may offer investors a safe haven in times of economic and geopolitical volatility. It may also provide a way of preserving wealth in a high inflation environment. As with shares, the price of gold is volatile. However it has delivered an increase in value over the last 30 years.
Investors should also consider the effect of foreign currency movements when deciding whether to buy gold. Gold is typically denominated in US dollars and, as a result, tends to have an inverse relationship with the US dollar. This means that, if the US dollar strengthens against other currencies, the price of gold can fall.
Looking over the last year, the price of gold in US dollars has decreased by 3% as the US dollar has strengthened against other currencies. However, the price of gold in sterling has increased by 10% due to the weakening of the pound against the dollar.
Overall, it is difficult to assess whether it’s a good time to buy gold as its price is dependent on a number of factors. Although a continuation in the current level of economic and political uncertainty may provide a tailwind for gold prices, investors should also be aware of the volatility of this asset.
Gold is a limited commodity with a relatively static supply, meaning that the price of gold is highly sensitive to changes in demand. A fall in demand will therefore result in a drop in the value of gold.
By way of example, the price of gold fell by over 25% from 2011 to 2013. It also fell from over $2,000 per Troy ounce in mid-2020 to less than $1,700 in early 2021, a fall of 17%.
The price of gold is determined by the level of supply and demand. The daily price is set by the London Bullion Market Association (LBMA) and there are two different types of gold prices:
Digital gold (or digigold) is a form of digital currency that allows you to buy fractions of physical gold stored by the seller. Buyers of digital gold will own, and have legal title to, the gold, with the seller acting as custodian.
Digital gold enables buyers to invest by value – say, £25 – rather than by weight (as with a 1 kilogram bar of bullion). Buyers can also invest a lower minimum amount than with the physical asset.
Digital gold also offers a saving in terms of storage and insurance. For example, the Royal Mint charges an annual management fee of 0.5% for its DigiGold products, compared to 1-2% for physical gold.
As buyers own the underlying physical gold, their profit (or loss) will be dependent on the price of gold, as covered in the questions above.
You can buy physical gold in the form of bullion, coins or jewellery, or invest in digital gold:
Investors may also want to consider investing in an indirect form of gold, including:
*The gold price data above is provided by Zyla Labs, which sources asset price data from a wide range of sources. This gold price represents an average of spot gold prices on several leading metals exchanges. Prices are updated every business day.
KARACHI: The gold prices in Pakistan increased by Rs1100 per tola in the domestic market on Friday, ARY News reported on Friday quoting APJMA.
According to the All Pakistan Jewellers Manufacturers Association, per tola price of the precious yellow metal hiked by Rs1100 to settle at Rs216,800.
Similarly, the price of 10 grams jacked up by Rs943 to Rs185,871. The price of gold in the international market increased by $10 to $2,067.
Gold prices hovered near a month high on Friday after data suggested easing U.S. price pressures, reassuring investors vouching for a June interest rate cut by the Federal Reserve.
Spot gold edged 0.1% higher to $2,044.60 per ounce, as of 0808 GMT, after hitting $2050.59 on Thursday – its highest level since Feb. 2. Bullion was headed for a second consecutive weekly gain.
Spot platinum fell 0.2% to $871.06 per ounce, and palladium dropped 0.3% to $939.12. Both posted a second monthly decline, with palladium touching more than five-year lows of $849.13.
Spot silver fell 0.4% to $22.59 per ounce.
Yesterday’s revision of fourth-quarter 2023 U.S. gross domestic product readings showed GDP up 3.2%, year-on-year, versus the initial reading of up 3.3%. GDP data was not a big markets-mover, as the numbers did not stray far from market expectations.
The bigger U.S. data point of the week is likely going to be Thursday personal income and outlays report for January which is preferred measure of inflation by US Fed. The most recent U.S. inflation data is a little warmer than anticipated.
Although it wasn’t too hot, the data was nevertheless warm enough to probably convince the Federal Reserve to postpone cutting interest rates until the second half of 2024. The market
Keep in mind that the pricing of Treasury futures move against the more closely watched yields. The last four weeks have seen a decline in the price of US T-Bonds and T-Notes. This implies that Treasury traders believe the U.S. inflation statistics will remain too warm to support a rate cut by the Federal Reserve this spring.
In MCX, price has been confined in narrow range of 61800-62400 for past 7-8 trading sessions. The momentum oscillator is also stuck in neutral at 53 clearly indicating that traders and investors are waiting for PCE data before taking any fresh positions.
Open interest has also declined indicating old positions getting squared off. 62400 seems to be immediate resistance and breach above that will push prices around 63000-63500. On the downside, 61000 is strong support in MCX while $2000 in COMEX. We believe any strong sell off is only probable if COMEX gold sustains below $2000.
(Bhavik Patel is a commodity and currency analyst at Tradebull Securities. Views expressed are the author’s own. Please consult your financial advisor before investing.)
Gold Rate Today In India: On March 1, 2024, gold prices across India experienced a jump. The base price for 10 grams rose to around Rs 63,150. A closer look reveals that the average price for 10 grams of 24-carat gold was approximately Rs 63,160, while 22-carat gold averaged Rs 57,900.
At the same time, the silver market displayed a consistent upward trend, reaching Rs 74,500 per kilogram.
Gold rate today in India: Retail gold price on March 1
Gold Rate Today In Delhi
As of today, March 1, 2024, in Delhi, you would need approximately Rs 58,050 to purchase 10 grams of 22-carat gold and Rs 63,310 for the same amount of 24-carat gold.
Gold Rate Today In Mumbai 22 Carat & 24 Carat
Currently in Mumbai, the price of 10 grams of 22-carat gold stands at Rs 57,900, while the equivalent amount of 24-carat gold is valued at Rs 63,160.
Gold Rate Today In Ahmedabad
In Ahmedabad, the price for 10 grams of 22-carat gold is Rs 57,950, and for the same amount of 24-carat gold, it’s Rs 63,210.
Check gold rates today in different cities on March 1, 2024; (In Rs/10 grams)
| City | 22 Carat Gold Price | 24-Carat Gold Price |
| Chennai | 58,400 | 63,710 |
| Kolkata | 57,900 | 63,160 |
| Gurugram | 58,050 | 63,310 |
| Lucknow | 58,050 | 63,310 |
| Bengaluru | 57,900 | 63,160 |
| Jaipur | 58,050 | 63,310 |
| Patna | 57,950 | 63,210 |
| Bhubaneshwar | 57,900 | 63,160 |
| Hyderabad | 57,900 | 63,160 |
Multi Commodity Exchange
On March 1, 2024, the Multi Commodity Exchange (MCX) saw bleak trading in gold futures contracts expiring on April 5, 2024. These contracts were priced at Rs 62,537 per 10 grams. Additionally, silver futures contracts expiring on May 3, 2024, were quoted at Rs 71,420 on the MCX.
Retail Cost of Gold
The retail price of gold in India, often referred to as the gold rate, is the final cost per unit weight that customers pay when purchasing gold. This price is influenced by several factors beyond the inherent value of the metal itself.
Gold is highly important in India because of its cultural significance, its value for investment, and its traditional role in weddings and festivals.
top videos
Row Over Caste Census Report In Karnataka BJP Says ‘Report Is Unscientific’| Karnataka News| News18
K-Groups Protest Against Rahul Gandhi In The UK | Khalistan News | Rahul Gandhi News | News18
JNU Clash News Today | AISA Statement After Clash With ABVP Inside JNU | English News | News18
Lok Sabha Elections 2024: BJP Top Source-The Party Also Prepares Its List For Madhya Pradesh
No IDF Strike Was Conducted Towards The Aid Convoy’ – Israeli Army Spokesman | Israel Vs Hamas |N18V
2024 Outlook: Rs 70,000 Per 10 Grams Gold Price
According to the All India Gem and Jewellery Domestic Council (GJC), they have recently stated that prevailing global economic uncertainties and geopolitical tensions are expected to propel gold prices to a historic high of Rs 70,000 per 10 grams in the upcoming year. This trajectory underscores gold’s status as a dependable investment and a valuable hedge against inflation.
first published: March 01, 2024, 11:43 IST
KATHMANDU: Gold price increased by Rs 600 per tola in the Nepali market today.
According to the Nepal Gold and Silver Dealers’ Association, the price of fine gold has been fixed at Rs 119,000 per tola and standard gold is traded at Rs 118,450 per tola.
The precious yellow metal was traded at Rs. 118,400 per tola, and standard gold at Rs. 117,850 per tola on Thursday.
Similarly, the price of silver has been fixed at Rs 1,390 per tola today.
The Federation fixes the prices of gold and silver in the domestic market on a daily basis based on the price rates in the international market.
(Kitco News) – Gold and silver prices are higher in midday U.S. trading Thursday, with gold hitting a three-week high, in the wake of an important U.S. inflation report that came in just a bit cooler than expected. Recent U.S. inflation data had come in warmer than expected. Today’s personal income and spending report falls into the camp of the U.S. monetary policy doves, who want to see the Federal Reserve cut interest rates sooner rather than later. Such a scenario can be extrapolated to mean better demand for precious metals and it’s also a bit bearish for the U.S. dollar. April gold was last up $11.30 at $2,054.00. March silver was last up $0.17 at $22.585.
The U.S. data point of the week saw Thursday morning’s personal income and outlays report for January, which includes the personal consumption expenditures (PCE) inflation indexes, show the personal income component up a stronger-than-expected 1.0% in January, compared to expectations for a rise of only 0.3%. Personal spending was up 0.2% in January, as expected. However, the inflation numbers were a bit less than expected. The PCE price index was up 0.3% month-on-month and up 2.4%, year-on-year. The core PCE price index was up 0.4% in January and up 2.8%, year-on-year. The PCE price index in January was expected to be up 2.6%, year-on-year, while the core PCE price index was expected to be up 2.9% in the same period.
Asian and European stock markets were mixed in overnight trading. U.S. stock index futures are set to open higher when the New York day session begins and rallied after the personal income report.
Bitcoin prices have soared this week and are presently trading around $62,700. Barron’s this week reported bitcoin’s rise is due to better risk appetite in the marketplace, the big rally in the technology heavy Nasdaq stock index, and notions the Federal Reserve will lower U.S. interest rates later this year.
Broker SP Angel said this morning in an email dispatch that China has signaled more fiscal pump-priming for its economy. The Chinese politburo has vowed to make the policy environment “transparent and predictable” in reaction to weak business and consumer confidence. Chinese leadership is signaling it intends to double down on more fiscal instruments to support the economy. “President Xi is pushing ‘disruptive innovation’ and technology self-reliance which, we suspect, is best led by a number of tech entrepreneurs than state-led companies, particularly when it comes to semiconductors and AI,” said the broker.
The key outside markets today see the U.S. dollar index a bit firmer. Nymex crude oil prices are up and trading around $79.00 a barrel.
The yield on the benchmark 10-year U.S. Treasury note is presently fetching 4.232%. Bond yields down-ticked after today’s inflation report.
Technically, April gold futures prices hit a three-week high today. The bulls and bears are back on a level overall near-term technical playing field. A three-month-old downtrend on the daily bar chart has been negated. Bulls’ next upside price objective is to produce a close above solid resistance at the February high of $2,083.20. Bears’ next near-term downside price objective is pushing futures prices below solid technical support at $2,000.00. First resistance is seen at today’s high of $2,059.40 and then at $2,075.00. First support is seen at this week’s low of $2,033.40 and then at $2,025.00. Wyckoff’s Market Rating: 5.0.
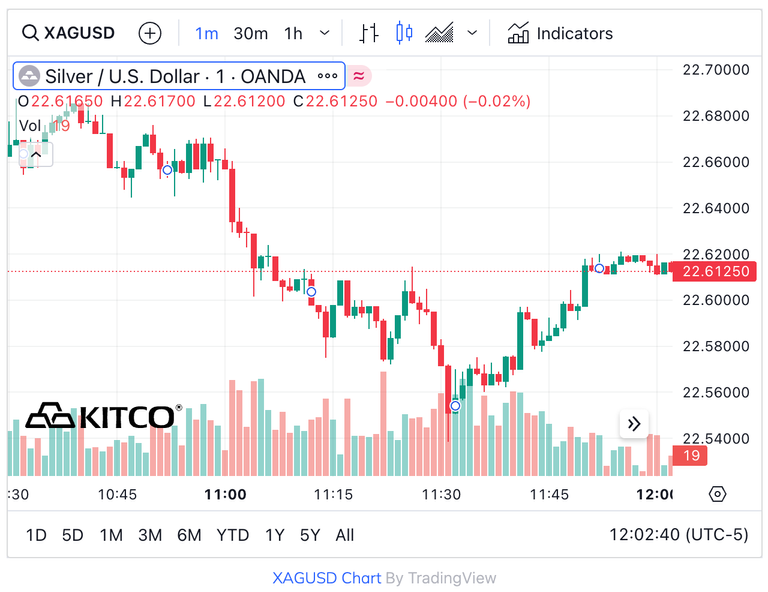
March silver futures bears have the overall near-term technical advantage. Silver bulls’ next upside price objective is closing prices above solid technical resistance at the February high of $23.56. The next downside price objective for the bears is closing prices below solid support at the February low of $21.975. First resistance is seen at today’s high of $22.775 and then at $23.00. Next support is seen at this week’s low of $22.245 and then at $22.00. Wyckoff’s Market Rating: 3.5.
March N.Y. copper closed up 120 points at 383.10 cents today. Prices closed nearer the session low today. The copper bulls have the slight overall near-term technical advantage. Copper bulls’ next upside price objective is pushing and closing prices above solid technical resistance at the January high of 394.70 cents. The next downside price objective for the bears is closing prices below solid technical support at the February low of 365.50 cents. First resistance is seen at this week’s high of 387.15 cents and then at last week’s high of 390.85 cents. First support is seen at this week’s low of 380.15 cents and then at 375.00 cents. Wyckoff’s Market Rating: 5.0.
Hey!! Try out my “Markets Front Burner” weekly email report. Front Burner is my best writing and analysis, I think, because I get to look ahead at the marketplace and do some market price forecasting. Plus, I’ll throw in an educational feature to move you up the ladder of trading/investing success. And it’s free! Email me at jim@jimwyckoff.com and I’ll add your email address to the Front Burner list.
Disclaimer: The views expressed in this article are those of the author and may not reflect those of Kitco Metals Inc. The author has made every effort to ensure accuracy of information provided; however, neither Kitco Metals Inc. nor the author can guarantee such accuracy. This article is strictly for informational purposes only. It is not a solicitation to make any exchange in commodities, securities or other financial instruments. Kitco Metals Inc. and the author of this article do not accept culpability for losses and/ or damages arising from the use of this publication.


