
Category: Forex News, News
Gold Price Forecast: Gold Poised to Break $4,200 as Oil Price Slump Eases Inflation Fears
TradingKey – As of the Asian session on July 27, gold prices ( XAUUSD) opened with a strong gap up today and maintained its upward momentum intraday, briefly breaking through $4,100 during the session to hit a high of $4,116. From a market perspective, gold prices rebounded after being weighed down last week by surging oil prices and expectations of Federal Reserve interest rate hikes. The primary driver was signs of a pause in clashes between the U.S. and Iran, which caused international oil prices to fall sharply, easing market concerns that energy prices would push up U.S. inflation.
From a fundamental perspective, the core factor influencing gold price trends recently has been the US-Iran situation. Previously, the escalating conflict between the US and Iran over the Strait of Hormuz and Gulf shipping security pushed Brent crude prices above $100 at one point. The market worried that rising energy prices would drive US inflation back up and force the Federal Reserve to maintain high interest rates for longer, or even keep the possibility of further rate hikes on the table, putting downward pressure on gold.

However, the US-Iran situation showed clear signs of cooling over the weekend. According to reports, Iran stated that as long as the US stops its attacks, Iran will also suspend its own attacks; meanwhile, the US has also suspended its bombing campaign against Iran. The latest reactions from both sides have temporarily pushed the US-Iran conflict into a de-escalation phase, easing market concerns over supply disruption risks in the Strait of Hormuz. Consequently, oil prices fell sharply, with Brent crude ( UKOIL) falling over 13% at one point today, and WTI crude ( USOIL) falling over 7%. The drop in oil prices is indirectly positive for gold, as falling energy prices help ease inflation expectations and weaken market bets on aggressive Fed rate hikes.
Brent crude price trend, Source: TradingView
It is worth noting that the risks of the US-Iran situation have not been truly resolved. Although both sides have suspended fire, this is currently a temporary de-escalation rather than a lasting peace agreement. The core conflicts between the US and Iran over transit rights in the Strait of Hormuz, Iran’s military capabilities, and its regional influence remain unresolved. Meanwhile, Yemen’s Houthi rebels continue to attack energy facilities along Saudi Arabia’s Red Sea coast, indicating that Middle East energy transit risks have not fully subsided. Should vessels in the Gulf or Red Sea routes be attacked again, or if port blockades or military retaliation occur in the future, oil prices could rebound, and gold could once again fall under pressure.
In addition, the Federal Reserve’s July interest rate meeting is coming up this week. The Fed will hold its interest rate policy meeting from July 28 to 29, and the market widely expects a high probability of rates being held steady, though uncertainty remains over whether it will hike rates in September. If Federal Reserve Chairman Kevin Warsh emphasizes falling oil prices and easing inflationary pressures in his post-meeting speech, gold may continue to benefit; however, if he continues to emphasize that inflation remains above target and the Fed should not rush to cut rates for the time being, the upside for gold prices will remain capped.
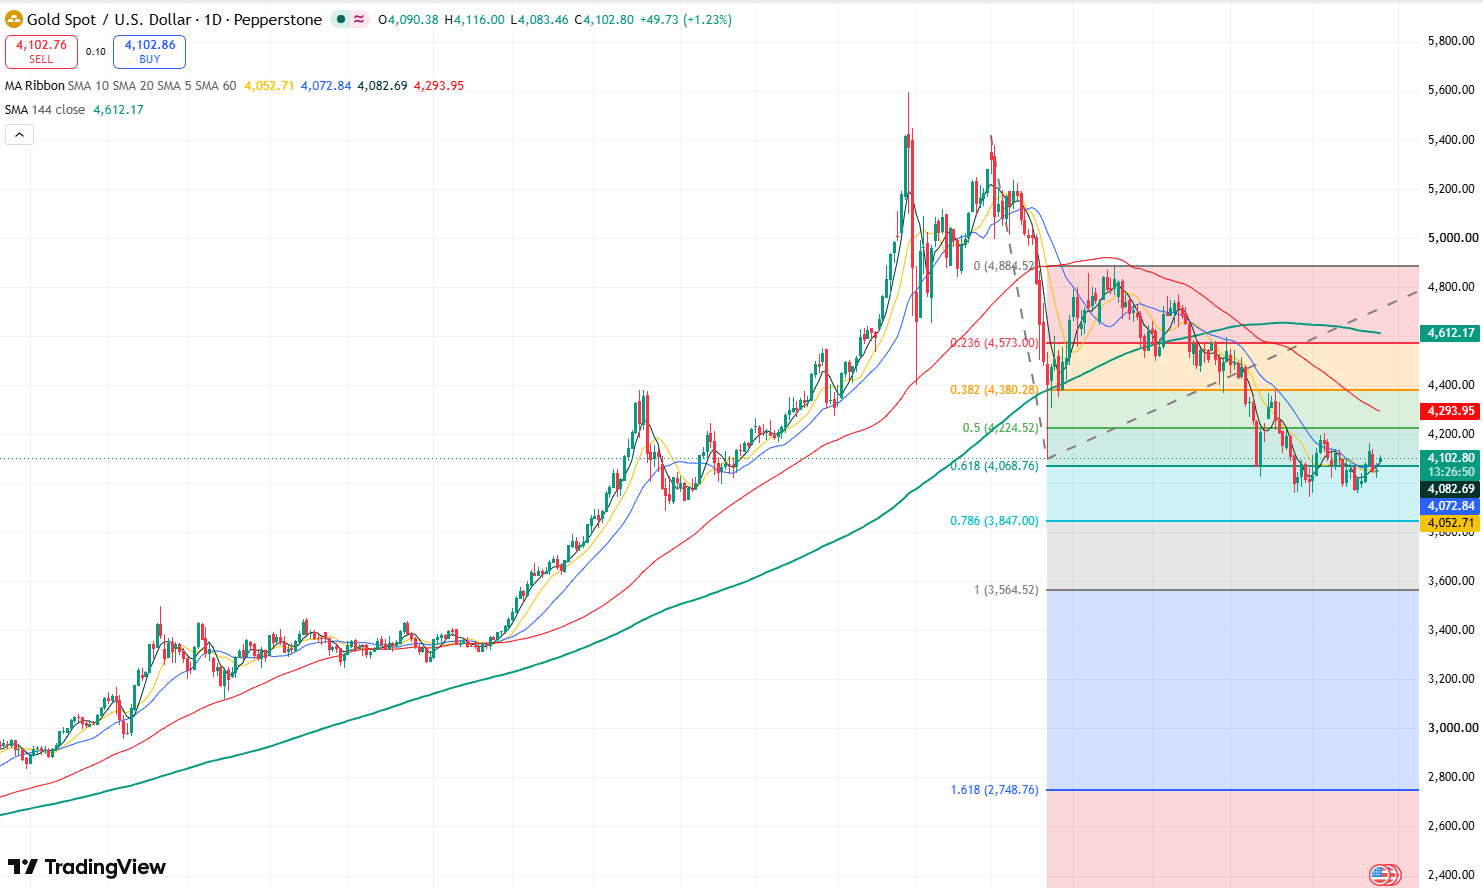
Gold price daily chart, Source: TradingView

Looking at gold’s daily chart, today’s gold price opened nearly $40 higher, supported by positive news of easing US-Iran tensions, indicating that market bullish sentiment has been boosted by the news, which may support a continued short-term rise in gold prices. Meanwhile, the moving average system shows that the gold price trend was previously suppressed by the 20-day moving average, but the recent trend has successfully broken through the resistance of the 20-day moving average, demonstrating that the market’s bullish momentum has been further strengthened.
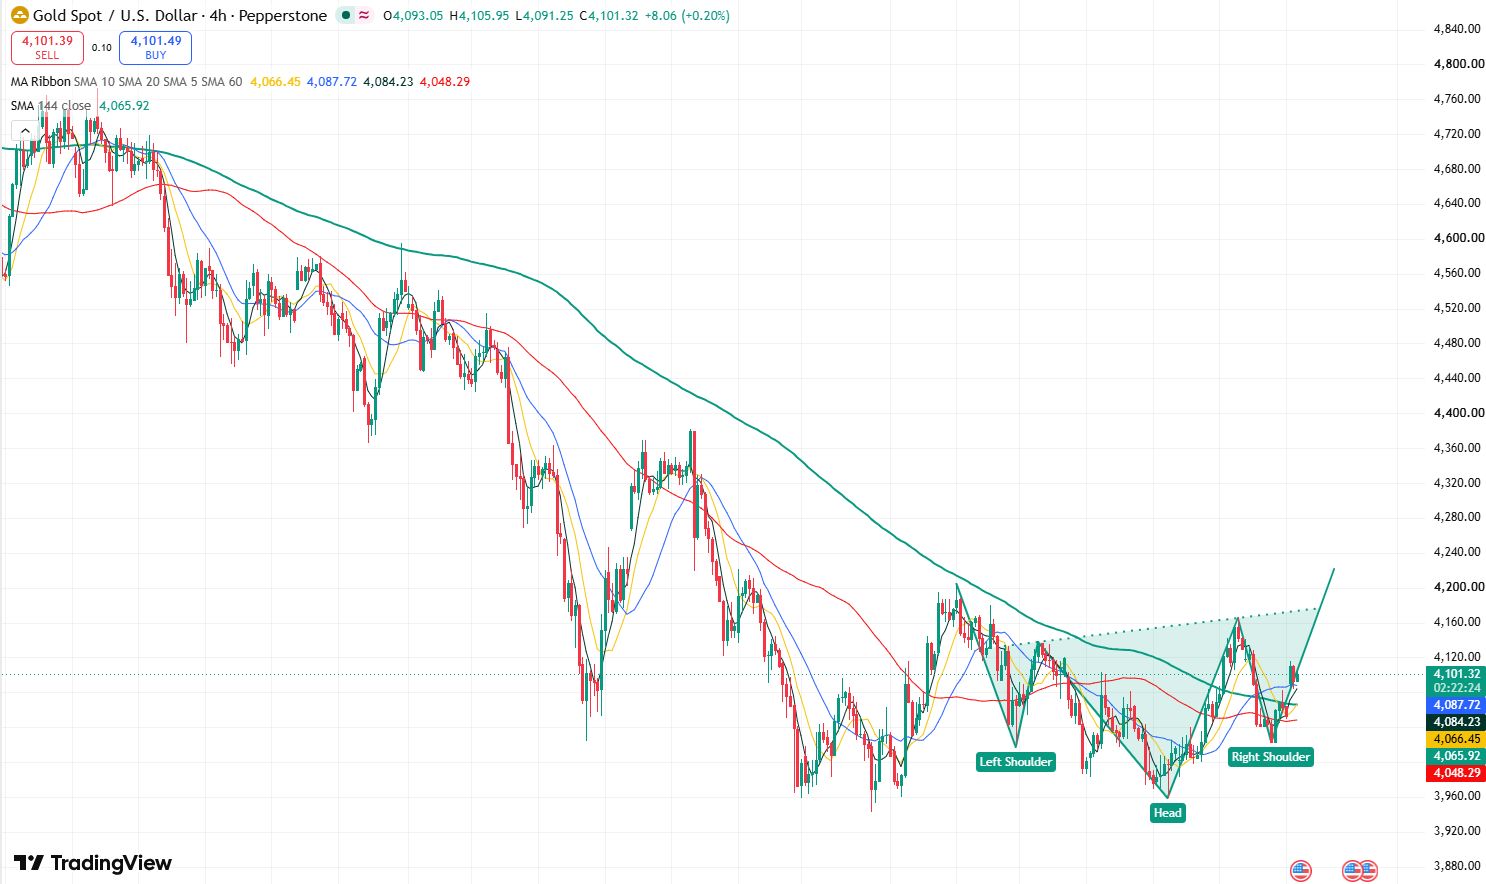
Gold price 4-hour chart, Source: TradingView
Looking at gold’s 4-hour chart, gold’s candlestick structure has formed an inverse head and shoulders pattern, which means that gold’s bullish momentum has been significantly enhanced, and the gold price will continue to rise in the short term. The primary upside target will be to break above the $4,200 resistance level, with the next hurdle at the $4,300 mark. If the gold price can break through $4,300, it will further test the key resistance level at $4,380.
On the downside, the primary support level for gold to watch is around $4,084. If this level is breached, the gold price may move downward to fill today’s gap, potentially falling back to around $4,050. If it continues to fall, it may further test the support level near $4,020.
This content was translated using AI and reviewed for clarity. It is for informational purposes only.


Written by : Editorial team of BIPNs
Main team of content of bipns.com. Any type of content should be approved by us.








Share this article: