
Category: Forex News, News
How Low Can Gold Go? This New XAU/USD Price Prediction Shows 28% Drop Risk to $3,400
Gold traded
at $4,793 per ounce on Monday, April 20, 2026, falling 0.9% after the US Navy
seized an Iranian-flagged cargo vessel in the Gulf of Oman, sending Brent crude
up 5.33% to $95.20 and reigniting the inflation concerns that have pinned
bullion inside a month-long consolidation range.
Spot
XAU/USD sits roughly 14% below the $5,595 all-time high set on January 29 and
has failed three times at $4,800 resistance reinforced by the 50-day EMA. For
the first time since the February peak, the primary gold price prediction
question is no longer “how high,” but “how low can gold
go.”

Three
catalysts define this week: the US-Iran ceasefire expires Wednesday, the Fed’s
preferred PCE inflation print lands Friday, and Strait of Hormuz transits
collapsed to zero on Sunday from a pre-war daily average of 138.
Follow
me on X for real-time gold market analysis: @ChmielDk
“Gold
was under pressure on Monday as rising uncertainty over the geopolitical
situation in the Middle East lifted oil prices and reignited inflation
concerns,” said Konstantinos Chrysikos, Head of Customer Relationship
Management at Kudotrade.
The USS
Spruance intercepted the Iranian-flagged Touska over the weekend, with US
Marines taking custody after warnings to stop were ignored. Iran shut the
Strait of Hormuz again on Saturday, citing US breaches of the ceasefire, and
redirected at least 25 commercial vessels away from Iranian ports.
The selloff
runs through the monetary channel before it runs through flows. Energy prices
are pushing Treasury yields higher across maturities, raising the opportunity
cost of holding non-yielding bullion. The Dollar Index climbed to 98.47, making
gold more expensive for non-dollar buyers and capping the safe-haven bid that
would normally emerge from an active naval standoff.
Flow data
is the softer pillar. Gold-backed ETFs recorded two consecutive weeks of
inflows through mid-April after March produced the largest monthly outflows in
five years, but a sustained rise in yields puts that bid back at risk.

“While
ongoing central bank purchases and persistent tensions in Eastern Europe
provide a longer-term floor, sustained strength in yields and the dollar could
keep the metal under pressure in the near term,” Chrysikos added.
As I wrote
in my previous UBP analysis, the Swiss private bank lifted gold
exposure back to 6% of discretionary portfolios from an Iran-war low of 3%,
reinforcing the structural floor argument even as near-term pressure builds.
The four
drivers weighing on gold price today:
- US naval action: USS Spruance seized the
Iranian cargo vessel Touska, escalating the Strait of Hormuz standoff - Energy shock: Brent crude up 5.33% to
$95.20, WTI up 6.03% to $88.91 - Dollar strength: DXY climbed to 98.47, its
highest in over a week - ETF flow risk: Two weeks of inflows at risk
of reversing as Treasury yields rise
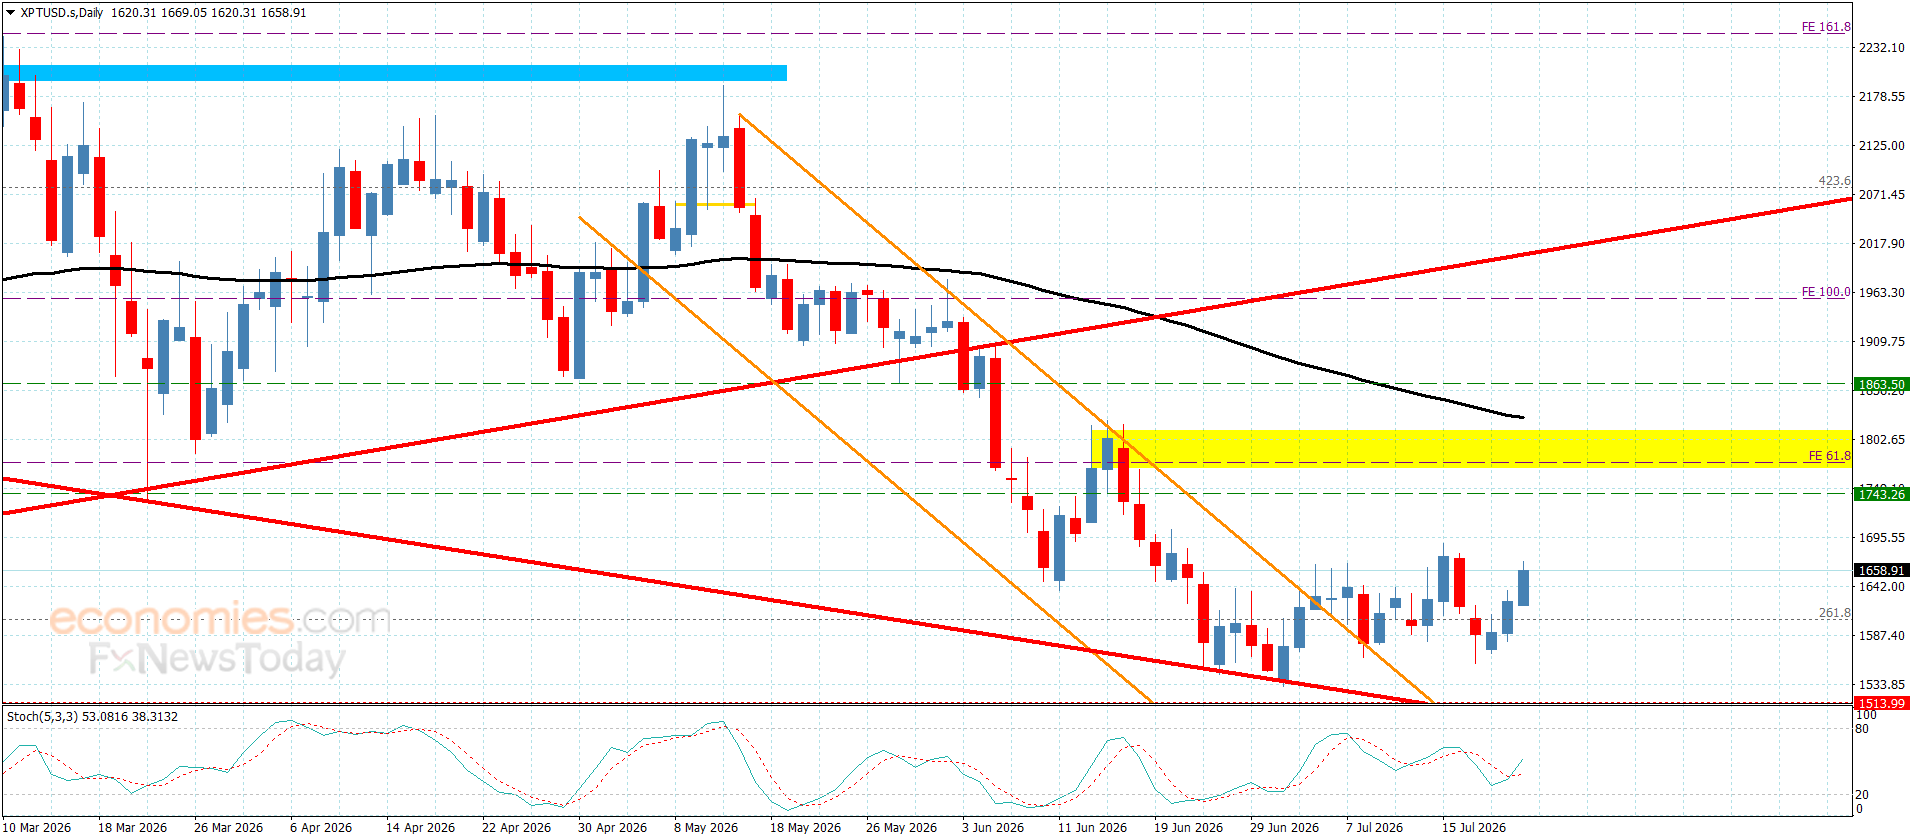
Gold technical analysis:
the path to $3,400
My chart
structure has not changed in three weeks. Gold remains trapped in a
consolidation bounded by the October 2025 breakout zone at $4,281 to $4,368 on
the downside and $4,800 resistance reinforced by the 50-day EMA on the upside.
Gold tried to break the $4,800 cap at the end of last week and failed, printing
a rejection candle that resolved into today’s 0.9% decline. My bias inside the
range has shifted from neutral to mildly bearish after that third failed test.
Here is
where “how low can gold go” gets specific. My Fibonacci extension,
stretched across the correction from the January all-time high and the current
March-April rebound, places the 100% extension at approximately $3,400 per
ounce. That target is not arbitrary. The $3,400 zone acted as resistance from
April through August 2025 before bullion broke out into the parabolic autumn
move that eventually carried price to $5,595.
Old
resistance retested as support, if it fails, typically draws price back to its
original breakout level. A 28% decline from the current $4,793 spot sounds
extreme, but as I established in my earlier Fibonacci analysis, the same extension math that
framed the upside target at $7,000-plus also frames the downside risk with
equal validity.
A downside How low can gold go? Source: Tradingview.com
break of the $4,281 floor on a weekly close would confirm the bearish scenario.
An upside break of $4,800 on strong volume opens $5,400 as the next resistance,
which was the closing high on January 28 and still represents the highest ever
daily close for gold. Until one side breaks with conviction, the $4,281 to
$4,800 range remains the operating framework.
Key gold price levels
|
Level |
Type |
Notes |
|
$5,400 |
Resistance |
January |
|
$4,800 |
Resistance |
50-day |
|
$4,793 |
Spot |
Monday, April 20, 2026 |
|
$4,368 |
Support |
Upper October 2025 breakout zone |
|
$4,281 |
Support |
Lower |
|
$3,400 |
Bearish target |
100% |
Gold price predictions
2026
External
forecasts for year-end 2026 span an unusually wide range, reflecting genuine
disagreement about whether the March crash cleared excess leverage or marked a
structural top. As the FinanceMagnates.com February gold
report detailed, a
Reuters poll of 30 analysts placed the median 2026 gold forecast at $4,746.50
per ounce, roughly 1% below today’s spot.
On the bull
side, JPMorgan holds the highest major-bank target at $6,300, built on
approximately 800 tonnes of projected central-bank buying. Deutsche Bank and
UBP both target $6,000. Goldman Sachs maintains $5,400 despite March’s worst
monthly decline since 2013, with analysts Daan Struyven and Lina Thomas arguing
that the buyers who drove the 2025 rally have not left and do not need a new
wave of participants to hit the target, as I wrote in my earlier Goldman analysis. UBS sits at $5,600 but has flagged
the move as the late stage of the bull cycle, according to precious-metals
strategist Joni Teves.
The bear
framework is narrower but credible. State Street assigns 20% probability to a
$4,000 to $4,750 year-end range, flagging $4,000 to $4,100 as the structural
floor. As I wrote in my previous WGC analysis, the World Gold Council’s Reflation
Return scenario models a 5% to 20% decline to $3,360 to $3,990 if Trump’s
reflation policies succeed and the Fed stays restrictive. My $3,400 Fibonacci
target sits squarely inside that institutional bear zone.
Institutional gold price predictions
|
Source |
Target |
Notes |
|
JPMorgan |
$6,300 |
Year-end |
|
UBP / Deutsche Bank |
$6,000 |
Year-end 2026, structural revaluation |
|
UBS |
$5,600 |
Year-end |
|
Goldman Sachs |
$5,400 |
Year-end |
|
Reuters poll median |
$4,746.50 |
2026 average, 30-analyst survey |
|
State Street |
$4,000 |
20% |
|
World Gold Council |
$3,360-$3,990 |
Reflation Return scenario, 5-20% decline |
|
My Fibonacci target |
$3,400 |
100% extension if $4,281 breaks |
Frequently asked questions
How low can gold go in
2026?
My
Fibonacci extension projects a 28% drop to $3,400 per ounce if gold breaks
below the $4,281 October 2025 support. State Street assigns 20% probability to
a $4,000 to $4,750 year-end range, flagging $4,000 to $4,100 as the structural
floor. The World Gold Council’s Reflation Return scenario models $3,360 to
$3,990. A weekly close below $4,281 confirms the bearish path.
Why is gold price falling
today?
Gold fell
0.9% to $4,793 on Monday, April 20, 2026, after the US Navy seized an Iranian
cargo vessel in the Gulf of Oman. Brent crude surged 5.33% to $95.20, pushing
Treasury yields higher and the Dollar Index to 98.47. Rising yields raise the
opportunity cost of holding non-yielding bullion, while the stronger dollar
makes gold more expensive for non-dollar buyers.
What is the gold price
prediction for year-end 2026?
Institutional
forecasts span $4,000 to $6,300 for year-end 2026. JPMorgan targets $6,300, UBP
and Deutsche Bank $6,000, UBS $5,600, Goldman Sachs $5,400. State Street flags
$4,000 as the bear-case floor with 20% probability. The Reuters poll median
across 30 analysts sits at $4,746.50 per ounce for the 2026 average, roughly 1%
below current spot.
What happens if gold
breaks below $4,300?
A confirmed
weekly close below $4,281 invalidates the October 2025 breakout and opens the
200-day moving average near $4,260 as the next test. Below that cluster, my
Fibonacci extension targets $3,400, the same zone that capped price between
April and August 2025. State Street views $4,000 to $4,100 as the structural
bull-bear dividing line for year-end 2026.
Is gold still in a bull
market?
Technically,
yes. Gold remains up roughly 40% year-over-year and 14% below the January
$5,595 all-time high, but still trading inside a multi-month consolidation
rather than a confirmed downtrend. A weekly close below $4,281 would be the
first major warning sign. As I wrote in my March crash analysis, the $4,200 to $4,280 zone is the
bull-bear line.
Gold traded
at $4,793 per ounce on Monday, April 20, 2026, falling 0.9% after the US Navy
seized an Iranian-flagged cargo vessel in the Gulf of Oman, sending Brent crude
up 5.33% to $95.20 and reigniting the inflation concerns that have pinned
bullion inside a month-long consolidation range.
Spot
XAU/USD sits roughly 14% below the $5,595 all-time high set on January 29 and
has failed three times at $4,800 resistance reinforced by the 50-day EMA. For
the first time since the February peak, the primary gold price prediction
question is no longer “how high,” but “how low can gold
go.”
Three
catalysts define this week: the US-Iran ceasefire expires Wednesday, the Fed’s
preferred PCE inflation print lands Friday, and Strait of Hormuz transits
collapsed to zero on Sunday from a pre-war daily average of 138.
Follow
me on X for real-time gold market analysis: @ChmielDk
“Gold
was under pressure on Monday as rising uncertainty over the geopolitical
situation in the Middle East lifted oil prices and reignited inflation
concerns,” said Konstantinos Chrysikos, Head of Customer Relationship
Management at Kudotrade.
The USS
Spruance intercepted the Iranian-flagged Touska over the weekend, with US
Marines taking custody after warnings to stop were ignored. Iran shut the
Strait of Hormuz again on Saturday, citing US breaches of the ceasefire, and
redirected at least 25 commercial vessels away from Iranian ports.
The selloff
runs through the monetary channel before it runs through flows. Energy prices
are pushing Treasury yields higher across maturities, raising the opportunity
cost of holding non-yielding bullion. The Dollar Index climbed to 98.47, making
gold more expensive for non-dollar buyers and capping the safe-haven bid that
would normally emerge from an active naval standoff.
Flow data
is the softer pillar. Gold-backed ETFs recorded two consecutive weeks of
inflows through mid-April after March produced the largest monthly outflows in
five years, but a sustained rise in yields puts that bid back at risk.
“While
ongoing central bank purchases and persistent tensions in Eastern Europe
provide a longer-term floor, sustained strength in yields and the dollar could
keep the metal under pressure in the near term,” Chrysikos added.
As I wrote
in my previous UBP analysis, the Swiss private bank lifted gold
exposure back to 6% of discretionary portfolios from an Iran-war low of 3%,
reinforcing the structural floor argument even as near-term pressure builds.
The four
drivers weighing on gold price today:
- US naval action: USS Spruance seized the
Iranian cargo vessel Touska, escalating the Strait of Hormuz standoff - Energy shock: Brent crude up 5.33% to
$95.20, WTI up 6.03% to $88.91 - Dollar strength: DXY climbed to 98.47, its
highest in over a week - ETF flow risk: Two weeks of inflows at risk
of reversing as Treasury yields rise
Gold technical analysis:
the path to $3,400
My chart
structure has not changed in three weeks. Gold remains trapped in a
consolidation bounded by the October 2025 breakout zone at $4,281 to $4,368 on
the downside and $4,800 resistance reinforced by the 50-day EMA on the upside.
Gold tried to break the $4,800 cap at the end of last week and failed, printing
a rejection candle that resolved into today’s 0.9% decline. My bias inside the
range has shifted from neutral to mildly bearish after that third failed test.
Here is
where “how low can gold go” gets specific. My Fibonacci extension,
stretched across the correction from the January all-time high and the current
March-April rebound, places the 100% extension at approximately $3,400 per
ounce. That target is not arbitrary. The $3,400 zone acted as resistance from
April through August 2025 before bullion broke out into the parabolic autumn
move that eventually carried price to $5,595.
Old
resistance retested as support, if it fails, typically draws price back to its
original breakout level. A 28% decline from the current $4,793 spot sounds
extreme, but as I established in my earlier Fibonacci analysis, the same extension math that
framed the upside target at $7,000-plus also frames the downside risk with
equal validity.
A downside How low can gold go? Source: Tradingview.com
break of the $4,281 floor on a weekly close would confirm the bearish scenario.
An upside break of $4,800 on strong volume opens $5,400 as the next resistance,
which was the closing high on January 28 and still represents the highest ever
daily close for gold. Until one side breaks with conviction, the $4,281 to
$4,800 range remains the operating framework.
Key gold price levels
|
Level |
Type |
Notes |
|
$5,400 |
Resistance |
January |
|
$4,800 |
Resistance |
50-day |
|
$4,793 |
Spot |
Monday, April 20, 2026 |
|
$4,368 |
Support |
Upper October 2025 breakout zone |
|
$4,281 |
Support |
Lower |
|
$3,400 |
Bearish target |
100% |
Gold price predictions
2026
External
forecasts for year-end 2026 span an unusually wide range, reflecting genuine
disagreement about whether the March crash cleared excess leverage or marked a
structural top. As the FinanceMagnates.com February gold
report detailed, a
Reuters poll of 30 analysts placed the median 2026 gold forecast at $4,746.50
per ounce, roughly 1% below today’s spot.
On the bull
side, JPMorgan holds the highest major-bank target at $6,300, built on
approximately 800 tonnes of projected central-bank buying. Deutsche Bank and
UBP both target $6,000. Goldman Sachs maintains $5,400 despite March’s worst
monthly decline since 2013, with analysts Daan Struyven and Lina Thomas arguing
that the buyers who drove the 2025 rally have not left and do not need a new
wave of participants to hit the target, as I wrote in my earlier Goldman analysis. UBS sits at $5,600 but has flagged
the move as the late stage of the bull cycle, according to precious-metals
strategist Joni Teves.
The bear
framework is narrower but credible. State Street assigns 20% probability to a
$4,000 to $4,750 year-end range, flagging $4,000 to $4,100 as the structural
floor. As I wrote in my previous WGC analysis, the World Gold Council’s Reflation
Return scenario models a 5% to 20% decline to $3,360 to $3,990 if Trump’s
reflation policies succeed and the Fed stays restrictive. My $3,400 Fibonacci
target sits squarely inside that institutional bear zone.
Institutional gold price predictions
|
Source |
Target |
Notes |
|
JPMorgan |
$6,300 |
Year-end |
|
UBP / Deutsche Bank |
$6,000 |
Year-end 2026, structural revaluation |
|
UBS |
$5,600 |
Year-end |
|
Goldman Sachs |
$5,400 |
Year-end |
|
Reuters poll median |
$4,746.50 |
2026 average, 30-analyst survey |
|
State Street |
$4,000 |
20% |
|
World Gold Council |
$3,360-$3,990 |
Reflation Return scenario, 5-20% decline |
|
My Fibonacci target |
$3,400 |
100% extension if $4,281 breaks |
Frequently asked questions
How low can gold go in
2026?
My
Fibonacci extension projects a 28% drop to $3,400 per ounce if gold breaks
below the $4,281 October 2025 support. State Street assigns 20% probability to
a $4,000 to $4,750 year-end range, flagging $4,000 to $4,100 as the structural
floor. The World Gold Council’s Reflation Return scenario models $3,360 to
$3,990. A weekly close below $4,281 confirms the bearish path.
Why is gold price falling
today?
Gold fell
0.9% to $4,793 on Monday, April 20, 2026, after the US Navy seized an Iranian
cargo vessel in the Gulf of Oman. Brent crude surged 5.33% to $95.20, pushing
Treasury yields higher and the Dollar Index to 98.47. Rising yields raise the
opportunity cost of holding non-yielding bullion, while the stronger dollar
makes gold more expensive for non-dollar buyers.
What is the gold price
prediction for year-end 2026?
Institutional
forecasts span $4,000 to $6,300 for year-end 2026. JPMorgan targets $6,300, UBP
and Deutsche Bank $6,000, UBS $5,600, Goldman Sachs $5,400. State Street flags
$4,000 as the bear-case floor with 20% probability. The Reuters poll median
across 30 analysts sits at $4,746.50 per ounce for the 2026 average, roughly 1%
below current spot.
What happens if gold
breaks below $4,300?
A confirmed
weekly close below $4,281 invalidates the October 2025 breakout and opens the
200-day moving average near $4,260 as the next test. Below that cluster, my
Fibonacci extension targets $3,400, the same zone that capped price between
April and August 2025. State Street views $4,000 to $4,100 as the structural
bull-bear dividing line for year-end 2026.
Is gold still in a bull
market?
Technically,
yes. Gold remains up roughly 40% year-over-year and 14% below the January
$5,595 all-time high, but still trading inside a multi-month consolidation
rather than a confirmed downtrend. A weekly close below $4,281 would be the
first major warning sign. As I wrote in my March crash analysis, the $4,200 to $4,280 zone is the
bull-bear line.
Source link


Written by : Editorial team of BIPNs
Main team of content of bipns.com. Any type of content should be approved by us.


Share this article: