The main category of All News Articles.

You can use the search box below to find what you need.

[wd_asp id=1]

27 04, 2026

Goldman Sachs raises Brent oil price forecast to $90

By |2026-04-27T16:00:39+03:00April 27, 2026|Forex News, News|0 Comments


Goldman Sachs has revised its oil price forecasts upward amid escalating risks surrounding the Strait of Hormuz and potential supply disruptions in the Persian Gulf.

Operative Information Center-OMM reports that the adjustment was highlighted in a recent Bloomberg analysis. The investment bank now expects Brent crude to average $90 per barrel in the fourth quarter, a significant increase from its previous estimate of $80 per barrel.

According to the bank’s analysts, the shift is primarily driven by a possible sharp decrease in oil supply from the Persian Gulf region. Goldman Sachs suggests that regional exports may not fully recover until the end of June. Furthermore, the bank projects a substantial supply deficit of approximately 9.6 million barrels per day in the global market during the current quarter, warning of potential negative impacts on the global economy if prices continue to climb.

The Strait of Hormuz remains one of the world’s most critical maritime chokepoints, with approximately one-fifth of the world’s total oil consumption passing through it daily. Any geopolitical instability in this region traditionally leads to volatility in global energy markets. For Azerbaijan, a significant exporter of crude oil and natural gas, fluctuations in global oil prices directly influence state revenues and the implementation of large-scale reconstruction projects in the liberated territories of Garabagh and East Zangezur.


Source link

27 04, 2026

USD/JPY forecast: triangle forms ahead of FOMC, BoJ rate decisions

By |2026-04-27T15:53:02+03:00April 27, 2026|Forex News, News|0 Comments

The USD/JPY exchange rate will be in the spotlight this week as the Federal Reserve and the Bank of Japan (BoJ) publish their interest rate decisions. It was trading slightly below the important resistance level at 160 as traders wait for these events and as the Iran crisis continued.

BoJ interest rate decision

The USD to Japanese yen will be in focus this week as the BoJ releases the latest interest rate decision. Economists expect the bank to leave interest rates unchanged at 0.75% as it observes the impact of the ongoing war to the economy. 

A report released on Friday showed that Japan’s inflation continued rising in March as the war boosted energy prices. This rise will continue as there are signs that the blockade of the Strait of Hormuz will continue for a while.

The US has been open to talks with Iran, which the latter has resisted. Last week, the Iranians remained non-commital on talks even as President Donald Trump insisted that they would happen. At some point, he noted that JD Vance was on his way to Pakistan only for his motorcade to show up in the White House.

The same situation happened during the weekend. To save face, Trump shared that the team would not travel to Pakistan, citing the fact that Iranian leaders were divided. Iran has rejected these claims.

In addition to the headline decision, the BoJ will likely provide a guidance on what to expect in the upcoming meetings. For one, the IMF has called for the bank to hike interest rates, which analysts believe is possible. Officials will also highlight measures to boost the Japanese yen, which has crashed in the past few years.

Federal Reserve decision and key macro data

The next key catalyst for the USD/JPY will be the upcoming Federal Reserve decision on Wednesday. Like the BoJ, analysts expect the bank to leave interest rates unchanged between 3.50% and 3.75% in this meeting.

The bank, which has been under pressure to cut rates from Trump, sees no need to do so as inflation remains high. The most recent data showed that the headline consumer inflation jumped to 3.3% and the OECD expects it will rise to 4.3% this year.

Worse, there are signs that the US is moving towards a stagflation, a period characterized by high inflation and slow economic growth. For example, an economic report expected this week will show that the economy expanded by less than two percent in the first quarter.

USD/JPY technical analysis

USDJPY chart | Source: TradingView

The weekly chart shows that the USD to JPY pair has moved to the psychological level at 160. It has moved comfortably above the 50-week and 100-week moving averages, a sign that bulls are in control.

The pair has formed an ascending triangle pattern, which is made up of a horizontal support and a diagonal line. Therefore, the most likely scenario is where it rebounds, potentially to the key resistance level at 163.

Source link

27 04, 2026

Brent crude prices: Oil prices prediction: Goldman Sachs raises Brent crude, WTI rates. Check today’s price

By |2026-04-27T11:59:57+03:00April 27, 2026|Forex News, News|0 Comments


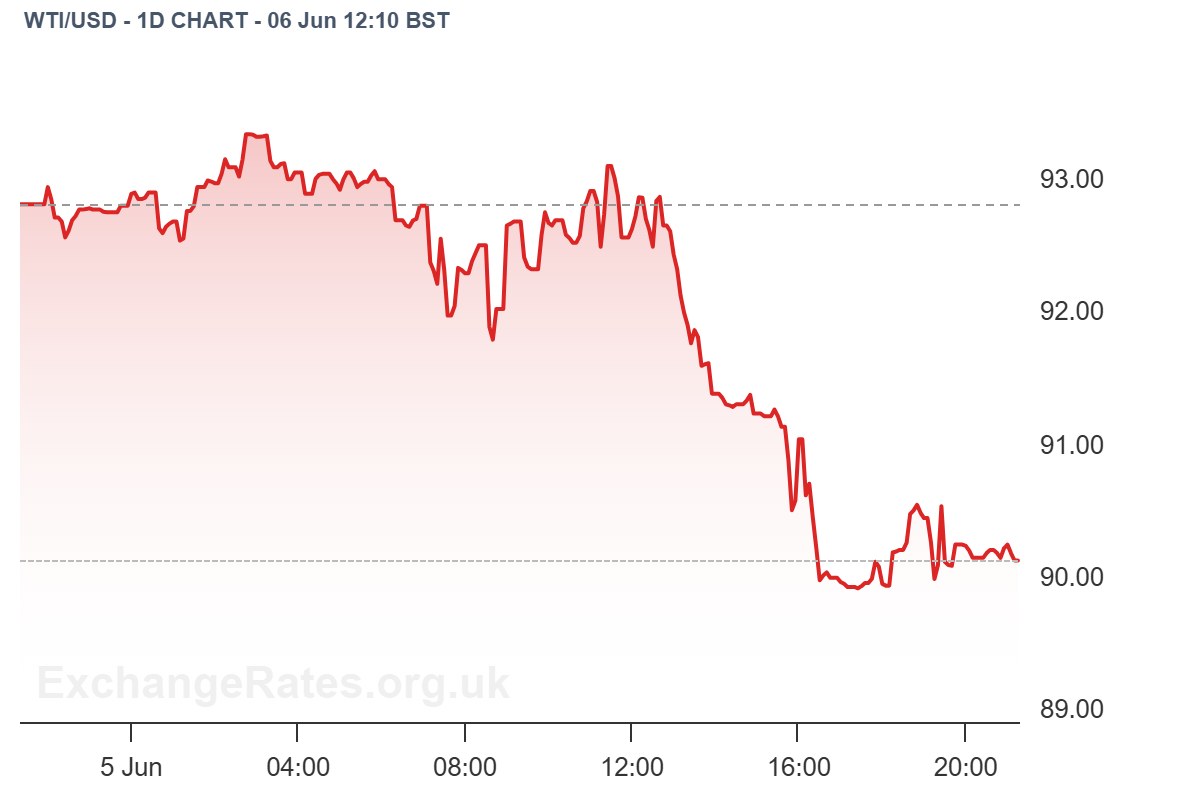
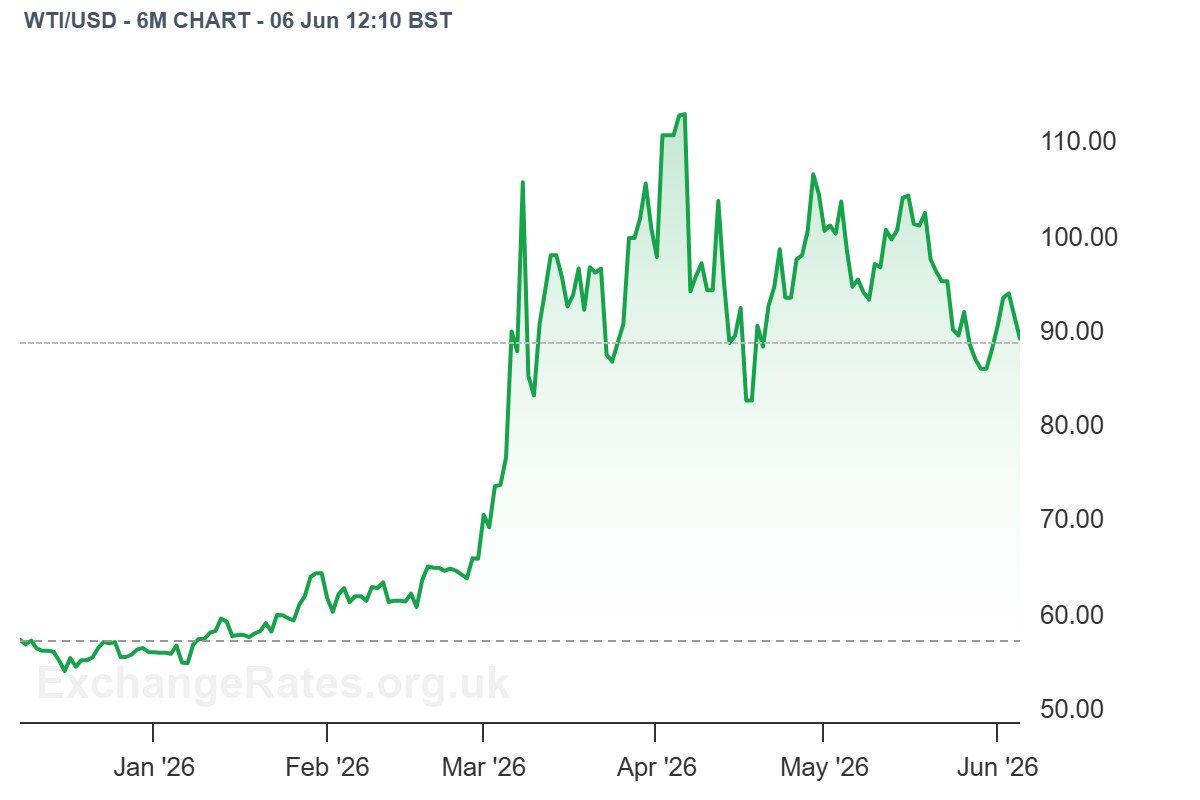
Oil Prices today: Goldman Sachs has raised its oil price forecasts for the fourth quarter ‌to $90 a ⁠barrel for ⁠Brent crude and $83 for U.S. West Texas Intermediate (WTI), on lower output from the Middle East.

“The ⁠economic risks ‌are ​larger ​than our ⁠crude base case alone suggests because ​of the net ​upside risks to oil prices, unusually high refined product prices, ‌products shortages risks, and the unprecedented ​scale ​of ⁠the shock,” GS analysts led by Daan Struyven said ​in an April 16 note.

Oil prices extended gains on Monday, rising nearly 2 per cent as peace talks between the U.S. and Iran stalled while shipments through the Strait of Hormuz remained limited, keeping global oil supplies tight.

Brent crude futures rose $2.16, or 2.05 per cent, to $107.49 a barrel, the highest since ‌April 7, ⁠and U.S. ⁠West Texas Intermediate was at $96.17 a barrel, up $1.77, or 1.88 per cent. Last week, Brent ​and WTI gained nearly 17 per cent and 13 per cent, respectively, the biggest weekly gains since ​the start of the war.

Hopes of reviving peace efforts receded during the weekend when U.S. President Donald Trump scrapped a planned trip ​to Islamabad by his envoys Steve Witkoff ⁠and Jared ‌Kushner, even as Iranian Foreign Minister Abbas Araqchi arrived ​In Pakistan.


“This ​move puts the ball squarely back in Iran’s ⁠court, and the clock is now ticking loudly,” IG ​market analyst Tony Sycamore said in a note, ​adding that Tehran may be forced to shut production at its aging oil fields when it runs out of storage capacity.

Tehran has largely closed the strait while Washington has imposed a blockade of Iran’s ports. Traffic through the Strait of Hormuz remained ‌limited, with just one oil products tanker entering the Gulf on Sunday, shipping data from Kpler showed.


Source link

27 04, 2026

The EURJPY repeats the negative closes– Forecast today – 27-4-2026

By |2026-04-27T11:52:02+03:00April 27, 2026|Forex News, News|0 Comments

No news for GBPJPY pair until this moment, confined between 214.80 support, while 215.70 level keeps forming a strong barrier against the bullish attempts, forcing it to provide sideways trading by its fluctuation near 215.60.


Note that stochastic approach 80 level might help it to provide extra positive momentum to surpass the current barrier, reinforcing the chances of reaching new bullish stations that might begin at 216.40 and 216.90, while the failure of the breach will increase the chances of forming bearish corrective waves, to press on the previously mentioned support and surpassing it will make the initial main target at 214.10 level in the bearish trading.


The expected trading range for today is between 214.80 and 215.70


Trend forecast: Sideways 


Source link

27 04, 2026

Gold Forecast: XAU/USD extends range play around $4,700, kicking off a Big week

By |2026-04-27T07:59:08+03:00April 27, 2026|Forex News, News|0 Comments


Gold finds fresh demand to retake the $4,700 level in Asia on Monday, as the US Dollar pauses its advance amid a recovery in risk sentiment and ahead of the key Federal Reserve (Fed) monetary policy decision due later this week.

Gold: Coming up for air pre-Fed?

Despite a stand-off between the United States (US) and Iran over the Strait of Hormuz and nuclear program, alongside pervasive inflation fears due to elevated Oil prices, markets are hopeful that the Iran war could end soon, promoting a modest risk recovery.

US President Donald Trumo said early Monday that the “Iran war will end soon, and we will be victorious.

“If Iran wants to talk, they can call us,” Trump added.

Following his remarks, Axios carried a story, citing a US official and two sources with knowledge of the matter, “Iran has given the US a new proposal to reopen the Strait of Hormuz and end the war that includes putting off nuclear negotiations,” per Bloomberg.

The positive shift in risk tone curbs the haven demand for the US Dollar (USD), dragging lower while lifting the bullion.

However, it remains to be seen if Gold sustains the latest leg up as traders could refrain from placing fresh bets on the bright metal ahead of key central bank policy meetings this week, including the Fed event risk on Wednesday.

In the meantime, profit-taking and fresh developments in the Middle East conflict could lead the way for Gold traders.

Gold price technical analysis: Daily chart

In the daily chart, XAU/USD trades at $4,721.88. The metal holds just above the 21-day simple moving average (SMA) at $4,719.11 and has pushed over a reclaimed descending trend line now tracking around $4,709.76, hinting at a mildly constructive tone despite still sitting beneath the 100-day SMA at $4,746.61 and the 50-day SMA near $4,864.12. The Relative Strength Index (RSI) at 47.34 is neutral, suggesting consolidation rather than a decisive trend, with price caught between nearby short-term support and the heavier overhead averages.

On the topside, initial resistance emerges at the 100-day SMA around $4,746.61, with a break there exposing the more important 50-day SMA near $4,864.12 as the next barrier to recovery. On the downside, immediate support is seen at the reclaimed descending trend line around $4,709.76 and the nearby 21-day SMA at $4,719.11; a loss of this shelf would put focus on the higher rising trend support around $4,589.67, ahead of the lower uptrend line at $4,383.70 and the 200-day SMA at $4,257.49, where the broader bullish structure would be challenged.

(The technical analysis of this story was written with the help of an AI tool.)


Source link

27 04, 2026

GBP/USD Forecast: Bulls eye 1.3600 as USD weakens on peace hopes

By |2026-04-27T07:51:01+03:00April 27, 2026|Forex News, News|0 Comments

The GBP/USD pair attracts some dip-buyers in the vicinity of the 1.3500 psychological mark and climbs to over a one-week top during the Asian session on Monday. Spot prices currently trade just below mid-1.3500s, up 0.10% for the day, and seem poised to appreciate further.

The US Dollar (USD) turns lower in reaction to the optimism led by reports that Iran gave the ‌US a new proposal on the reopening of the Strait of Hormuz and the ending of the war. Furthermore, sliding Oil prices ease inflationary concerns and temper hawkish US Federal Reserve (Fed) expectations, which exerts additional pressure on the USD and acts as a tailwind for the GBP/USD pair. Apart from this, bets for further policy tightening by the Bank of England (BoE) this year underpin the British Pound (GBP) and validate the positive outlook for the currency pair.

The recent corrective pullback from the 1.3600 neighborhood, or a two-month peak, stalled ahead of a confluence comprising the 200-day Simple Moving Average (SMA) and the 38.2% Fibonacci retracement level of the January-March downfall. The subsequent move up beyond the 50% retracement level reaffirms the constructive outlook. Moreover, the Relative Strength Index (RSI) is near 59 and the Moving Average Convergence Divergence (MACD) is in positive territory, hinting that buyers still retain control even as the advance begins to slow.

Initial resistance is seen at a structural standpoint near the 61.8% Fibo. retracement at 1.3608, which guards a deeper extension toward the recent swing highs. On the downside, the 50.0% retracement at 1.3523 is the first line of support, followed by the 38.2% level at 1.3437 and then the 23.6% retracement at 1.3332, with the 1.3161 area acting as a more distant structural floor if the broader pullback extends.

(The technical analysis of this story was written with the help of an AI tool.)

GBP/USD daily chart

US Dollar Price Today

The table below shows the percentage change of US Dollar (USD) against listed major currencies today. US Dollar was the strongest against the Swiss Franc.

USD EUR GBP JPY CAD AUD NZD CHF
USD -0.08% -0.10% -0.11% -0.05% -0.33% -0.19% -0.05%
EUR 0.08% -0.01% -0.04% 0.03% -0.22% -0.09% 0.03%
GBP 0.10% 0.00% -0.02% 0.04% -0.24% -0.12% 0.04%
JPY 0.11% 0.04% 0.02% 0.08% -0.22% -0.10% 0.10%
CAD 0.05% -0.03% -0.04% -0.08% -0.28% -0.16% 0.00%
AUD 0.33% 0.22% 0.24% 0.22% 0.28% 0.14% 0.28%
NZD 0.19% 0.09% 0.12% 0.10% 0.16% -0.14% 0.15%
CHF 0.05% -0.03% -0.04% -0.10% -0.00% -0.28% -0.15%

The heat map shows percentage changes of major currencies against each other. The base currency is picked from the left column, while the quote currency is picked from the top row. For example, if you pick the US Dollar from the left column and move along the horizontal line to the Japanese Yen, the percentage change displayed in the box will represent USD (base)/JPY (quote).

Source link

27 04, 2026

USD/JPY forecast: triangle forms ahead of FOMC, BoJ rate decisions — TradingView News

By |2026-04-27T03:49:59+03:00April 27, 2026|Forex News, News|0 Comments

The USDJPY exchange rate will be in the spotlight this week as the Federal Reserve and the Bank of Japan (BoJ) publish their interest rate decisions. It was trading slightly below the important resistance level at 160 as traders wait for these events and as the Iran crisis continued.

BoJ interest rate decision

The USD to Japanese yen will be in focus this week as the BoJ releases the latest interest rate decision. Economists expect the bank to leave interest rates unchanged at 0.75% as it observes the impact of the ongoing war to the economy.

A report released on Friday showed that Japan’s inflation continued rising in March as the war boosted energy prices. This rise will continue as there are signs that the blockade of the Strait of Hormuz will continue for a while.

The US has been open to talks with Iran, which the latter has resisted. Last week, the Iranians remained non-commital on talks even as President Donald Trump insisted that they would happen. At some point, he noted that JD Vance was on his way to Pakistan only for his motorcade to show up in the White House.

The same situation happened during the weekend. To save face, Trump shared that the team would not travel to Pakistan, citing the fact that Iranian leaders were divided. Iran has rejected these claims.

In addition to the headline decision, the BoJ will likely provide a guidance on what to expect in the upcoming meetings. For one, the IMF has called for the bank to hike interest rates, which analysts believe is possible. Officials will also highlight measures to boost the Japanese yen, which has crashed in the past few years.

Federal Reserve decision and key macro data

The next key catalyst for the USDJPY will be the upcoming Federal Reserve decision on Wednesday. Like the BoJ, analysts expect the bank to leave interest rates unchanged between 3.50% and 3.75% in this meeting.

The bank, which has been under pressure to cut rates from Trump, sees no need to do so as inflation remains high. The most recent data showed that the headline consumer inflation jumped to 3.3% and the OECD expects it will rise to 4.3% this year.

Worse, there are signs that the US is moving towards a stagflation, a period characterized by high inflation and slow economic growth. For example, an economic report expected this week will show that the economy expanded by less than two percent in the first quarter.

USDJPY technical analysis

USDJPY chart | Source: TradingView

The weekly chart shows that the USD to JPY pair has moved to the psychological level at 160. It has moved comfortably above the 50-week and 100-week moving averages, a sign that bulls are in control.

The pair has formed an ascending triangle pattern, which is made up of a horizontal support and a diagonal line. Therefore, the most likely scenario is where it rebounds, potentially to the key resistance level at 163.

Source link

26 04, 2026

Current price of oil as of April 24, 2026

By |2026-04-26T23:57:16+03:00April 26, 2026|Forex News, News|0 Comments


At 9 a.m. Eastern Time today, oil was priced at $106.01 per barrel with Brent serving as the benchmark (we’ll explain different benchmarks later in this article). That’s a gain of $2.34 compared with yesterday morning and around $39 higher than the price one year ago.

Oil price per barrel % Change
Price of oil yesterday $103.67 +2.25%
Price of oil 1 month ago $111.49 -4.91%
Price of oil 1 year ago $66.64 +59.07%
Price of oil yesterday
Oil price per barrel $103.67
% Change +2.25%
Price of oil 1 month ago
Oil price per barrel $111.49
% Change -4.91%
Price of oil 1 year ago
Oil price per barrel $66.64
% Change +59.07%

Will oil prices go up?

It’s impossible to forecast oil prices with detailed precision. Many different elements affect the market, but ultimately it boils down to supply and demand. When worries about economic recession, war, and other large-scale disruptions increase, oil’s path can shift fast.

How oil prices translate to gas pump prices

Gas prices at the pump don’t only track crude oil. They also include what it takes to refine and move that fuel, the taxes layered on top, and the extra markup your local station adds to stay in business.

Since crude oil generally makes up a majority of the per-gallon cost, changes in its price have an outsized impact. When oil surges, gas prices typically rise in tandem. But when oil retreats, gas prices often lag on the way down, a trend sometimes described as “rockets and feathers.”

The role of the U.S. Strategic Petroleum Reserve

In case of emergency, the U.S. has a store of crude oil known as the Strategic Petroleum Reserve. Its primary purpose is energy security in case of disaster (think sanctions, severe storm damage, even war). But it can also go a long way toward softening crippling price hikes during supply shocks.

It’s not a long-term answer and is more meant to provide temporary relief, assisting consumers and keeping critical parts of the economy running, like key industries, emergency services, public transportation, etc.

How oil and natural gas prices are linked

Both oil and natural gas are key sources of the energy we use every day. Because of this, a big change in oil prices can affect natural gas. For example, if oil prices increase, some industries may swap natural gas for some segments of their operations where possible, which increases demand for natural gas.

Historical performance of oil

To gauge oil’s performance, we often turn to two benchmarks:

  • Brent crude oil, the main global oil benchmark.
  • West Texas Intermediate (WTI), the main benchmark of North America

Between these two, Brent better represents global oil performance because it prices much of the world’s traded crude. And, it’s often the best way to track historical oil performance. In fact, even the U.S. Energy Information Administration now uses Brent as its primary reference in its Annual Energy Outlook.

Looking at the Brent benchmark across several decades, oil has been anything but steady. It’s seen spikes due to factors such as wars and supply cuts, and it’s also seen crashes from global recessions and an oversupply (called a “glut”). For example:

  • The early 1970s brought the first big oil shock when the Middle East cut exports and imposed an embargo on the U.S. and others during the Yom Kippur War.
  • Prices dropped in the mid-1980s for reasons such as lower demand and more non-OPEC oil producers entering the industry.
  • Prices spiked again in 2008 with increased global demand, but it soon plummeted alongside the global financial crisis.
  • During the 2020 COVID lockdown, oil demand collapsed like never before—bringing prices below $20 per barrel.

All to say, oil’s historical performance has been anything but smooth. Again, it’s hugely affected by wars, recessions, OPEC whims, evolving energy initiatives and policies, and much more.

Energy coverage from Fortune

Looking to stay up-to-date regarding the latest energy developments? Check out our recent coverage:

Frequently asked questions

How is the current price of oil per barrel actually determined?

The current price of oil per barrel depends largely on supply and demand, including news about potential future supply and demand (geopolitics, decisions made by OPEC+, etc.). In the U.S., prices also move based on how friendly an administration is to drilling, as it can affect future supply. For example, 2025 saw the Trump administration move to reopen more than 1.5 million acres in the Coastal Plain of the Arctic National Wildlife Refuge for oil and gas leasing, reversing the Biden administration’s policy of limiting oil drilling in the Arctic.

How often does the price of oil change during the day?

The price of oil updates constantly when the “futures” markets are open. A futures market is effectively an auction where people agree to buy or sell oil in the future. As long as people and companies are trading contracts, the oil price is changing.

How does U.S. shale oil production affect the current price of oil?

In short, shale is rock that contains oil and natural gas. Think of shale as energy yet to be tapped. The more shale the U.S. accesses, the more energy we’ll have—and the more easily oil prices can keep from spiking as much thanks to a greater supply.

How does the current price of oil impact inflation and the broader economy?

When oil is expensive, it tends to make everyday items cost more. This can be related to energy (your heating, gas utilities, etc.), but it’s also due to the logistics involved with making those items accessible to you. Shipping, for example, can affect the price of things at the grocery store, as it’s more expensive to get those products from warehouses and farms onto the shelf.


Source link

26 04, 2026

Euro Weekly Forecast into ECB: EUR/USD, EUR/JPY

By |2026-04-26T23:49:06+03:00April 26, 2026|Forex News, News|0 Comments

The backdrop in EUR/USD is likely to be determined at least partially by the time frame with which the trader or analyst is looking. From a fundamental basis, there’s been periods where the backdrop has appeared to be divorced from the price action such as the sliding sell-off in March even as the European Central Bank was widely considered to be on the way to rate hikes. But, realistically, it was the confusion around oil prices and the implications around that which was likely driving the waves, and as we go into next week, in which we’ll get both European CPI data and a European Central Bank rate decision, EUR/USD can be justified in either direction depending on the vantage point that it’s being looked at.

From the weekly chart, we have price re-testing a massive area of importance, the same 76.4-78.6% expanse from the 2021-2022 major move, a zone that’s been in-play for more than nine months now as the massive rally of 2025 met it’s match at that zone.

From the below chart, it looks like a stall at a lower-high following a lower-low, thereby keeping the door open for sellers to make a push until or unless resistance can be tested through.

EUR/USD Weekly Price Chart

Chart prepared by James Stanley; data derived from Tradingview

Whitepaper

EUR/USD Daily

From the daily, and this is what I had looked at in the USD article on Friday, this is simpler to justify on the long side given the recent higher-high and the pullback that, so far, has held support around the 76.4% retracement of the move looked at above. There’s even scope for deeper support, to around 1.1628-1.1655, which can keep the door open for bullish continuation scenarios.

Key resistance at this point is the same 1.1835 level that held the highs right around when the USD was probing for support around the 97.94 Fibonacci level.

EUR/USD Daily Price Chartimage-20260424164742-7

Chart prepared by James Stanley; data derived from Tradingview

EUR/USD Intra-Day

From the four-hour chart, we can see that the bounce is still young and it’s the 1.1748-1.1766 zone that stands out as an area that bulls can stake their claim. Buyers would need to press above that to make a more convincing move, which would then open the door for a re-test of resistance at 1.1835, and perhaps more beyond that level.

For next week, I’m considering EUR/USD as one of the more attractive backdrops for USD-weakness and the daily chart above is a big reason why.

EUR/USD Four-Hour Price Chartimage-20260424164746-8

Chart prepared by James Stanley; data derived from Tradingview

EUR/JPY

Next week is big for the Yen with the Bank of Japan rate meeting earlier in the week, and as we came into last week, the EUR/JPY pair was in the midst of a massive breakout.

For the past two weeks, however, that stunning strength has turned into indecision following the bull pennant breakout.

EUR/JPY Weekly Chartimage-20260424164749-9

Chart prepared by James Stanley; data derived from Tradingview

EUR/JPY Daily

As I looked at in the US Dollar article earlier, I think the USD/JPY pair is the main push point for FX markets next week with the Bank of Japan rate decision and the prospect of rate hikes from the BoJ in the coming months. If Ueda sounds hawkish and frightens carry traders, we can see fast unwind. If he’s too soft and doesn’t seem ready to hike, we could see the 160.00 level tested which could spur a round of Yen-weakness elsewhere.

Looking at EUR/JPY in a vacuum, and it looks like there could be a deeper pullback as horizontal support and lower-highs makes for a short-term descending triangle formation. That wouldn’t necessarily have to turn into a full-fledged reversal, as it may simply be a pullback in the broader bullish trend that opens the door for re-test of the 185.00 level.

EUR/JPY Daily Price Chartimage-20260424164753-10

Chart prepared by James Stanley; data derived from Tradingview

— written by James Stanley, Senior Market Analyst, Global Macro

Source link

26 04, 2026

Weekly Forex Forecast 26th April to 1st May 2026 (Charts)

By |2026-04-26T19:48:02+03:00April 26, 2026|Forex News, News|0 Comments

Fundamental Analysis & Market Sentiment

I wrote on 19th April that the best trades for the week would be:

  1. Long of the USD/JPY currency pair following a daily (New York) close above ¥160. This did not set up.

  2. Long of Brent Crude Futures if we get a daily close above $112.50. This also did not set up.

Neither of these trades set up.

A summary of last week’s most important data in the market:

  1. US Retail Sales – the month-on-month increase was higher than expected, at 1.7% not 1.4%. This suggests a more buoyant US economy which would tend to be a hawkish pull on the Fed, boosting the USD.

  2. UK CPI (inflation) – an annualized rate of 3.3% as expected.

  3. Canada CPI (inflation) – lower than expected, with a month-on-month increase of only 0.9% when 1.1% was widely forecasted. This is a dovish tilt for the Bank of Canada, which would tend to weaken the CAD.

  4. New Zealand CPI (inflation) – slightly higher than expected, with a month-on-month increase of 0.9% while 0.8% was forecasted. This is perhaps a marginally hawkish tilt for the RBNX.

  5. Germany & UK Flash Services & Manufacturing PMI

  6. UK Retail Sales – UK was above expectations; Germany was below expectations.

  7. UK Claimant Count Change (Unemployment Claims) – marginally worse than expected.

For yet another week, last week’s economic data releases were much less influential upon the markets than the ongoing US/Iran negotiations. Optimism that the war will come to a full end soon with some kind of deal and an open Strait of Hormuz continued to increase, and this sent stock markets rising modestly, especially in the USA. The S&P 500 Index has risen by over 13% within just the past three weeks after reaching a new 7-month low. It closed Friday at a new record high! This is a huge turnaround, and April is on track to being the best month for the S&P 500 Index in 52 years.

However, after markets closed Friday, the mood will have soured considerably, after the Iranian ambassador left prepared talks in Islamabad and the USA never sent a delegation. Towards the end of Saturday, President Trump said he wasn’t going to waste time trying to set up a meeting, and that if the Iranians wanted to talk, they should call him, because he “held all the cards”. Trump claimed the Iranians’ proposed deal was poor, but was then followed by a much better offer, which was still unacceptable to him. Prediction markets open over the weekend reacted by showing a much lower chance of a peace deal before the end of June.

Trump will continue the blockade, which is estimated to be costing Iran about $400 – $500 million per day. It may be that the USA will launch fresh attacks – US military tankers have been observed building up at Israeli airports, just as was so before the initial hostilities erupted at the end of February.

Unless there is a surprise agreement within the next few hours, it is likely that markets will open fearing the reignition of the war and showing stronger risk-off sentiment, which will likely send equities lower, and crude oil / gasoline and the US Dollar higher. Another element that could make things even worse in the market is what appears to have been an assassination attempt against President Trump at the White House Correspondents Dinner.

Another issue that is increasingly being talked about is the delayed impact of the closure of the Strait of Hormuz and the resulting forced shutdown of many of Iran’s oil wells. Some analysts see demand for crude oil lowering on the higher prices which are forcing a decrease in consumption, with businesses scaling back.

The Week Ahead: 27th April – 1st May

The outcome of negotiations and the ceasefire concerning the Middle East war is likely to remain very influential on the market over the coming week, but there are several scheduled items, including major central bank policy meetings, which could have a big impact.

The coming week’s most important data points, in order of likely importance, are:

  1. US Federal Funds Rate and FOMC Statement

  2. US Core PCE Price Index

  3. US Advance GDP

  4. US Employment Cost Index

  5. Bank of Japan Policy Rate, Monetary Policy Report, and Outlook Report.

  6. European Central Bank Main Refinancing Rate and Monetary Policy Statement Australia CPI (inflation)

  7. Bank of England Official Bank Rate & Votes, Monetary Policy Summary & Report

  8. Bank of Canada Overnight Rate, Policy Report, and Rate Statement

  9. Australia CPI (inflation)

  10. Canadian GDP

Monday is a public holiday in Australia.

Wednesday is a public holiday in Japan.

Friday is a public holiday in China, Switzerland, France, Germany, and Italy.

Monthly Forecast April 2026

Currency Price Changes and Interest Rates

For the month of April, I forecasted that the USD/JPY currency pair would rise in value. The performance of the forecast so far:

Currency Pair

Forecasted Direction

Interest Rate Differential

Performance to Date

USD/JPY

Long ↑

+3.00% (3.75% – 0.75%)

+0.37%

Weekly Forecast 27th April 2026

Last week, I made no weekly forecasts as there were no unusual movements in the Forex market last week.

Volatility last week was relatively low, with only 3% of currency pairs moving by more than 1% in value. Next week’s volatility is likely to increase substantially, with several major central bank policy meetings (including the Federal Reserve) scheduled, and some important GDP and inflation data too.

You can trade these forecasts in a real or demo Forex brokerage account.

Technical Analysis

Key Support/Resistance Levels for Popular Pairs

Weekly Forex Forecast 26th April to 1st May 2026 (Charts)

Key Support and Resistance Levels

US Dollar Index

The US Dollar printed an indecisive inside bar which was also a doji candlestick. It had a small range. We have a mixed long-term trend, with the 3-month trend bullish and the 6-month trend bearish.

The greenback is clearly within a long-term consolidation phase, so we cannot really expect much of a trend in the US Dollar here.

I think the greenback will be more driven by the progress in the current Middle East ceasefire talks – if war breaks out again, it will likely boost the Dollar, not so much as a haven but more as an effect of the inflationary shock of the rising energy prices. If we start to see progress on a real long-term deal, conversely, it will probably be bearish for the US Dollar. Markets were optimistic about a deal last week, but the events of this weekend and the seeming absence of talks will, as things stand, generate a more risk-off market environment as the new week gets underway.

Weekly Forex Forecast 26th April to 1st May 2026 (Charts)

US Dollar Index Weekly Price Chart

USD/JPY

The USD/JPY currency pair gained a little ground last week, four weeks after finally making the long-anticipated bullish breakout beyond the big round number at ¥160. However, the price is showing no inclination to go anywhere yet. The problem is not Yen weakness, which can be taken for granted over the long-term it seems. The problem for progress higher by this currency pair is the weakness in the US Dollar now that there is a ceasefire seen as leading to a peace deal in the Middle East war, because if there is a longer-term agreement it will remove some inflationary pressure from the Fed through lower energy prices. Even if the Dollar does strengthen on risk-off sentiment, the Yen might firm up too for the same reason.

Trend traders will be worrying about the slight bearish bias we are seeing near the highs and the price’s unwillingness to break out, especially above the ¥160 level. The Bank of Japan might get nervous and work for an intervention to strengthen the Yen above that level, adding a potential extra hurdle for bulls.

Bulls might however be encouraged by the solid support at the lows below ¥158.50. There is also a very solid trend line which has been supporting the price action for a year.

I remain long here, but more cautious traders might want to wait for a daily (New York) close above ¥160 before entering a new long trade.

Weekly Forex Forecast 26th April to 1st May 2026 (Charts)

USD/JPY Weekly Price Chart

S&P 500 Index

The S&P 500 Index has been on a wild ride over the past few weeks, rising by more than 13% in value within that time. If this holds up, it will be the biggest calendar month gain by the Index since 1987, or possibly even 1974. This is quite an extraordinary turnaround after the price fell by about 10% to spend several days trading below the 200-day simple moving average and reaching new 7-month low prices. This is extraordinarily high volatility and an unusual event.

Although last week’s gain was not so large, the price ended the week right on the high of its range in blue sky, which is a bullish sign as it makes a new record high.

Stock markets are soaring through the same driver that was sending them plummeting just a few weeks ago – the war between the USA and Iran. The ceasefire and negotiations have generated an increasingly strong expectation that the war will end soon with a comprehensive peace deal. This sent markets higher, but there is a strong chance of this Index gapping down when markets open Monday due to the more pessimistic developments concerning the prospect of a USA/Iran deal.

I think it will be wise to wait on the sidelines and see what the market does on Monday. If we get a daily close at the end of Monday that is higher than Friday’s closing price, a new long trade entry will look extremely tempting.

Weekly Forex Forecast 26th April to 1st May 2026 (Charts)

S&P 500 Index Weekly Price Chart

NASDAQ 100 Index

Everything I wrote above about the S&P 500 Index applies equally to the NASDAQ 100 Index, with the small adjustment that the bullish breakout to new record highs here looks even stronger. As the NASDAQ 100 averages a higher return than the S&P 500 Index, so if you want to be long there, you should seriously consider being long here too.

Weekly Forex Forecast 26th April to 1st May 2026 (Charts)

NASDAQ 100 Index Weekly Price Chart

Brent Crude Oil Futures

Brent Crude Oil rose slightly last week, with the continued closure of the Strait of Hormuz by Iran driving the price a little higher.

This continuation of the closure situation might push the price up a bit, but it is unlikely to send prices to new highs. I am not sure that the price will fall a great deal further even if there is a peace deal, it may take a while to do that, but it should continue to trade lower in that scenario.

The surprise to consider is, what if renewed kinetic war breaks out now talks have failed twice and Iran has said it no longer considers itself bound by the ceasefire. If this happened, it would certainly send the price of oil racing higher, we might even see the price rise by $20 in a single day.

I think that unless you have a strong view on whether a resumption of the war is likely, there is no point trading crude oil right now, but on a surprise resumption of the war, a long trade could be a good idea.

I will go long here if we get a daily (New York) close above $112.50 per barrel.

If you do go long, Brent will likely be the better vehicle than WTI, as it is more exposed to events in the Strait of Hormuz.

Weekly Forex Forecast 26th April to 1st May 2026 (Charts)

Brent Crude Oil Futures Weekly Price Chart

Gasoline Futures

RBOB Gasoline Futures rose strongly last week, with the continued closure of the Strait of Hormuz by Iran driving the price higher.

This continuation of the closure situation might push the price up a bit, but it is unlikely to send prices to new highs. We will likely see the price continue to trade higher as the new week opens as face-to-face peace talks fail again and President Trump apparently rejects two Iranian offers. Unless there is a dramatically different development, this looks like a buy right away. If kinetic war breaks out, which is possible if unlikely, the price will probably rise even more strongly.

I am not sure that the price will fall a great deal further even if there is a peace deal, it may take a while to do that, but it should trade lower in that scenario.

Gasoline is leading and rising ahead of crude oil, making it a more attractive buy right now. The only thing bulls should be watching out for are high volatility, and the fact that the price is just under the absolute recent high but has not quite broken above it.

Gasoline futures are too large for most retail traders, so using a CFD or an ETF like UGA could be a more accessible way to get exposure.

Weekly Forex Forecast 26th April to 1st May 2026 (Charts)

Gasoline Futures Weekly Price Chart

Bottom Line

I see the best trades this week as:

  1. Long of the USD/JPY currency pair following a daily (New York) close above ¥160.

  2. Long of Brent Crude Futures if we get a daily close above $112.50. This is extremely unlikely to set up unless there is a surprise resumption of the war.

  3. Long of the S&P 500 Index following a daily close above 7,165.

  4. Long of the NASDAQ 500 Index following a daily close above 27,303.

Source link

Go to Top