The main category of All News Articles.
You can use the search box below to find what you need.
[wd_asp id=1]
The main category of All News Articles.
You can use the search box below to find what you need.
[wd_asp id=1]
Overall Trend: Strongly Bearish.
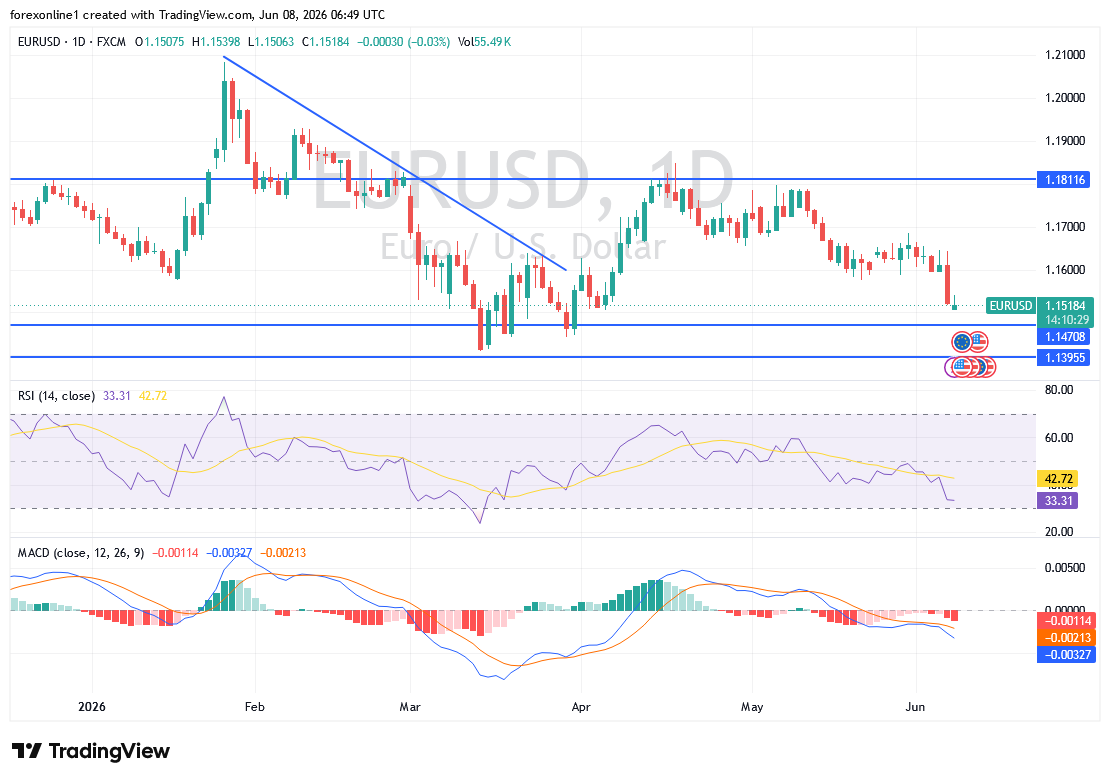
Support Levels for EUR/USD Today: 1.1500 – 1.1460 – 1.1380
Resistance Levels for EUR/USD Today: 1.1630 – 1.1700 – 1.1780
Buy scenario: From the support level of 1.1445 with a target of 1.1600 and a stop-loss at 1.1400
Sell scenario: From the resistance level of 1.1630 with a target of 1.1480 and a stop-loss at 1.1700
The Eurozone economy continues to suffer under the weight of high energy costs and weakening demand. With crucial European Central Bank (ECB) monetary policy decisions approaching, markets are increasingly focused on whether the bank will be willing to tolerate slowing growth to combat inflation.

Ahead of the decision, the EUR/USD exchange rate is consolidating bearishly near the 1.1500 psychological support barrier—its lowest level in over two months. Selling pressure on the currency pair intensified following the release of US employment figures at the end of the last trading week, which beat market expectations.
Overall, this data confirms the trend for 2026 towards a steady strengthening of US economic indicators, exceeding the significant economic slowdown predicted by many economists at the beginning of the year.
Consequently, the market has understandably shifted from anticipating Federal Reserve rate cuts to pricing in hikes instead. At the very least, the Federal Reserve will have to abandon its easing bias at the June FOMC meeting. For the US Dollar, this is a fundamentally supportive development that could fuel further gains in the coming weeks.
Regarding the future of European monetary policy, concerns are growing about the growth prospects in the Eurozone, where high energy prices continue to have a significant impact, with increased focus on interest rate decisions by central banks. At this stage, the European Central Bank is expected to raise interest rates this month.
Based on the EUR/USD pair’s performance on the daily timeframe, the bearish bias is stronger, and breaking the psychological support level of 1.1500 is likely, as the factors supporting the US dollar remain in place. Technically, the 14-day Relative Strength Index (RSI) is around 33, nearing the oversold level of 30, and the 100-period Simple Moving Average (SMA) is below the 200-period SMA. The MACD indicator continues to move in negative territory, with the gap between the indicator and signal lines widening, reflecting continued selling momentum.
Conversely, the bullish scenario requires the EUR/USD price to bounce back and break the resistance levels of 1.1630 and 1.1700, respectively.
Data from top trading platforms shows that the currency pair does not await any high-impact economic releases today from either the Eurozone or the United States. Therefore, investor sentiment will continue to be driven by the recent US jobs report and the trajectory of global geopolitical tensions—especially out of the Eurozone—which maintain a powerful and direct impact on exchange rates.
Trend-following traders generally prefer to wait for corrective bounces to capture fresh shorting opportunities. Maintaining strict capital management and using appropriate stop-loss orders is highly recommended, especially with market volatility expected to intensify in the coming days.
Ready to trade our daily Forex analysis? We’ve made a list of the best online forex trading platform worth trading with.
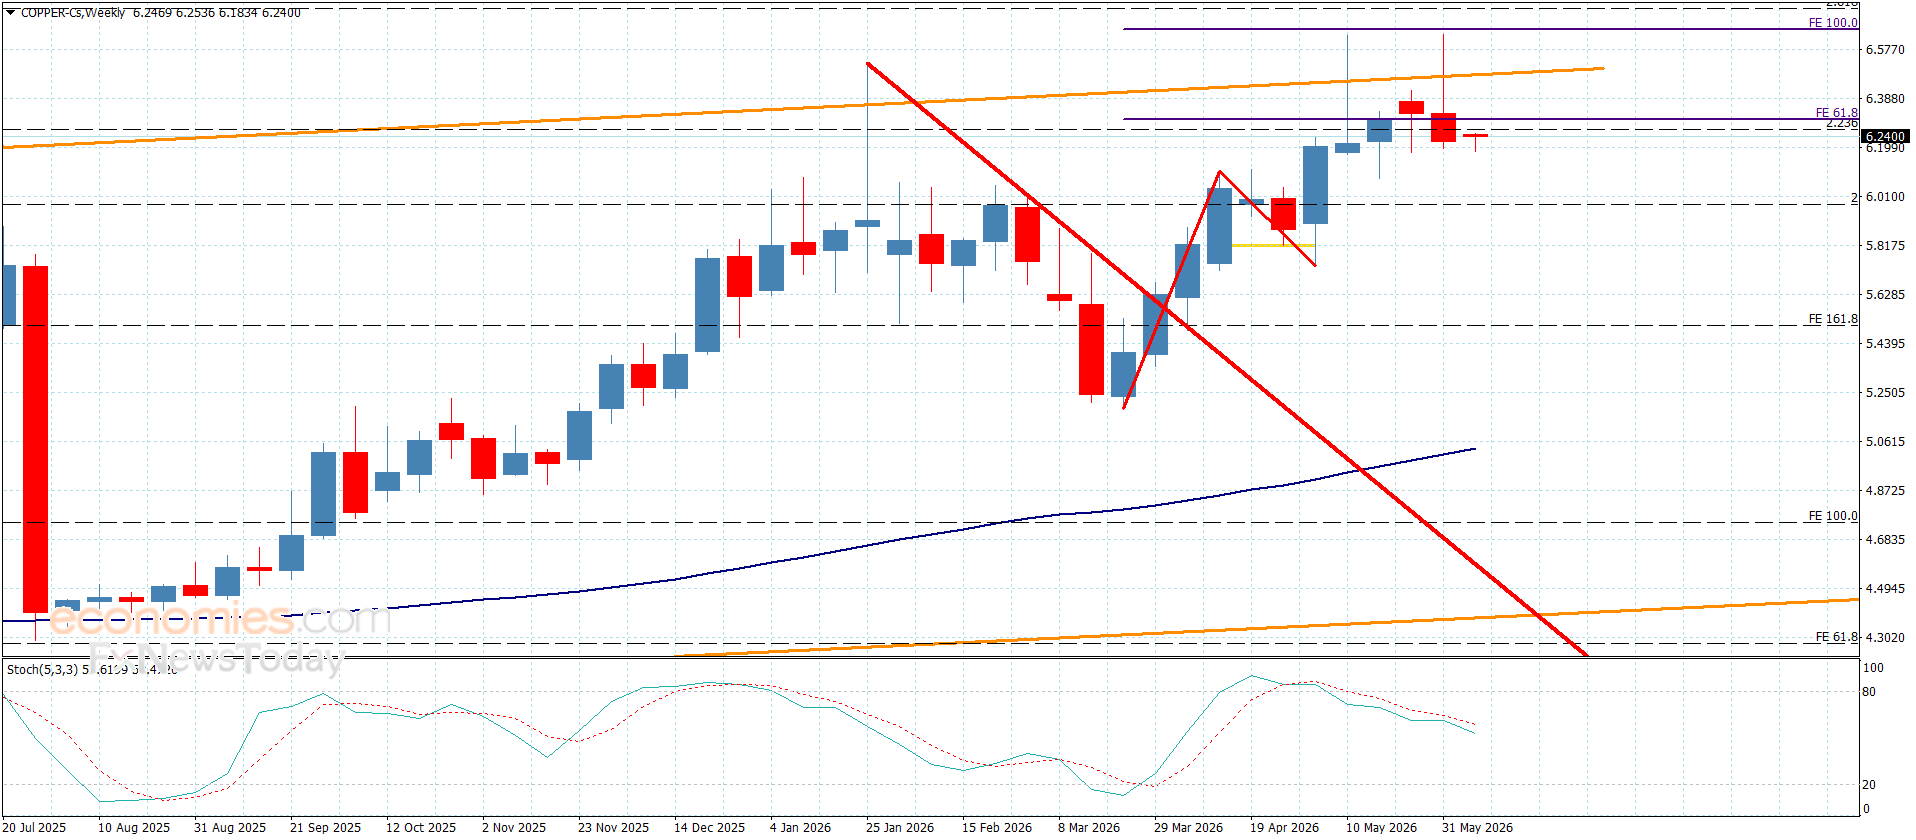
Copper price provided bearish corrective waves, affected by the stability below $6.6600 barrier, beside providing negative momentum by stochastic, approaching the extra support at $6.1000.
The continuation of the negative pressure might force it to break the current support, to confirm its readiness to target new corrective stations by reaching $5.9600 and$5.8200, while activating the bullish trend requires providing positive close above at $6.4800 level.
The expected trading range for today is between $6.000 and $6.3600
Trend forecast: Bearish
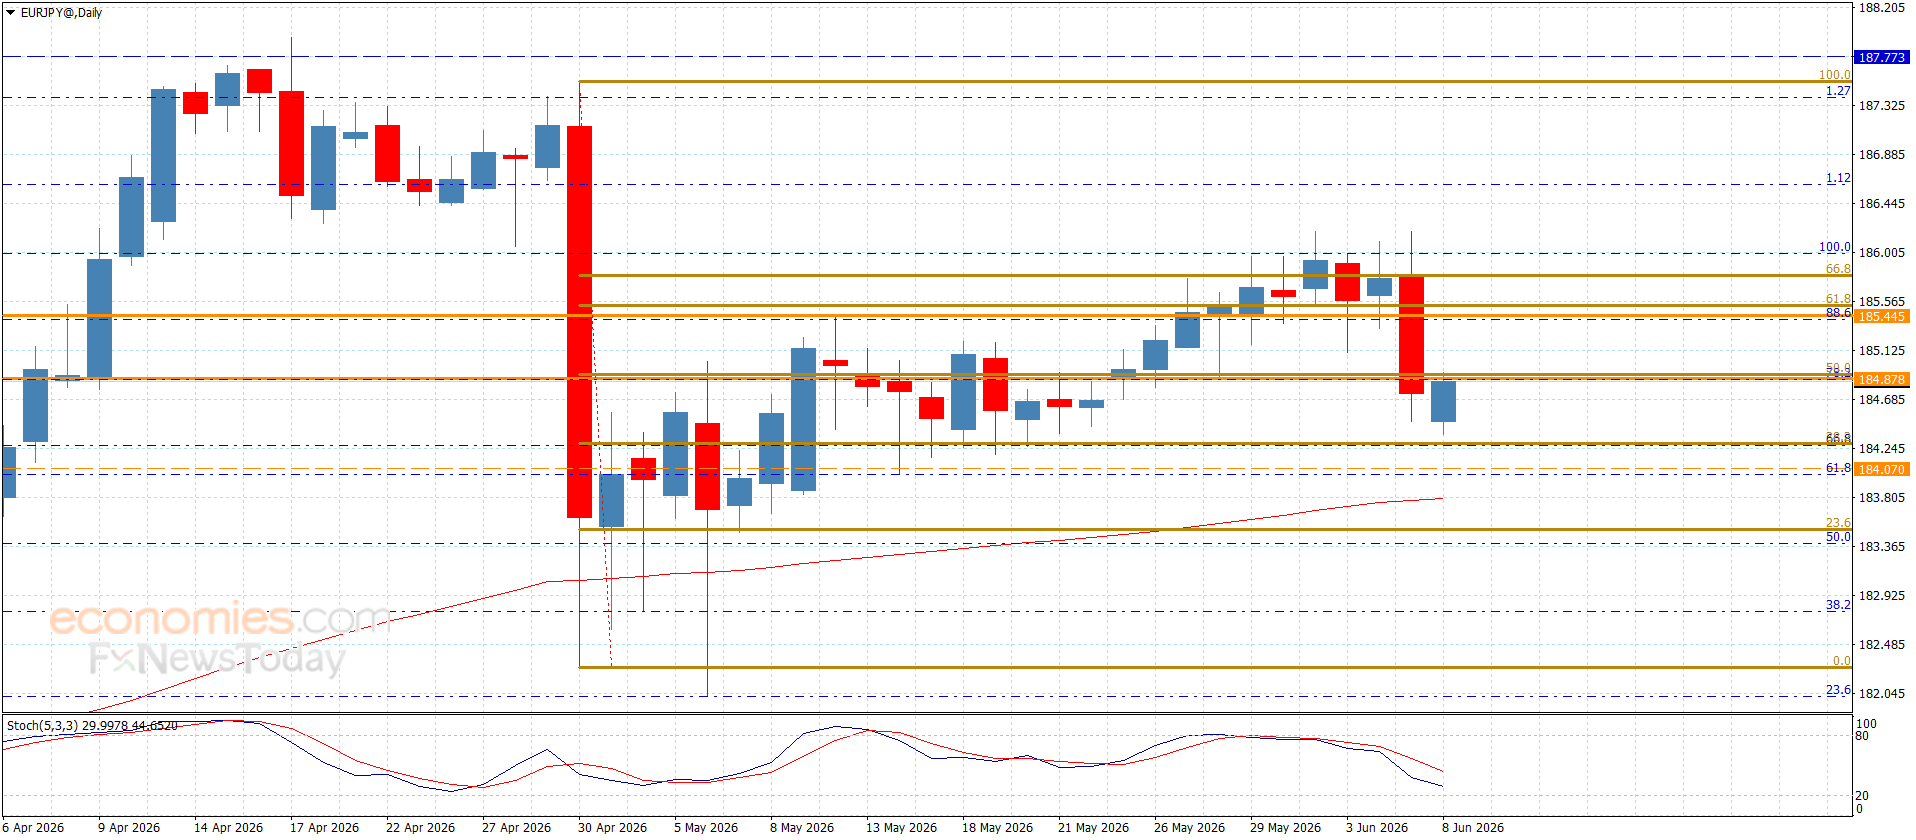
The EURJPY pair didn’t manage to settle at 186.00, forcing it to activate the negative trend again, affected by stochastic reach below 50 level, suffering several losses by reaching 184.38.
Today’s forecast depends on the attempt of forming a new support at 184.25 level, and its stability makes us expect renewing the positive attempts to reach 184.45, then repeat the pressure on the previously mentioned barrier, while breaking the current support and holding below it will confirm the readiness of targeting new bearish stations, to expect reaching 183.75 and 183.50.
The expected trading range for today is between 184.25 and 185.45
Trend forecast: Bullish
Quick Answer (Featured Snippet): XAUUSD is the ticker for gold priced in U.S. dollars — the spot exchange rate for one troy ounce of gold. As of early June 2026, XAUUSD trades around $4,292, down about 0.85% on the day and roughly 9% over the past month, yet still up nearly 30% year-over-year. It remains the world’s most-watched safe-haven benchmark.
When traders type XAUUSD into a chart, they are asking one simple question: how many U.S. dollars does it take to buy one ounce of gold right now? “XAU” is the ISO code for a troy ounce of gold; “USD” is the U.S. dollar. Put them together and you get gold spot priced in dollars — the single most important reference rate in the precious-metals market.
XAUUSD trades nearly around the clock across global sessions, which makes it a favorite for macro traders, hedgers, and anyone looking to read the market’s risk appetite. When fear rises, money tends to flow into gold and XAUUSD climbs. When the dollar strengthens or rates rise, gold often softens.
Want exposure to gold’s moves without buying physical bullion? Phemex lets you trade gold-linked markets alongside crypto in one account, so you can position on XAUUSD volatility 24/7.
Explore gold and macro markets on Phemex →
Gold has just gone through a notable cooling-off after a historic run. Here is the current snapshot:
The story those numbers tell is important. Gold remains in a powerful long-term uptrend — up almost 127% over five years — but the short-term tape has turned sharply lower, with the metal shedding nearly 17% over three months. Weekly momentum is now sitting at its weakest level in over two years, which means XAUUSD is at a genuine technical crossroads rather than a quiet drift.
Gold never moves in a vacuum. Several macro forces are tugging at XAUUSD right now:
1. The Federal Reserve & interest rates. This is the dominant driver. After a hotter labor-market print, rate-cut bets were ripped up — futures markets are now pricing a roughly 73% probability of at least one more 25bp hike before year-end. Higher rates raise the opportunity cost of holding non-yielding gold, and that repricing is a big reason XAUUSD has slid from its highs.
2. The U.S. dollar (DXY). Gold is priced in dollars, so the two are mechanically linked. With the Dollar Index hovering near 100, any sustained DXY breakout above the 102–104 zone would make gold more expensive for overseas buyers and historically pressures XAUUSD lower.
3. Geopolitics & safe-haven demand. Ongoing Middle East tension and broader uncertainty keep a floor under gold. Every flare-up tends to trigger a quick safe-haven bid, which is why dips have so far been bought rather than abandoned.
Macro headlines move fast — your access should too. On Phemex you can react to Fed decisions, CPI prints, and geopolitical shocks in real time across gold, crypto, and index markets.
For active traders, the chart is telling a clear range story:
As long as XAUUSD holds above its yearly-open support, the long-term bull structure stays intact and the current move reads as a healthy correction. Lose that level on a weekly close, and the conversation shifts to a deeper retracement. This is exactly the kind of two-sided setup where defined entries and pre-planned exits matter more than directional conviction.
The bull case. Major institutions remain constructive on gold for 2026, with year-end targets clustered anywhere from $5,243 to $6,300 per ounce. The thesis: central-bank buying, persistent geopolitical risk, and eventual rate relief reignite the safe-haven trade. Near-term, some models see gold trading in a $4,186–$4,933 band through June, with a potential drift back toward $4,516.
The bear case. More cautious analysts expect further downside toward $4,370 and possibly $3,816 by year-end if the Fed stays hawkish and the dollar firms. Sticky inflation that forces additional hikes is the single biggest threat to the gold bull.
The realistic takeaway: 2026 is shaping up as a high-volatility, range-bound battle between a strong structural bull case and a hawkish-Fed headwind. That environment rewards traders, not passive holders. (NFA — see disclaimer below.)
No XAUUSD discussion is complete without the “digital gold” comparison. Both gold and Bitcoin are increasingly treated as hedges against currency debasement and macro uncertainty — but they behave differently. Gold offers stability and millennia of trust; Bitcoin offers asymmetric upside and 24/7 liquidity. Many traders now run both as complementary hedges rather than choosing one.
That is where a single venue becomes powerful. Instead of splitting your gold view and your crypto view across separate platforms, you can manage both sides of the safe-haven trade in one place.
Trade digital and traditional safe havens side by side. Phemex gives you access to crypto, gold-linked, and macro markets with deep liquidity and transparent fees.
1. What does XAUUSD mean? XAUUSD is the price of one troy ounce of gold (XAU) quoted in U.S. dollars (USD). It is the global benchmark for gold spot pricing and updates continuously across trading sessions.
2. Why is XAUUSD falling in 2026? Mainly the Fed. Markets are now pricing a ~73% chance of another rate hike, which raises the cost of holding non-yielding gold. A firm dollar and aggressive repricing of rate expectations have pulled XAUUSD down nearly 9% over the past month, even though it is still up ~30% year-over-year.
3. What is the XAUUSD forecast for 2026? Forecasts diverge widely. Bullish institutions target $5,243–$6,300 by year-end, while bearish analysts see $3,816–$4,370. Near-term, models point to a $4,186–$4,933 range. Treat all forecasts as scenarios, not guarantees.
4. How can I trade gold-linked markets on Phemex? Phemex lets you trade gold-linked and macro markets alongside crypto in a single account, with 24/7 access, deep liquidity, and transparent fees — no physical bullion or traditional brokerage required.
Gold is at a defining technical level, caught between a hawkish Fed and a structural long-term bull case. Whether you expect XAUUSD to defend yearly support or roll over toward $3,800, Phemex gives you a fast, two-sided way to trade the move — and to pair it with Bitcoin as the digital half of your safe-haven strategy. Start trading on Phemex today →
The EURJPY pair began this morning with new positive trading, attempting to settle above 186.00, to increase the efficiency of the previously suggested trend, while gathering extra positive momentum makes us expect its rally towards 186.65 level, attempting to resume the bullish trend, reaching the next main target near 187.35.
The failure of confirming the breach will increase the chances of forming temporary corrective waves, to attempt to reach 185.40, to test the main support at 184.80 before any attempt to record the previously suggested targets.
The expected trading range for today is between 185.50 and 186.60
Trend forecast: Bullish
Platinum price updates for Kakinada show the current rates as ₹0 (10g),
₹0 (100g), and ₹0 (1kg). Over June, prices changed
frequently. The 100g rate peaked at ₹5,95,300 and dropped to
₹0. For 1kg, it fluctuated between
₹0 and ₹59,53,000.
The cost of platinum is influenced by mining output, global market demand, and
geopolitical stability. Industrial reliance—mainly in cars and electronics—drives
additional volatility. Shifts in currency, especially the US dollar, as well as
macroeconomic indicators like inflation and interest rate policies, strongly shape its
pricing.
I wrote on 31st May that the best trades for the week would be:
Long of the S&P 500 Index. This produced a loss of 2.62%.
Long of the NASDAQ 100 Index. This produced a loss of 5.24%.
The overall loss of 7.86% last week averaged a per asset loss of 3.93%.
A summary of last week’s most important data in the market:
US Average Hourly Earnings – monthly increase of 0.3%, as expected.
US Non-Farm Employment Change – much stronger than expected, with 192k net new job while only 75k were forecast. This put some hawkish pressure on the Fed, sending the greenback higher.
US ISM Services PMI – slightly better than expected, giving some mild hawkish pressure on the Fed.
US ISM Manufacturing PMI – slightly better than expected, giving some mild hawkish pressure on the Fed.
Australian GDP – this came in lower than expected, quarterly growth was forecasted to be 0.5% but it was actually 0.3%. This put some dovish pressure on the Aussie and helped it lose value over the week.
US Unemployment Rate – this was as expected.
Canadian Unemployment Rate – this was notably lower than expected, falling from 6.9% to 6.6%. This is a minor dovish tilt, and it helped the Loonie lose a few pips later during Friday’s trading.
The major event of last week was driven by the previously mentioned data, for a change. Stock markets, notably in the USA and Japan, powered to new record highs driven upwards by optimism over the AI sector. However, when Friday’s US jobs and average earnings data were published, it could be seen that the US economy is far hotter than was expected, leading to more pressure on the Fed to hike interest rates. Paradoxically, the “good news” on the economy was bad news for the stock market, triggering a selloff in the major US tech index of almost 5%.
This will put a big focus on the US CPI (inflation) data due next week, to either confirm this more hawkish outlook on the greenback, or otherwise. However, despite this strong fall in technology stocks, sentiment on AI remains fundamentally bullish, so I think this is likely to be a retracement and not a trend change away from the dominant bull market.
Another major issue is that fact that despite President Trump constantly talking up the imminent prospect of a peace deal with Iran, for more than two months now he has been chasing this deal which somehow never quite arrives. There are increasing military clashes between the USA and Iran near the Strait of Hormuz, not to mention Iran firing ballistic missiles at Kuwait, and Trump is starting to indicate a tighter deadline for an Iranian response. However, Trump has ineptly made it obvious to everyone that he is desperate for a deal and scared to return to a war the American people do not really believe must be won. I expect Iran will continue stringing Trump along and this uncertainty will come to have a worsening effect upon stock markets. Should Trump finally order a return to kinetic war, that will send stocks sharply lower too, and the price of Crude Oil soaring.
The coming week’s most important data points, in order of likely importance, are:
US CPI (inflation)
European Central Bank Policy Meeting (including Main Refinancing Rate), markets expect a rate hike of 0.25%.
Bank of Canada Policy Meeting (including Overnight Rate)
US PPI
UK GDP
Monday is a public holiday in Australia.
Currency Price Changes and Interest Rates
For the month of June, as there was still no clear trend in the US Dollar, I made no monthly forecast.
Last week, I forecasted that the NZD/JPY currency cross was likely to fall in value. This was a great call, as it declined over the week by 2.58%.
This week, I forecast directional movement in three currency crosses which has unusually large price movements over the past week:
Long NZD/JPY
Short EUR/NZD
Short GBP/NZD
Volatility increased again last week, with 56% of currency pairs moving by more than 1% in value. Next week’s volatility is likely to remain high as there are a few extremely high impact data items due, and it is also possible there could be a dramatic development between the USA and Iran.
You can trade these forecasts in a real or demo Forex brokerage account.
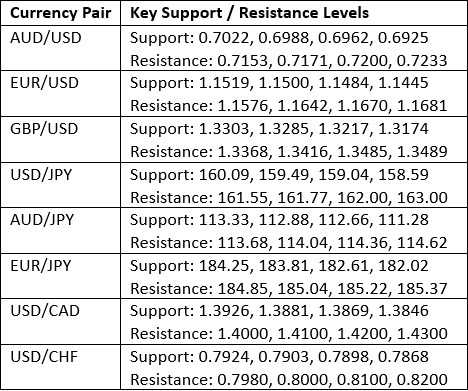
Key Support and Resistance Levels
The US Dollar printed a relatively small candlestick last week, which was both a bearish pin and an outside engulfing bar. This suggests bearishness, but as the price has been ranging for over one year now while locked in a consolidation, and there is clearly no valid long-term trend, I do not want to make any predictions about the US Dollar.
The main driver of the greenback today is progress towards a peace deal between the USA and Iran, and as that continues to vacillate from day to day, there is nothing to change the ranging price behaviour. If the situation plunges back into war or a peace deal is agreed, that could change. War will likely send the Dollar higher on inflation and safe haven concerns, while a peace deal will likely send the Dollar lower on the opposite logic.
Meanwhile, I think it makes sense to base trades over the coming week on other factors and to just ignore the US Dollar as a factor even if you are trading something priced in Dollars.
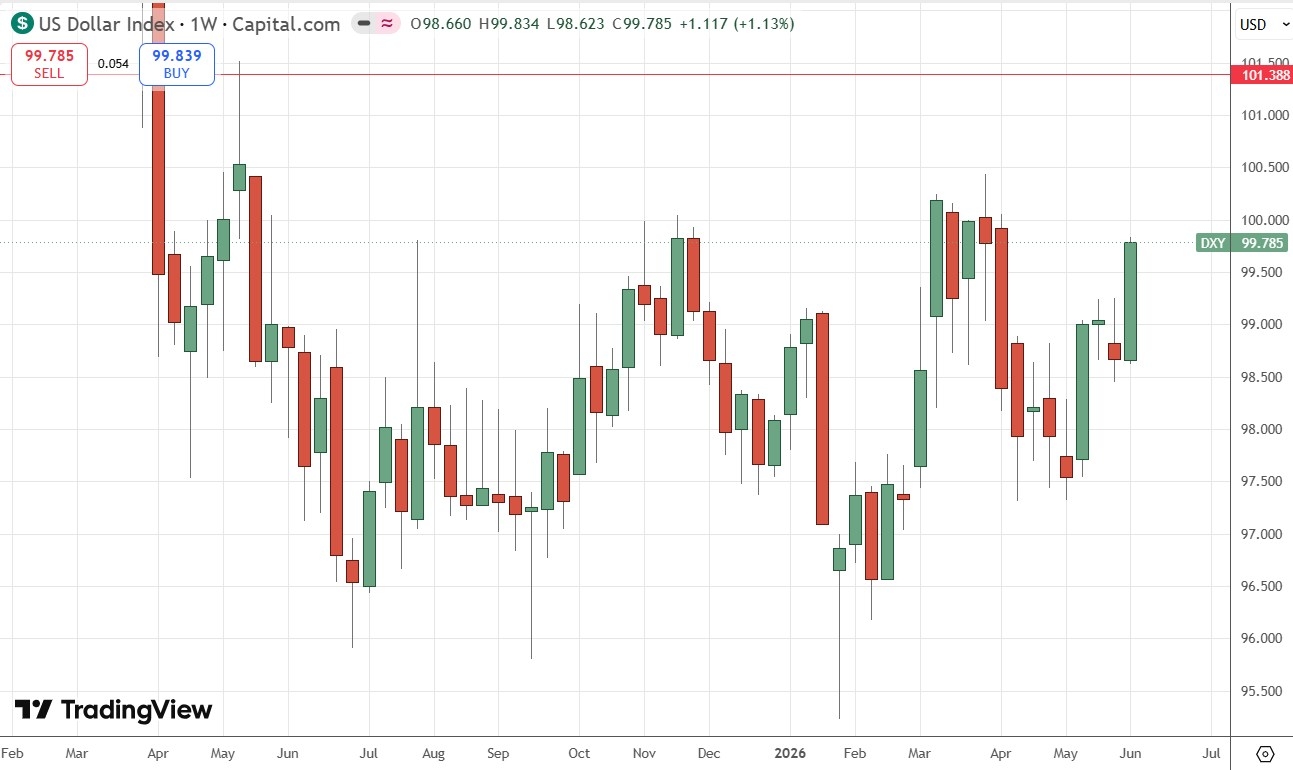
US Dollar Index Weekly Price Chart
The USD/JPY currency pair continued its steady advance last week, with all the daily candlesticks looking bullish, and most of them breaking to new highs with some significant lower wicks on display.
The price is now just short of recent long-term highs, notably the highest daily close in the past several months at ¥160.44. The price failed here at the last attempt to make a long-term bullish breakout. It looks like we are going to see another test.
Dollar strength is being pushed by fundamentals (a hawkish environment for the Fed with a hot US economy putting pressure on for more rate hikes), with the Japanese Yen showing long-term weakness for a similar reason (the extent of Japanese debt making further Bank of Japan rate hikes very difficult).
One question that must be asked is whether the Bank of Japan will intervene in the Forex market as it did the last time the USD/JPY reached this price area. I think they will feel they have to, especially if they see the breakout start to falter and run out of buy orders. The Bank of Japan does not want to see this currency pair weaken much beyond ¥160.00.
This might be a trade you want to pass on, but there are many trend traders who know they can usually find an excuse not to take good trades. For that reason, and for the fundamental reasons behind the trade which I already outlined, I will be going long if we do get a daily (New York) close above ¥160.44.
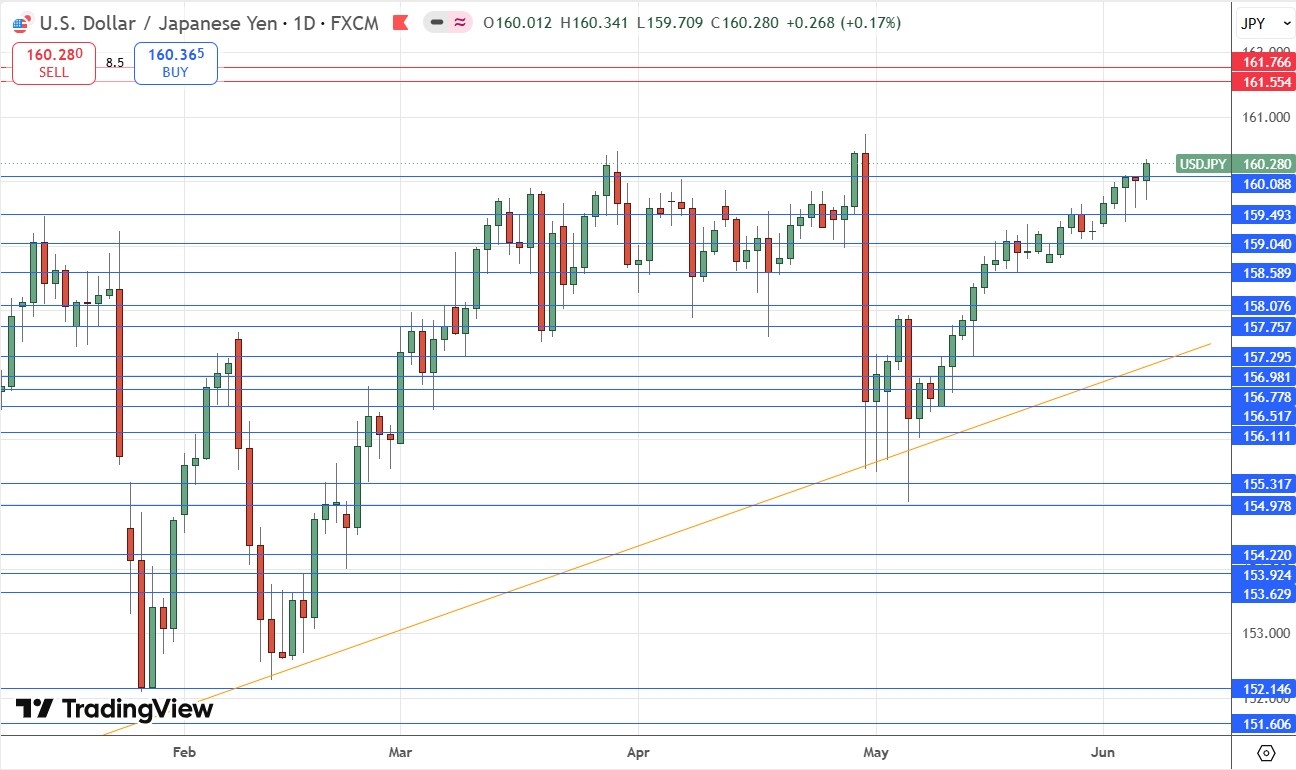
USD/JPY Daily Price Chart
This tech-based Index spent most of last week advancing to new highs, before selling off a bit on Thursday and then plummeting on Friday.
The rise was caused by general bullishness on the AI sector, and a hope the market has that the US/Iran war is close to a peaceful resolution (which I do not share). What burst the bubble on Friday was the surprisingly strong US jobs data, which will force the Federal Reserve to take more of a hawkish bias on monetary policy, and that is going to be a headwind for the US stock market.
The strong drop on Friday will be enough to make most trend-following Funds and institutions liquidate any long positions in this Index. However, there are reasons to believe the market will bounce back fairly soon, although it is certainly overbought and we do see valuations over stretched. The market remains bullish on AI.
I would not buy this Index just yet, as it is possible that it has further to fall. Best to wait a few more days to see how it behaves.
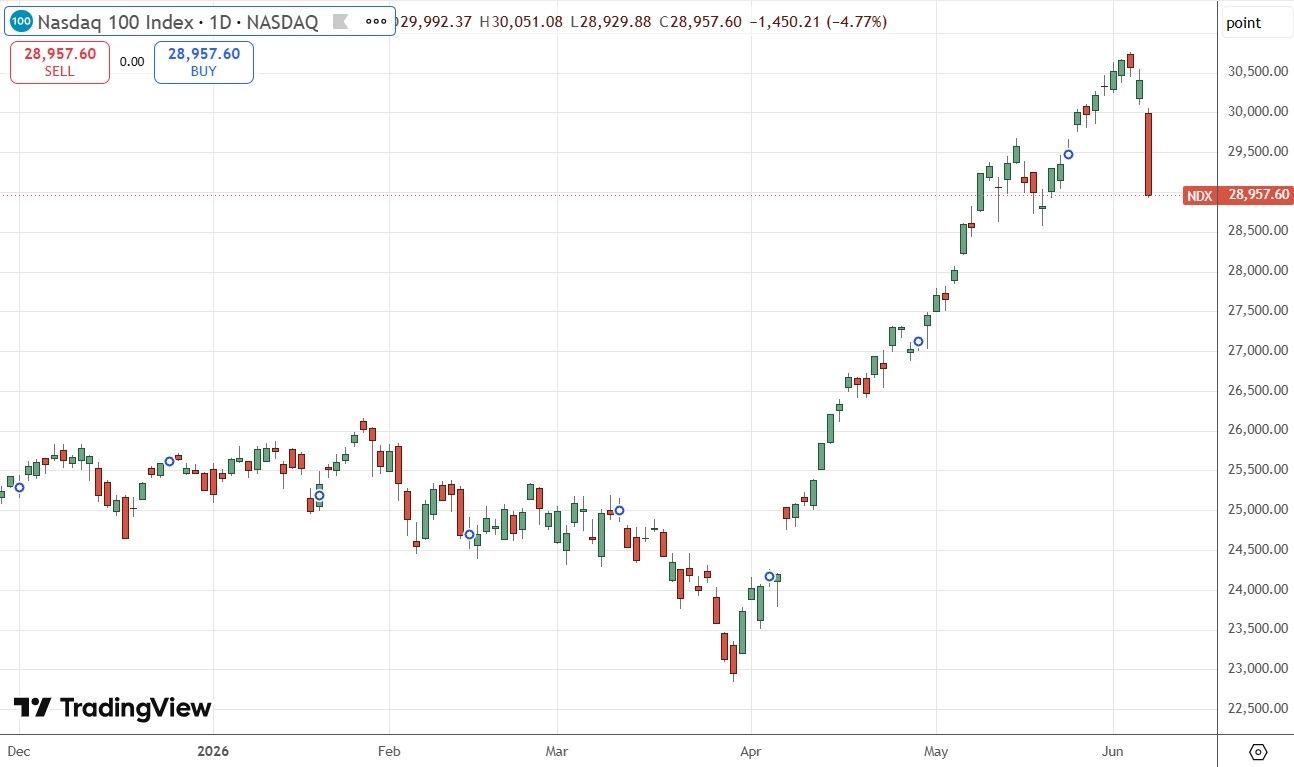
NASDAQ 100 Index Daily Price Chart
The S&P 500 Index had the same story last week as the NASDAQ 100 Index which I spelt out above. The only notable difference is that the S&P 500, being a broader Index without an exclusive technology focus, rose by less, and then fell by much less.
Trend traders who were long here last week will probably still be long in their trades.
I think the price has a good chance to bounce back, but it would be wise to wait a few days to see what happens, in case the market is spooked and stocks are due a further fall. If a deal is announced between the USA and Iran this week, that could give bulls a strong tailwind. I personally think any deal is unlikely to happen.
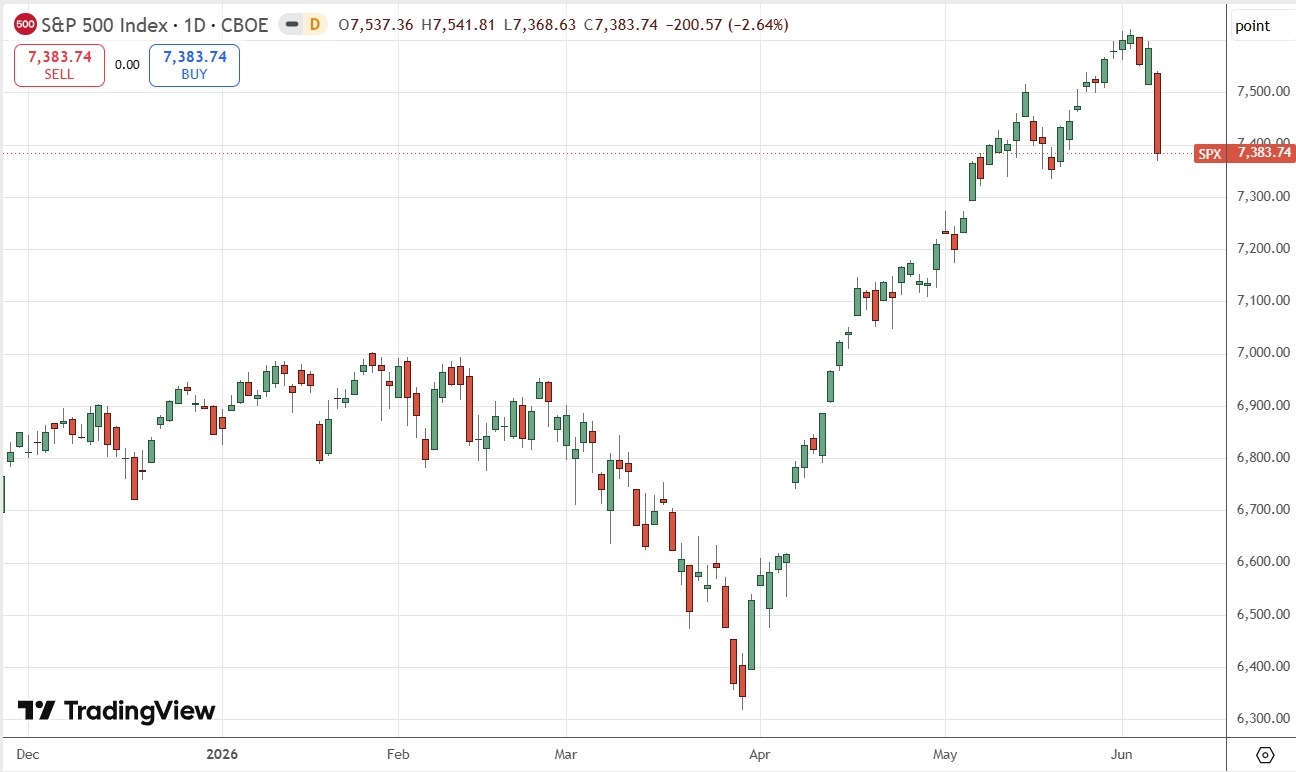
S&P 500 Index Daily Price Chart
Gold continued its medium-term bearish trend last week, gradually declining from Monday to Thursday and then falling strongly along with the US stock market on Friday after much stronger than expected US jobs data was released.
Friday’s close was the lowest daily close made by Gold in 2026. The price is back near the lows made in the immediate aftermath of the wild crash we saw in Gold and Silver back in late January earlier this year.
Note how in April, we saw a bullish retracement to the 50% level of the crash move down, and then a bearish rejection of that price.
I don’t like to go short of Gold as I see it as a risk-on asset that is better bought at highs, but if you are thinking of going short, we certainly see a strong and steady trend with short-term momentum too.
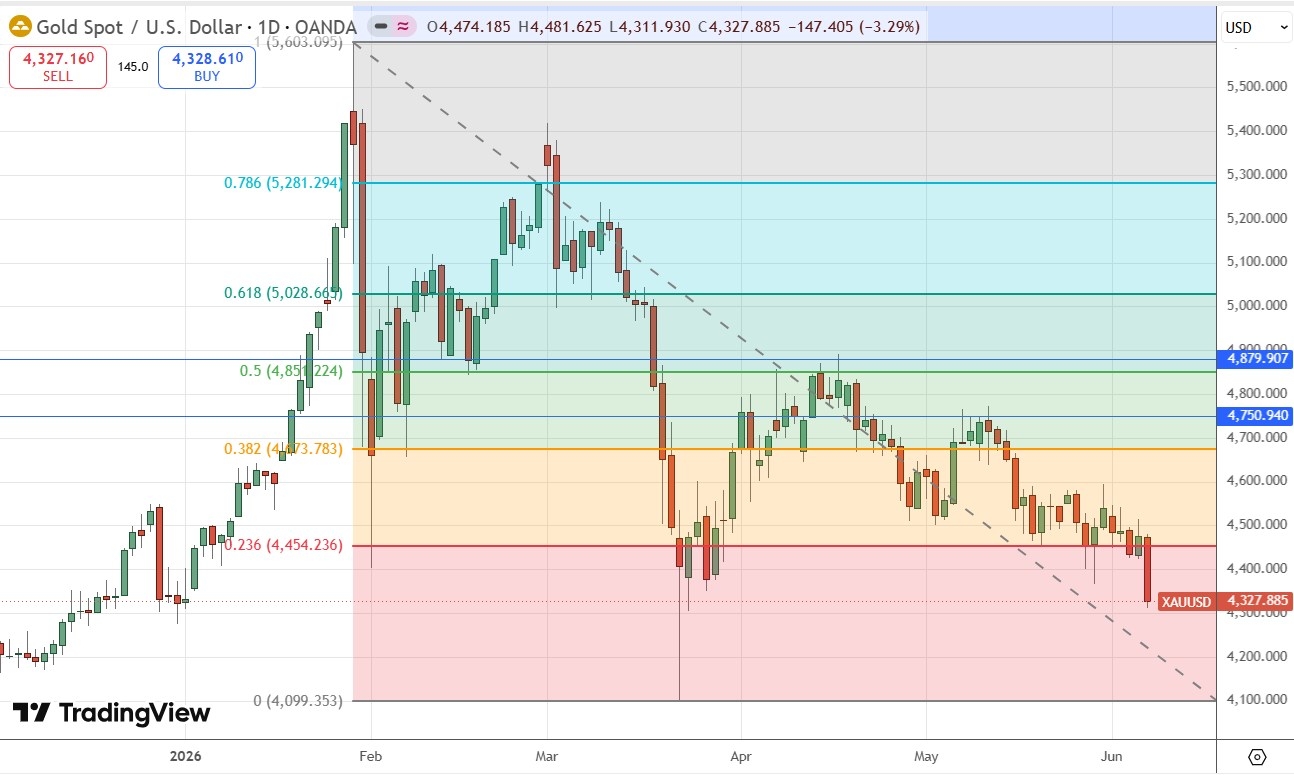
Gold Daily Price Chart
Bitcoin has been in trouble for months, declining in value while stock markets and other risk-on assets were advancing to new highs.
The bearish situation has become even more pronounced now, with the price reaching a new 18-month low price within the past few days, although there are signs that some support has been found with the doji at the low followed by today’s large and bullish candlestick. This might be a 2b false breakdown, so it could be attracting long-term buyers looking for a discount break.
You need to be a little brave to buy here, only do it if you really believe in Bitcoin as a long-term investment.
If we get a daily close at a new low, below $60,000, that will indicate a nice short trade opportunity on the breakdown. I would like to see that round number cleared before entering a new short trade. Bitcoin still looks like it is in trouble. If it falls further from here, the $50,000 area could be very interesting as a natural buying point. If that fails and the price continues to fall below that, most of the Bitcoin ecosystem could fall into real trouble.
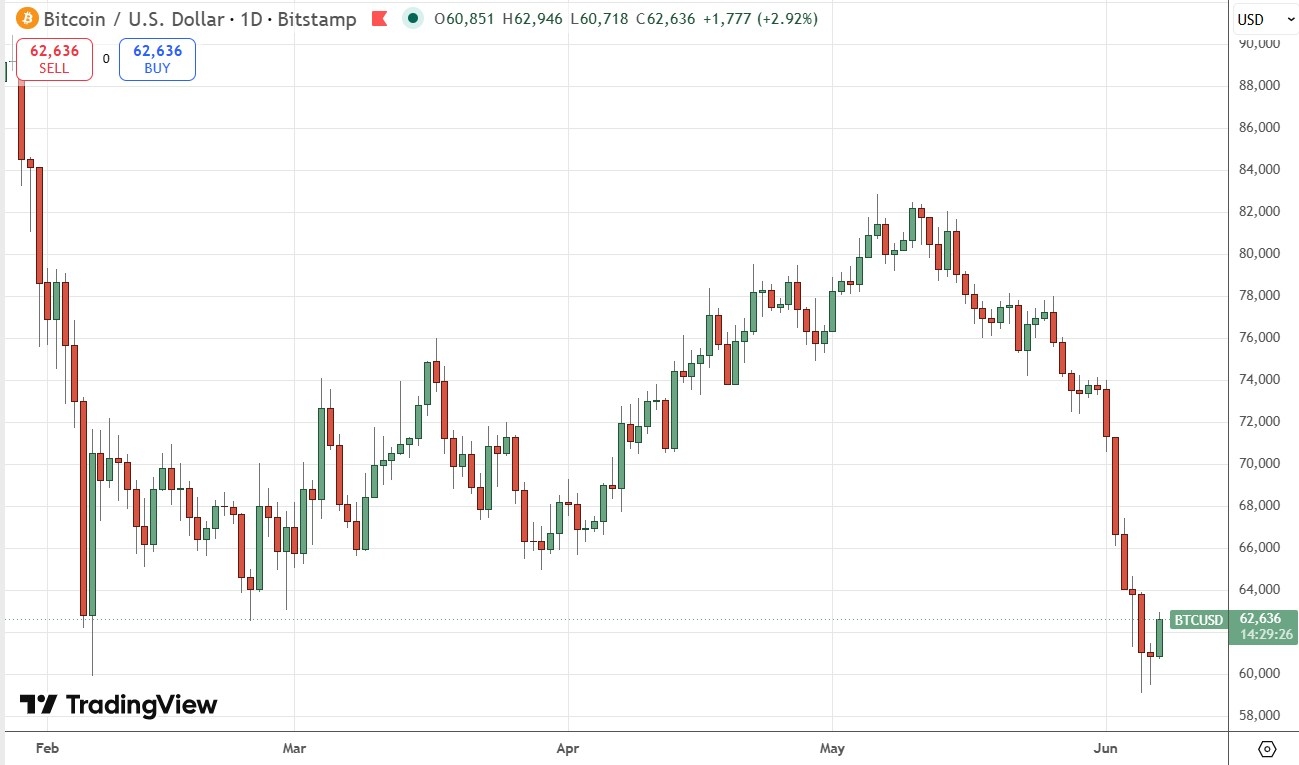
Bitcoin Daily Price Chart
I see the best trades this week as:
Long of the USD/JPY currency pair following a daily close above ¥160.44.
Ready to trade our Forex weekly forecast? Check out our list of the top 10 Forex brokers.
Explore the latest platinum price insights for Palani. As of now, platinum trades at
₹0 per 10g, ₹0 per 100g, and ₹0 per kg. In
June, prices shifted significantly. For 100g, the max was
₹5,95,300, and the min was ₹0. The
1kg rate fluctuated between ₹0 and
₹59,53,000.
Platinum pricing depends on mining output, worldwide demand, and political factors.
Heavy industrial use, particularly in automotive and electronic sectors, creates
significant market pull. Exchange rate shifts—most notably the US dollar—along with
inflation and central bank policies, directly affect the metal’s financial performance.
The bottoms in December 2023, September 2024, and April 2025 have triggered a strong surge in USD/JPY toward the 160 to 162 level.
But the rebound from April 2025 is more constructive as it produces a strong consolidation below the 160-162 zone.
This constructive price action near the 160 to 162 level increases the likelihood of upside breakout.
And if the USDJPY produces an upside breakout, it will likely trigger a strong surge in the pair.
To further understand the short term price action in USDJPY, another daily chart shows the red trend line. The trend line lies between the 160 and 162 levels. A break above this line will likely trigger the next surge in USDJPY.
Stay informed on platinum price trends in Tiruvannamalai. Today’s rates stand at ₹0
for 10g, ₹0 for 100g, and ₹0 for 1kg. In June, platinum
saw fluctuations. The highest rate for 100g touched ₹5,95,300,
and the lowest fell to ₹0. For 1kg, prices ranged from
₹0 to ₹59,53,000.
Global supply chains, mining rates, and geopolitical issues are major drivers of platinum
prices. Demand from the auto and electronics industries adds pressure. Exchange rate
movements, especially against the US dollar, combined with inflation trends and central
bank strategies, contribute significantly to changes in platinum’s market price.