The main category of All News Articles.
You can use the search box below to find what you need.
[wd_asp id=1]
The main category of All News Articles.
You can use the search box below to find what you need.
[wd_asp id=1]
Indonesia’s decaf coffee variety pack market sits at the intersection of two powerful consumer trends: rising specialty coffee culture and a growing desire to reduce daily caffeine intake. While Indonesia is a major global producer of arabica and robusta green beans, its domestic decaffeination processing infrastructure is negligible, meaning nearly all decaf coffee products consumed domestically rely on imported roasted or pre-blended decaf stock. The variety pack format—offering multiple origins, roast profiles, or brew methods (whole bean, ground, single-serve pods) in a single retail unit—is particularly suited to exploration-oriented consumers and gift-buying occasions.
The product is defined as a tangible consumer packaged good sold through modern grocery, specialty food stores, e‑commerce platforms, and direct-to-consumer subscription channels. Key decaffeination methods represented in the Indonesian market include Swiss Water Process, CO₂ decaffeination, and direct solvent processes, though chemical-free claims are increasingly used as a premium positioning tool. The market is heavily influenced by import dynamics, branding strategies, and the degree of consumer education about decaf quality, rather than by upstream agricultural factors. Demand is concentrated in Java, Bali, and Sumatra’s urban centres, with Jakarta alone accounting for an estimated 30–40% of national decaf variety pack sales.
The overall Indonesia coffee retail market was valued in the range of USD 2.5–3.5 billion in 2025, with decaf coffee occupying a low-single-digit share. Decaf variety packs represent a subset of that decaf category, accounting for roughly 15–20% of decaf coffee sales by value, the rest being single-origin decaf bags or regular decaf blends. On a volume basis, the variety pack segment is estimated to have sold between 250 and 400 tonnes of decaf coffee equivalent in 2025, growing at a 12–15% compound rate over the prior three years, compared to 6–8% for the overall packaged coffee market.
From 2026 to 2035, demand is expected to maintain a trajectory of 9–13% annual growth in volume terms, driven by urbanisation, rising disposable incomes, and the mainstreaming of evening coffee consumption. The value growth rate will likely be higher, in the 11–16% range, as the mix shifts toward premium-process decaf and multi-format variety packs. By 2035, the segment could roughly triple in volume compared to 2026, though it will remain a niche—probably still below 3% of total coffee consumption in Indonesia—due to the strong cultural preference for traditional caffeinated coffee and the price premium of decaf.
Three format segments dominate the Indonesia decaf variety pack market. Ground decaf packs hold the largest share, approximately 40–45% of sales by volume, driven by compatibility with standard drip brewers and pour-over devices used in Indonesian households. Whole bean decaf packs account for 25–30%, favoured by specialty coffee enthusiasts who grind at home, while single-serve pod/capsule packs capture 18–22% and are the fastest-growing format, benefiting from the proliferation of Nespresso‑compatible and Dolce Gusto‑compatible systems in urban homes. Mixed-format discovery packs—containing a combination of whole bean, ground, and pods—represent less than 10% but carry the highest average selling price per gram and are heavily used in subscription and gift channels.
In terms of application, at-home consumption is the dominant end-use, accounting for 55–65% of variety pack sales. Office and workplace consumption (15–20%) is growing as corporate gifting programmes adopt decaf variety packs for wellness-focused employee incentives. Subscription/discovery services (10–15%) are the fastest channel, with monthly recurring deliveries of rotating decaf origins and methods. Hospitality and foodservice trial sizing (5–10%) remains small but strategically important for brand-building; hotels and upscale cafes use single-serve decaf packs as a guest amenity or tasting menu component.
Buyer groups span end consumers (direct-to-consumer e‑commerce and store purchases), grocery buyers managing category resets, specialty food store buyers, corporate procurement officers for gifting, and hotel food and beverage managers.
Retail pricing for decaf variety packs in Indonesia exhibits a wide range, from approximately IDR 45,000–60,000 per 250 g for a basic private‑label ground variety pack to IDR 120,000–200,000 per 250 g for a premium Swiss Water Process single‑origin whole bean discovery pack. The key cost drivers cascade from green bean commodity prices (arabica at approximately USD 2.50–4.00 per kg FOB origin), to the decaffeination premium (USD 1.00–2.50 per kg of green bean, depending on method and certification), to roasting, packaging, and branding margins. Variety packs incur additional costs from smaller batch sizes, multi‑origin sourcing, and custom packaging inserts.
The decaffeination premium is the single largest factor separating decaf from regular coffee prices. Chemical-free processes (Swiss Water, CO₂) command a 40–60% premium over conventional solvent decaf, and this differential is passed through to the retail level. Indonesian importers also face 5–10% import duties on finished roasted decaf coffee under HS codes 090121 and 090122, plus logistics costs from processing hubs in Switzerland, Germany, Canada, or the United States. As a result, decaf variety packs are priced 35–50% above equivalent regular coffee variety packs in Indonesian retail, which constrains adoption in lower‑income demographics but reinforces the premium “health and specialist” positioning that drives the higher‑margin segment.
The competitive landscape in Indonesia’s decaf variety pack market consists of three archetypes. Global brand owners and category leaders—such as Nestlé (Nescafé Gold Decaf, Dolce Gusto Decaf capsules), JAB Holding (Jacobs, Douwe Egberts), and illy—leverage established distribution networks and brand trust, offering decaf variety packs primarily through modern trade and e‑commerce platforms. Their market share is estimated at 40–50% by value, driven by strong shelf presence and promotional spending.
Specialty coffee roasters and direct-to-consumer brands account for 25–35% of the market. These include Indonesian roasters such as Anomali Coffee, Tanamera Coffee, and Common Grounds, which source decaffeinated green beans from overseas, roast in‑country, and assemble variety packs for their own cafes and online stores. They compete on origin storytelling and process transparency. Private‑label and retailer‑brand decaf variety packs (10–15% share) are offered by major grocery chains and discounters, typically sourced from contract roasters in Singapore or Malaysia.
Online‑first subscription boxes, both local (e.g., Kopi Pack, Month & Co.) and international (Bean Box, Trade Coffee), represent the fastest-growing competitive segment, though still small in absolute share (5–10%). Competition is intensifying, with price promotions and free‑shipping offers being the primary tools to drive trial in a category where repeat purchase is still being established.
Indonesia has no commercially significant domestic decaffeination plants. The country is a major producer of green coffee beans (ranked third or fourth globally), but virtually all beans destined for the domestic decaf market must be shipped to decaffeination facilities in Switzerland, Germany, Canada, or the United States for processing, then re‑imported as decaffeinated green beans or already roasted decaf coffee. A few specialty roasters, such as Tanamera Coffee, have experimented with small‑lot contract decaffeination runs in Europe and then bring the processed beans back to Indonesia for roasting and packaging.
The supply model is therefore import‑led. Monthly containerised shipments of decaffeinated green beans (typically 18–20 metric tonnes per container) arrive at Tanjung Priok (Jakarta) and Tanjung Perak (Surabaya) ports. Roasters in‑country perform the roasting, blending, grinding, and packaging functions required to assemble variety packs. Lead times from order of green decaf beans to finished packs on shelf range from 8 to 16 weeks, depending on shipping schedules and customs clearance. This structure makes the market vulnerable to global logistics disruptions and to capacity constraints at preferred decaffeination facilities, which often allocate capacity to larger Western buyers first. Domestic supply availability is thus a function of foreign processing capacity, not local agricultural output.
Indonesia is a net importer of decaffeinated coffee products. Customs data under HS codes 090121 (roasted, not decaffeinated) and 090122 (roasted, decaffeinated) indicate that over 90% of decaffeinated roasted coffee entering Indonesia comes from Switzerland, Germany, and the United States—countries that host the major decaffeination plants. Decaf variety packs, as manufactured consumer goods, are imported either as finished retail products (with branding and packaging already applied) or as bulk decaf roasted beans that are then packed locally. The latter route is preferred by domestic roasters because it allows customisation of the variety pack assortment and avoids higher duties on finished retail goods.
Trade flows are further complicated by the lack of preferential trade agreements between Indonesia and most decaffeination hubs, resulting in import duties of 5–10% on roasted decaf coffee plus 10% VAT. Re‑export of decaf coffee from Indonesia is negligible—the country’s role is that of a consumer market, not a processing hub. A small amount of decaf variety packs may be re‑exported to neighbouring countries (Singapore, Malaysia) as part of regional e‑commerce fulfilment, but this volume is below 2% of total imports. The trade structure underscores the market’s dependency on the efficiency and cost competitiveness of global decaffeination supply chains.
Modern grocery retailers (hypermarkets, supermarkets, and convenience stores) are the primary distribution channel for decaf variety packs in Indonesia, accounting for 50–55% of sales. Chains such as Transmart, Hypermart, Superindo, and Ranch Market stock both branded and private‑label decaf variety packs in dedicated coffee aisles and health‑food sections. Specialty food stores and coffee shops (15–20%) serve as discovery channels where consumers first encounter premium decaf variety packs, often through in‑cafe retail displays. E‑commerce platforms, led by Tokopedia, Shopee, and Lazada, together capture 20–25% of sales, with the share rising 3–5 percentage points per year as online grocery adoption deepens in urban areas.
Direct‑to‑consumer subscription models represent the smallest but most dynamic channel (5–10%). These buyers are typically middle‑ to high‑income urban consumers aged 25–45, purchasing out of interest in wellness and coffee exploration rather than daily necessity. Business buyers include corporate procurement managers (for gifting), hotel F&B directors, and office coffee service operators. Each buyer group has distinct purchasing criteria: grocery category managers focus on rotation speed and margin, while corporate buyers prioritise packaging aesthetics and delivery reliability. The distribution landscape is fragmenting as DTC brands bypass traditional retail margins, pressuring established brand owners to invest in their own e‑commerce storefronts and subscription offerings.
The primary regulatory framework for decaf coffee variety packs in Indonesia is the National Agency for Drug and Food Control (BPOM) regulation on processed food registration and labelling. All decaf coffee products must be registered with BPOM and bear a distribution permit number (MD/ML). Labelling requirements include a list of ingredients, nutrition information, net weight, and the declaration of “decaffeinated” if the caffeine content is below 0.1% on a dry‑weight basis. The use of specific decaffeination process claims (e.g., “Swiss Water Process”, “CO₂ decaffeinated”, “chemically free”) is permitted only if substantiated by a certificate of analysis from the processing facility. Misleading claims can result in permit suspension.
Additional voluntary certifications—Organic (SNI 6729 or international equivalents), Fair Trade, and Rainforest Alliance—are increasingly used as differentiators in the variety pack market, particularly by specialty roasters and DTC brands. The Indonesian National Standard (SNI) for coffee (SNI 01‑3542) sets limits on maximum allowable caffeine content for decaf (0.1% m/m), though enforcement in the variety pack segment relies on batch testing. E‑commerce regulations under Government Regulation No. 80/2019 require online sellers of processed foods to display BPOM registration numbers prominently.
As the category grows, BPOM is expected to issue more specific guidance on the labelling of variety packs that contain multiple roast profiles or origins, particularly regarding allergen cross‑contact and lot traceability across the pack’s components.
Over the 2026–2035 forecast horizon, the Indonesia decaf coffee variety pack market is projected to grow at a compound annual rate of 10–14% in value terms, outpacing both the regular coffee market (6–8%) and the broader packaged food segment. By 2035, the segment’s volume could double to 2.5–3 times the 2026 level, driven by three structural factors: the expansion of the health‑conscious middle class, the maturation of coffee culture in secondary cities (Bandung, Surabaya, Medan, Makassar), and the normalisation of evening coffee occasions as part of Indonesian social life.
Premium sub‑segments—single‑origin decaf packs with chemical‑free process claims, subscription discovery boxes, and limited‑edition variety packs—will gain share from entry‑level private‑label products, potentially accounting for 55–65% of segment value by 2035. Single‑serve pod variety packs will grow at the fastest rate (15–18% CAGR), while whole bean and ground formats see steady 8–11% growth. The market will remain import‑dependent, but a moderate increase in local roasting and packing of decaf beans (sourced from foreign decaffeination plants) could reduce landed costs by 5–10% relative to fully imported finished packs. Competitive intensity will rise as global brand owners deepen local distribution and small roasters scale their DTC operations, leading to margin compression in the mid‑priced tier.
The most significant opportunity lies in consumer education and trial conversion. With decaf variety pack penetration still under 2% of coffee‑drinking households, investments in experiential marketing—pop‑up tasting kiosks, workplace samplers, and influencer‑led brewing tutorials—can unlock a substantial latent demand. The evening and after‑dinner coffee occasion is virtually untapped in Indonesia; positioning decaf variety packs as the “perfect night‑cap coffee” could create a new daily usage ritual. Subscription models, in particular, offer a recurring revenue stream and a data loop to understand flavour preferences across regions and roast profiles.
A second opportunity is in the premium gifting segment. The variety pack format, with its visual differentiation and sampling value, is ideally suited for corporate gifts, festive hampers, and wedding favours. Brands that develop elegant, customisable packaging with local design cues can command wholesale prices 40–60% above standard retail. Furthermore, as the foodservice sector recovers and expands, hotels and cafes looking to differentiate their amenity programmes will seek out exclusive decaf variety packs tailored to their brand identity.
Finally, there is a structural opening for a domestic decaffeination facility—potentially in Java near major ports—to reduce import lead times and costs, although the capital investment (USD 10–20 million for a moderate‑scale plant) and reliance on specialty‑grade green bean supply remain significant barriers. For now, the most accessible opportunities are in branding, distribution, and direct consumer engagement, rather than upstream processing.
This report is an independent strategic category study of the market for decaf coffee variety pack in Indonesia. It is designed for brand owners, general managers, category leaders, trade-marketing teams, e-commerce teams, retail partners, distributors, investors, and market entrants that need a clear read on where growth sits, which brands control the category, how pricing and promotion shape demand, and which channels matter most for scale and margin.
The framework is built for Packaged Coffee & Beverages markets within consumer goods, where performance is driven by need states, shopper missions, brand hierarchies, price-pack architecture, retail execution, promotional intensity, and route-to-market control rather than by a narrow technical specification alone. It defines decaf coffee variety pack as A curated assortment of decaffeinated coffee products, typically including multiple roast profiles, origins, or brewing formats, sold as a single SKU for consumer trial, convenience, or subscription and maps the market through category boundaries, consumer segments, usage occasions, channel structure, brand and private-label positions, supply and availability logic, pricing and promotion mechanics, and country-level commercial roles. Historical analysis typically covers 2012 to 2025, with forward-looking scenarios through 2035.
This report is designed to answer the questions that matter most to brand, category, channel, and strategy teams in consumer-goods markets.
At its core, this report explains how the market for decaf coffee variety pack actually works as a consumer category. It is built to show where demand comes from, which need states and shopper missions matter most, which brands and private-label players shape the category, which channels control visibility and conversion, and where pricing power, repeat purchase, and margin are actually created.
Rather than framing the category through narrow technical attributes, the study breaks it into decision-grade commercial layers: product format, benefit platform, shopper segment, purchase occasion, pack-price architecture, channel environment, promotional intensity, route-to-market control, and company archetype. It is therefore useful both for teams shaping portfolio strategy and for teams executing growth through End Consumer (DTC), Grocery Retailer (Category Manager), Specialty Food Store Buyer, Corporate Procurement (Gifting), and Hospitality/Foodservice Buyer.
The report also clarifies how value pools differ across Daily caffeine-free consumption, Evening coffee occasion, Health-conscious & sensitive consumer routines, and Gifting & trial for new decaf drinkers, how premiumization and private label reshape category economics, how retail concentration and route-to-market design affect scale, and which countries matter most for brand building, sourcing, packaging, and channel expansion.
The report is based on an independent market-intelligence methodology that combines category reconstruction, public company evidence, retail and channel mapping, pricing review, and multi-layer triangulation. It is built for consumer categories where no single public dataset captures the real structure of demand, brand power, promotion, and channel control.
The evidence stack typically combines company disclosures, investor materials, brand and retailer product pages, e-commerce assortment checks, packaging and claims analysis, public pricing references, trade statistics where relevant, regulatory and labeling guidance, and observable route-to-market evidence from distributors, retailers, merchandisers, and marketplace ecosystems.
The analytical model then reconstructs the category across the layers that matter commercially: category scope, shopper need states, consumer segments, pack-price ladders, brand and private-label hierarchy, channel power, promotional intensity, route-to-market design, and country role differences.
Special attention is given to Health & wellness trends reducing caffeine intake, Evening/afternoon coffee occasion growth, Aging population & caffeine sensitivity, Premiumization & exploration in decaf segment, and Subscription & discovery box popularity. The objective is not only to size the market, but to explain where value pools sit, which segments drive mix and repeat purchase, which channels shape growth, and how leading brands defend or expand their positions across End Consumer (DTC), Grocery Retailer (Category Manager), Specialty Food Store Buyer, Corporate Procurement (Gifting), and Hospitality/Foodservice Buyer.
The report does not rely on survey-based opinion as its core evidence base. Instead, it uses observable commercial signals and structured public evidence to build a decision-grade view for brand, category, retail, e-commerce, investment, and market-entry teams.
This report defines decaf coffee variety pack as A curated assortment of decaffeinated coffee products, typically including multiple roast profiles, origins, or brewing formats, sold as a single SKU for consumer trial, convenience, or subscription and treats it as a branded consumer category rather than as a narrow technical product class. The objective is to capture the real commercial market that category, brand, trade-marketing, and channel teams are managing.
Scope is determined by how the category is sold, merchandised, priced, and chosen in market. That means the report follows product formats, claims, price tiers, pack architecture, need states, and retail environments that shape Daily caffeine-free consumption, Evening coffee occasion, Health-conscious & sensitive consumer routines, and Gifting & trial for new decaf drinkers.
The study deliberately separates the category from adjacent baskets when they distort the economics or shopper logic of the market being measured. Typical exclusions therefore include Single-variety decaf coffee bags, Caffeinated coffee variety packs, Instant decaf coffee jars, Ready-to-drink (RTD) decaf coffee beverages, Decaf tea or other caffeine-free products, Coffee equipment & brewers, Coffee syrups & flavorings, Caffeinated coffee subscriptions, Specialty tea samplers, and Functional beverage packs.
The report provides focused coverage of the Indonesia market and positions Indonesia within the wider global consumer-goods industry structure.
The geographic analysis explains local consumer demand conditions, brand and private-label balance, retail concentration, pricing tiers, import dependence, and the country’s strategic role in the wider category.
This study is designed for strategic and commercial users across brand-led consumer categories, including:
In many brand-driven, channel-sensitive, and consumer-demand-led markets, official trade and production statistics are not sufficient on their own to describe the true market. Product boundaries may cut across multiple tariff codes, several product categories may be bundled into the same official classification, and a meaningful share of activity may take place through customized services, captive supply, platform relationships, or technically specialized channels that are not directly visible in standard statistical datasets.
For this reason, the report is designed as a modeled strategic market study. It uses official and public evidence wherever it is reliable and scope-compatible, but it does not force the market into a purely statistical framework when doing so would reduce analytical quality. Instead, it reconstructs the market through the logic of demand, supply, technology, country roles, and company behavior.
This makes the report particularly well suited to products that are innovation-intensive, technically differentiated, capacity-constrained, platform-dependent, or commercially structured around specialized buyer-supplier relationships rather than standardized commodity trade.
The report typically includes:
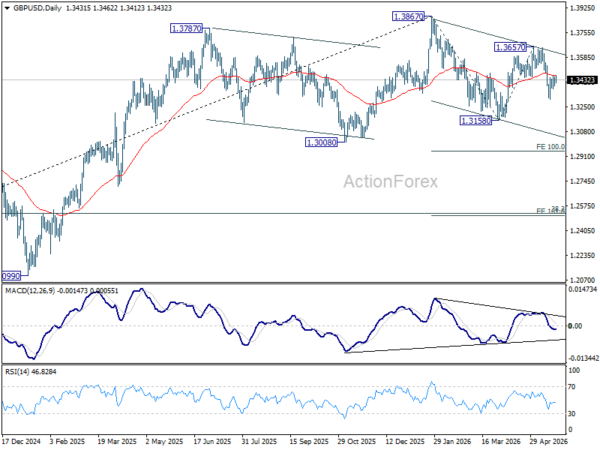
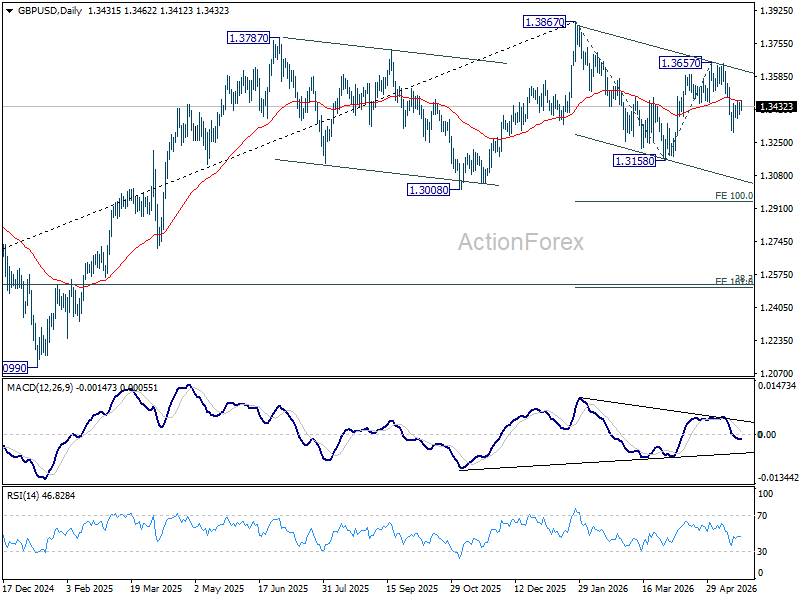
GBP/USD’s recovery was capped at 1.3462 last week. Initial bias remains neutral this week first. On the downside, below 1.3300 will target a retest on 1.3158 support first. However, firm break of 1.3462 will bring stronger rebound back to 1.3657 resistance instead.
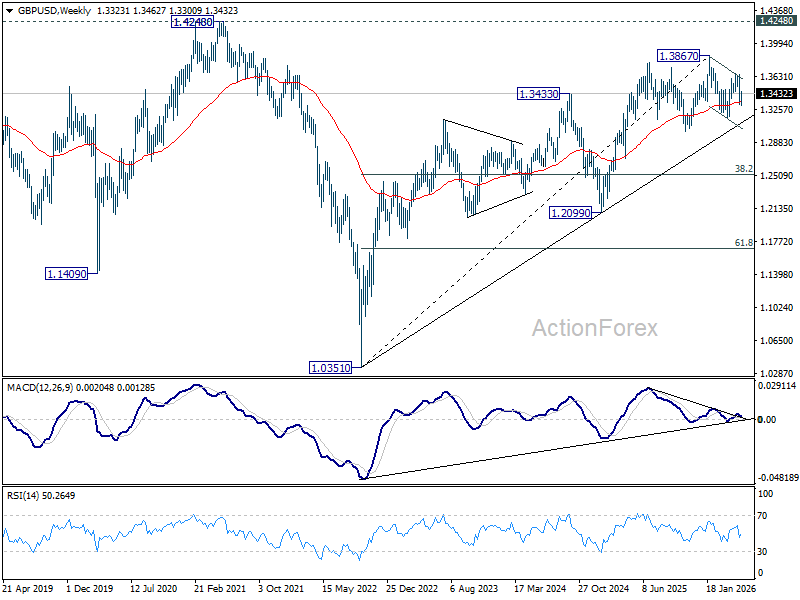
In the bigger picture, current development suggests that price actions from 1.3867 are merely a corrective pattern within the broader up trend from 1.0351 (2022 low). With 1.3008 support intact, medium term bullishness is maintained and break of 1.3867 is in favor for a later stage, towards 1.4248 key resistance (2021 high). However, firm break of 1.3008 will at least bring deeper fall to 38.2% retracement of 1.0351 to 1.3867 at 1.2524, with increased risk of bearish reversal.
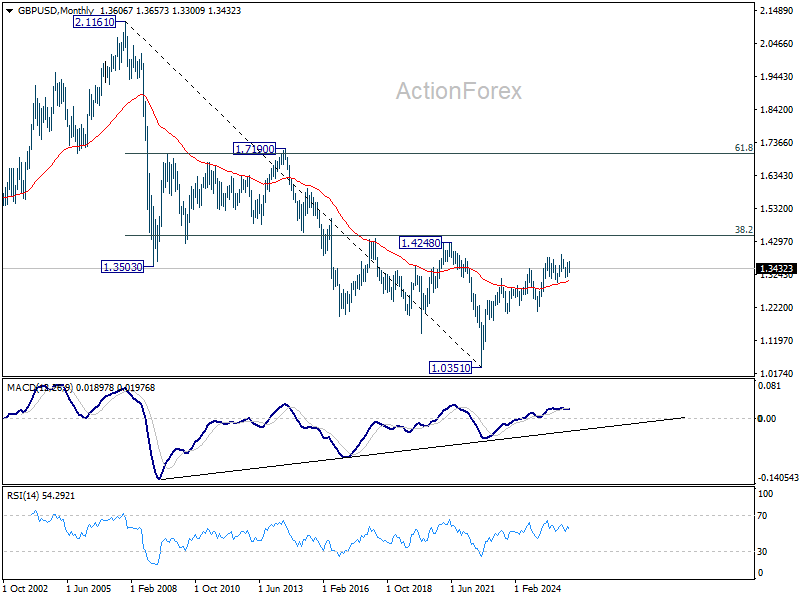
In the long term picture, as long as 1.4248/4480 resistance zone holds (38.2% retracement of 2.1161 to 1.0351 at 1.4480), the long term outlook will remain bearish. That is, price actions from 1.0351 are seen as a corrective pattern to down trend from 2.1161 (2007 high) only. Nevertheless, decisive break of 1.4248/4480 will be a strong sign of long term bullish reversal.
I wrote on 17th May that the best trades for the week would be:
Long of Brent Crude Futures (or a suitable ETF) if we get a daily close above $114.46. This did not set up.
Long of Gasoline Futures (or UGA ETF) following a daily close above $3.7382. This did not set up.
Long of the US 10-Year Treasury Yield future. This gave a loss of 0.52%.
The overall loss of 0.52% last week averaged a per asset loss of 0.17%.

A summary of last week’s most important data in the market:
US FOMC Meeting Minutes – marginally more hawkish than expected, so may have given a very slight tailwind for the USD.
UK CPI (inflation) – lower than expected, with the annualized rate falling to 2.8%. This will take some pressure off the Bank of England and may have led the British Pound to a weaker price than it might otherwise have shown.
Canadian CPI (inflation) – lower than expected, with the annualized rate falling to 2.8%. This will take some pressure off the Bank of Canada and may have led the Canadian Dollar to a weaker price than it might otherwise have shown.
UK Flash Services & Manufacturing PMI – these growth indicators outperformed expectations, which may give investors a bit more confidence in the UK.
Australia Unemployment Rate – this rose unexpectedly from 4.3% to 4.5%.
UK Claimant Count Change (Unemployment Claims) – this was broadly in line with expectations.
Last week saw global stock markets edge higher, with the US Dow Jones 30 reaching a new record high, and other major indices close higher near their respective record highs, as did the major Japanese and South Korean stock indices. Markets are being led higher by strong earnings data and continuing bullish sentiment on the AI sector.
Bond yields generally remained elevated on inflation fears, although many yields came off their highs as both UK and Canadian inflation data came in lower than expected.
Crude Oil remained elevated as uncertainty continued over the ongoing standoff between the USA and Iran.
Crypto and Forex markets were relatively quiet. Commodities were mixed.
The news is dominated by an emerging confirmation by President Trump that the USA and Iran will shortly sign a memorandum of understanding. It seems that this will provide a 60-day period where the US blockade of Iran will end and the Strait of Hormuz will reopen, but the exact terms beyond that remain unclear.
The effect of this news, assuming the memorandum is shortly signed, will almost certainly be to send stock markets and risk assets higher as soon as markets open this week, while yields and crude oil will fall. In the Forex market, we are likely to see firm rises in the AUD/USD and AUD/JPY currency pair and cross.
Beyond that, the coming week’s most important data points, in order of likely importance, are:
US Core PCE Price Index
US Advance GDP
Australian CPI (inflation)
Reserve Bank of New Zealand Policy Meeting – no change to the Official Cash Rate is expected.
Canadian GDP
Monday is a public holiday in the USA, the UK, Germany, France, and Switzerland.
Currency Price Changes and Interest Rates
For the month of May, as there is no clear trend in the US Dollar, I made no monthly forecast.
This week, I made no weekly forecast, as there were no unusual movements in the Forex market last week.
Volatility decreased last week, with only 15% of currency pairs moving by more than 1% in value. Next week’s volatility is likely to be higher as there are several high impact data items due, and the effect of the emerging deal between the USA and Iran.
You can trade these forecasts in a real or demo Forex brokerage account.
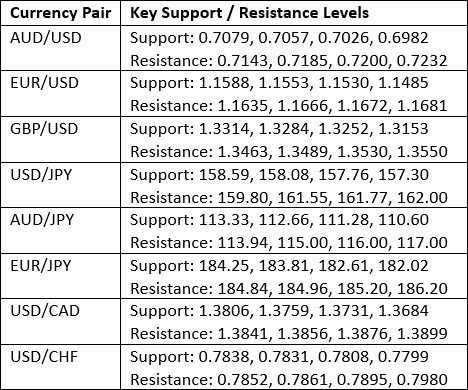
Key Support and Resistance Levels
The US Dollar printed an unusually small doji candlestick last week, which is suggestive of indecision or indifference by the market.
We have no long-term trend, and the greenback has been consolidating within its current range for an entire year now.
It is possible that the emerging news of a deal between the USA and Iran might reduce perceived inflationary pressure which could be a dovish influence upon Dollar yields, and this might send the Dollar lower over the coming week. However, several other currencies are facing the same situation as oil shock inflation feeds through everywhere, so as it is all relative, it might now have much influence.
What these factors point to is a Dollar which is likely to range slightly with unpredictable price action. It is not in a directionally tradable condition. Therefore, I think it makes sense to base trades over the coming week on other factors and to just ignore the US Dollar as a factor even if you are trading something priced in Dollars.
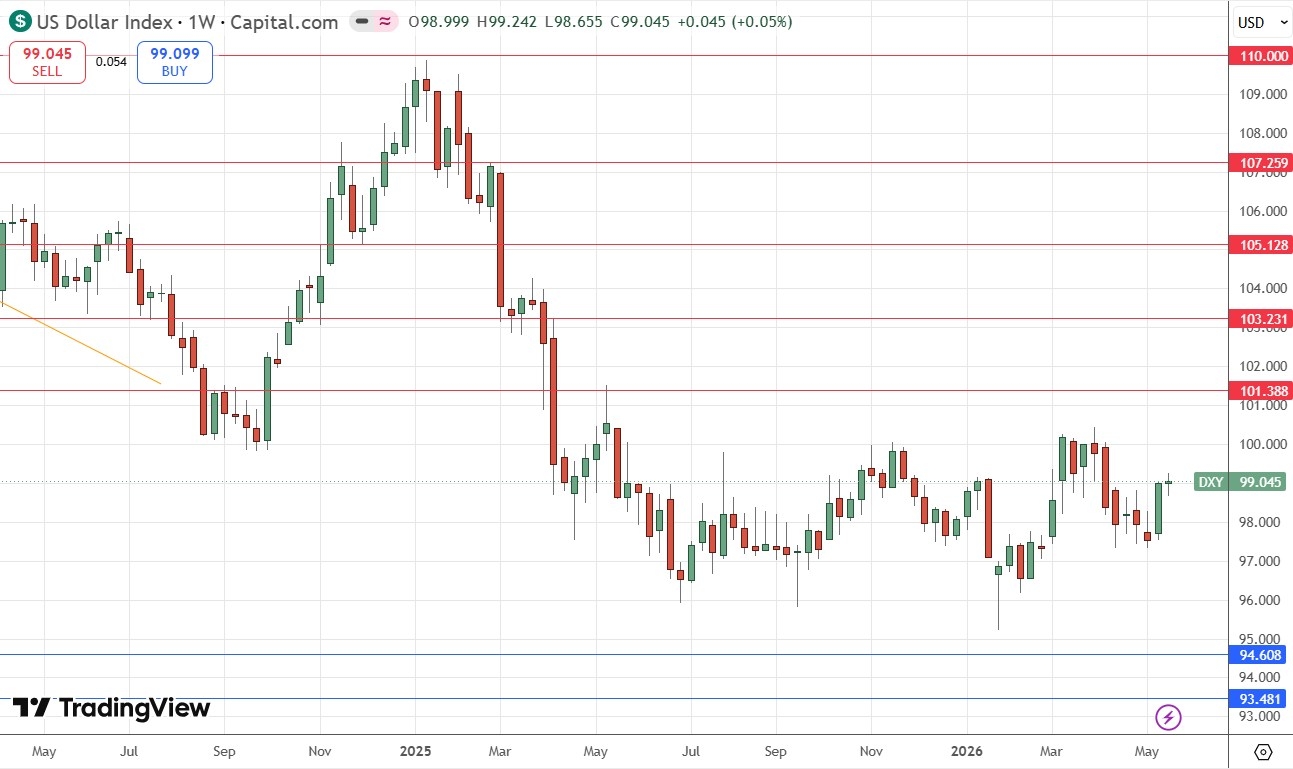
US Dollar Index Weekly Price Chart
The AUD/USD currency pair printed a doji candlestick last week, that was slightly bearish, although the price action is not far from the 3.5-year high price which this currency pair made three weeks ago. The price has been ranging between support and resistance, and this is probably because the world was waiting to see whether the USA and Iran would resume a kinetic war or reach some kind of deal to end the war and the entire standoff.
It now seems very likely that a deal, or at least the beginning of one, has been reached if not fully signed and agreed. I think it is very likely that this will cause a substantial improvement in risk sentiment, and as that happens, this pair will probably open with a gap higher when the Forex market opens for this week. Technical factors will initially be relatively unimportant but could become significant after a few hours if the price becomes over-extended.
This is a pair to keep your eye on if factors move towards progress of this deal. If the price breaks above its recent 3.5 year high, it will be trading in blue sky and could move higher with ease. The AUD/JPY currency cross could do even better in the same direction.
I see this currency pair as likely to advance over the coming week.
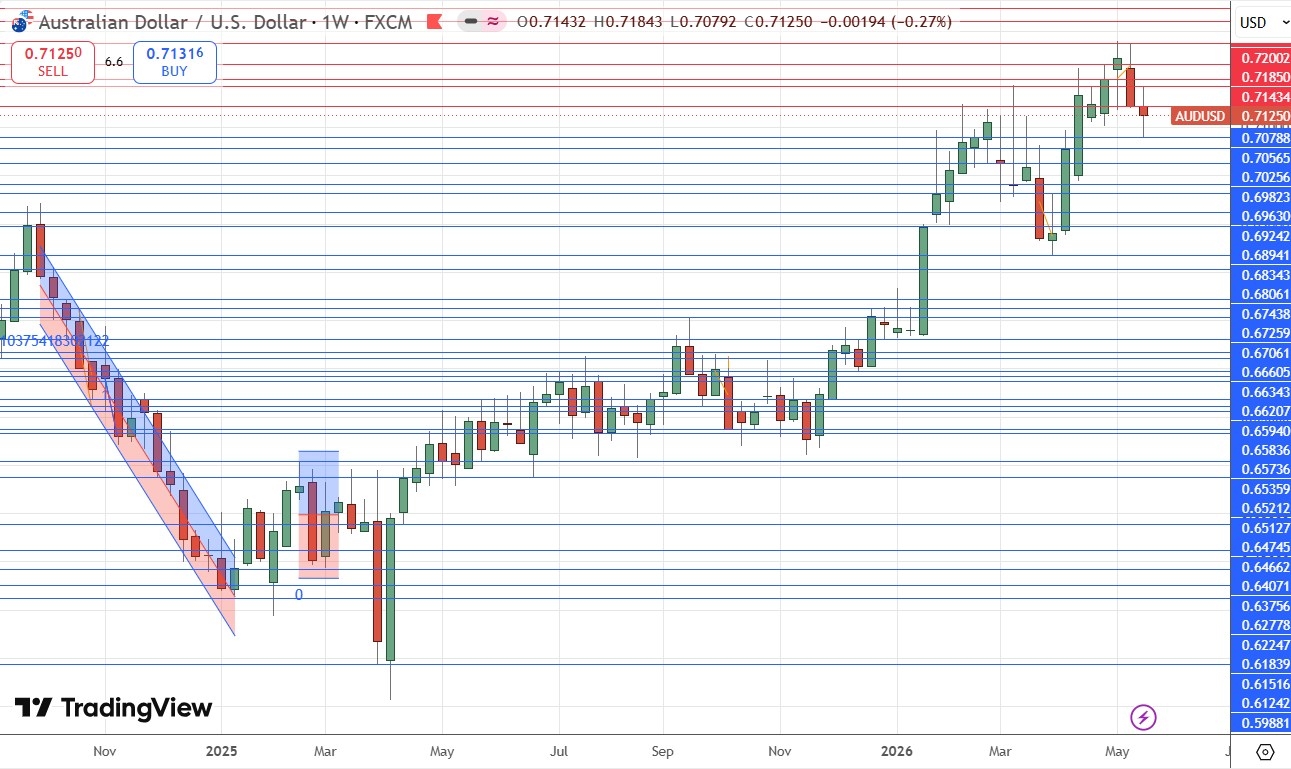
AUD/USD Weekly Price Chart
The S&P 500 Index rose firmly last week, closing not far below 7,500 which is near the record high it made just a couple of weeks ago.
It was driven higher by NVIDIA’s surprisingly excellent earnings data, and possibly by increased optimism over a deal between the USA and Iran to end the war.
Developments over this weekend have confirmed that some kind of deal, or at least the start of a deal, is probably extremely close, and if this is borne out, it will only send the market even higher, likely to new record highs where it will trade in blue sky.
The big round number at 7,500 might be acting as resistance, but once that is overcome, the price could go all the way to 8,000 before that happens again.
I think unless something goes awry with the deal, we will see this Index advance over the coming week, so I see this Index as a buy.
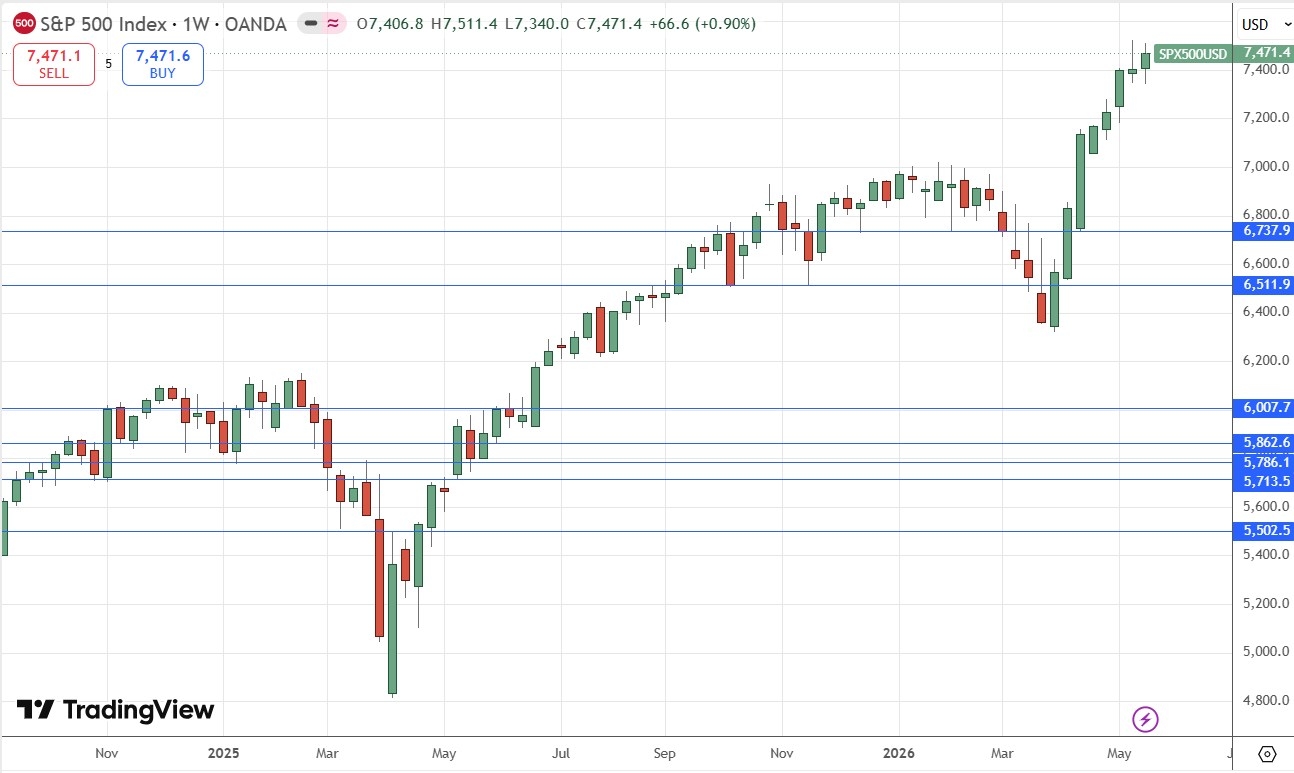
S&P 500 Index Weekly Price Chart
Everything I wrote above about the S&P 500 Index applies even more strongly to the NASDAQ 100 Index, which is doing even better as it contains a stronger concentration of booming AI-driven companies. The bullish momentum is a little stronger here, and the NASDAQ 100 has a notably higher average annual return than the S&P 500 Index.
I see this Index as a buy.
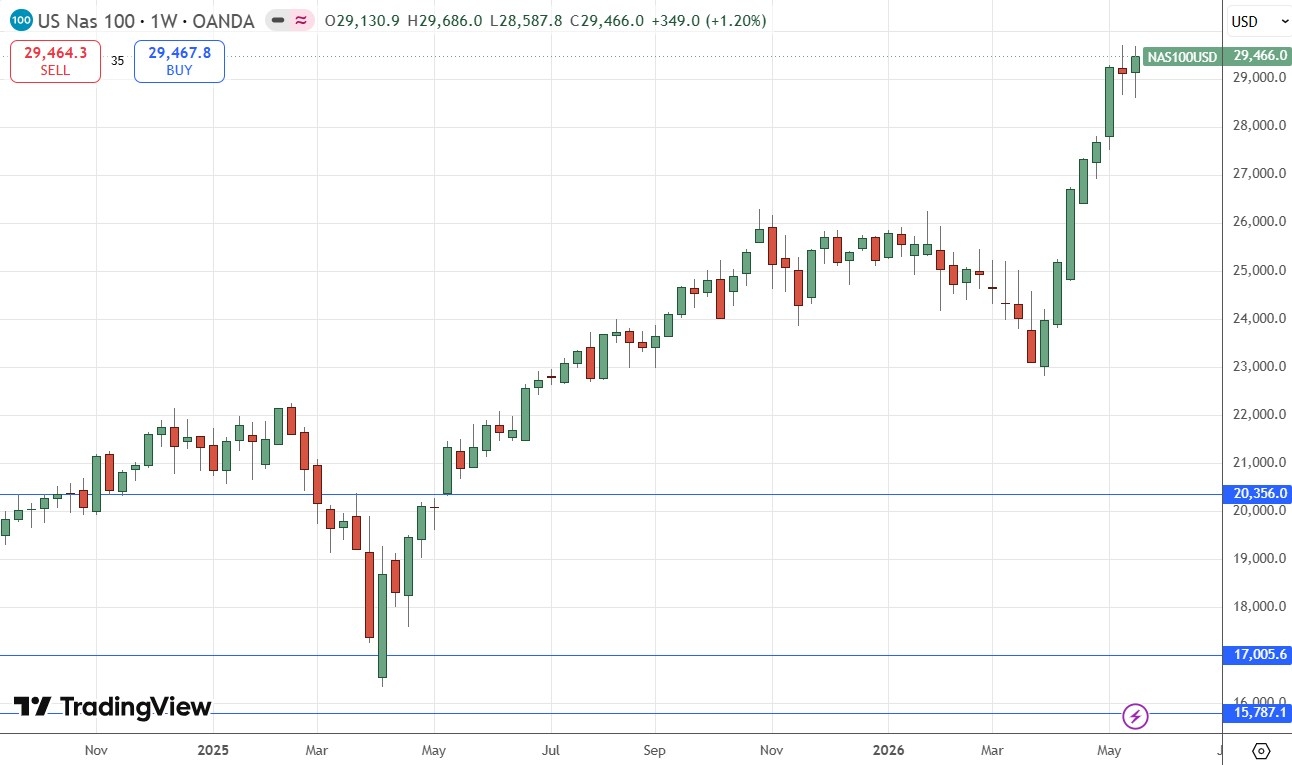
NASDAQ 100 Index Weekly Price Chart
Brent Crude Oil futures fell over the week, mostly due to increasing expectations that the USA and Iran will conclude a deal that would end the blockade of the Strait of Hormuz by both parties.
These expectations seem to be justified now, with President Trump stating that a memorandum of understanding is all but signed, with the first step the reopening of the Strait and a normalization in the Gulf.
This is extremely likely to lead to a significant gap lower when the market opens this week.
Of course, the deal could fall apart. As more details of the deal and related negotiations are revealed, there will likely be more uncertainty, and a stabilization of price movement.
Overall, it looks likely that we will see a decline in the price over the coming week, but this is still a dangerous bet to make over several days.
Day traders might want to look for short trades here on short time frames when there is bearish momentum, especially early in the week.
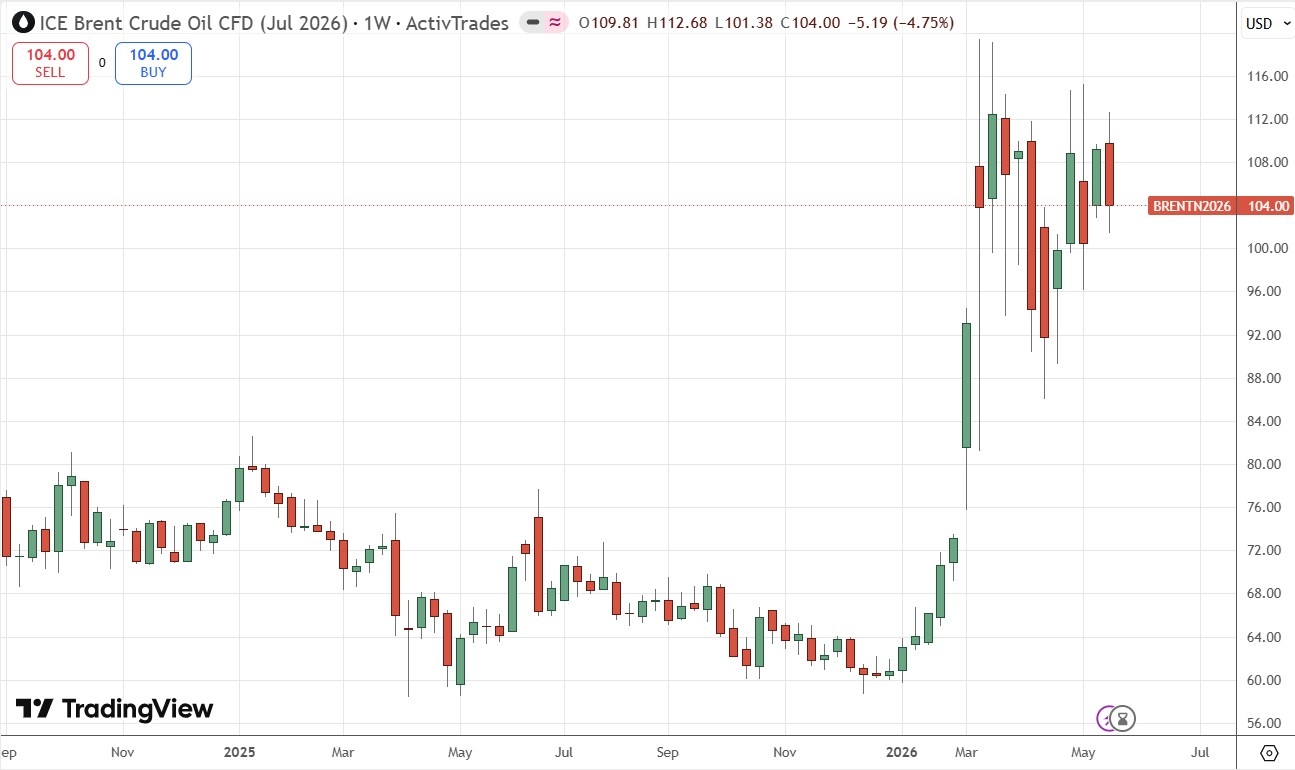
Brent Crude Oil Futures Weekly Price Chart
I see the best trades this week as:
Long of the AUD/USD currency pair.
Long of the S&P 500 Index.
Long of the NASDAQ 100 Index.
Ready to trade our Forex weekly forecast? Check out our list of the top Forex brokers.
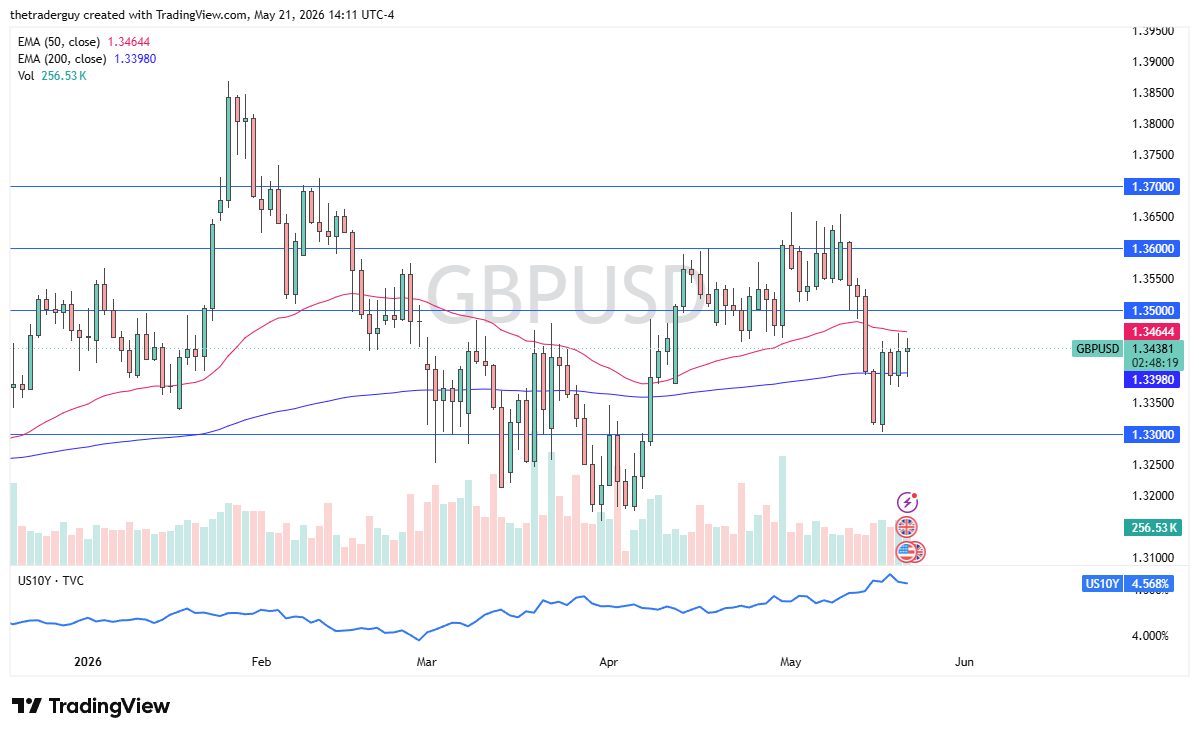
The British pound continues to be very noisy against the US dollar as we see the volatility and choppiness continue to cause chaos.
The 10-year yield in the United States did drop a little bit during the trading session, but it seems like we have found the 200-day EMA supported.
All things being equal, the GBP/USD market is basically stuck between the 200-day EMA underneath and the 50-day EMA above. With that being the case, I think it does make sense that we squeeze here a bit and, unfortunately for most traders, it’ll come down to what happens on the session on Friday with the bond markets. Bond markets, I think, will continue to reflect how they react to the latest headlines coming out of the Middle East or the global situation in general.
Keep in mind that there are a lot of concerns when it comes to whether or not there will be peace in the Middle East and that obviously has a major influence. I believe at this juncture that we are more likely than not to look at a market condition that will remain very agitated and therefore choppy.
The interest rates in Great Britain actually are higher than they are in the United States, but the differential is somewhat negligible. Because of this, I think this comes down to risk appetite more than anything else. The rates in the United States dropping is a good sign for the pound and, quite frankly, it’s a good sign for a lot of different currencies. Whether or not that remains the case, we’ll have to wait and see.
Keep in mind though, the United Kingdom has a lot of energy concerns that, quite frankly, the United States doesn’t have, so that could come into play longer term. To the upside, I think the buyers are targeting 1.35. To the downside, 1.3350 is support. Look for an impulsive candle that should give you a heads up as to where we’re going.
Ready to trade our daily GBP/USD Forex forecast? Here’s some of the best forex broker UK reviews to check out.
Christopher Lewis has been trading Forex and has over 20 years experience in financial markets. Chris has been a regular contributor to Daily Forex since the early days of the site. He writes about Forex for several online publications, including FX Empire, Investing.com, and his own site, aptly named The Trader Guy. Chris favours technical analysis methods to identify his trades and likes to trade equity indices and commodities as well as Forex. He favours a longer-term trading style, and his trades often last for days or weeks.
As seen on: Pairs Of Aces Podcast,The Trader Guy, FXEmpire
This report is an independent strategic category study of the market for decaf coffee variety pack in China. It is designed for brand owners, general managers, category leaders, trade-marketing teams, e-commerce teams, retail partners, distributors, investors, and market entrants that need a clear read on where growth sits, which brands control the category, how pricing and promotion shape demand, and which channels matter most for scale and margin.
The framework is built for Packaged Coffee & Beverages markets within consumer goods, where performance is driven by need states, shopper missions, brand hierarchies, price-pack architecture, retail execution, promotional intensity, and route-to-market control rather than by a narrow technical specification alone. It defines decaf coffee variety pack as A curated assortment of decaffeinated coffee products, typically including multiple roast profiles, origins, or brewing formats, sold as a single SKU for consumer trial, convenience, or subscription and maps the market through category boundaries, consumer segments, usage occasions, channel structure, brand and private-label positions, supply and availability logic, pricing and promotion mechanics, and country-level commercial roles. Historical analysis typically covers 2012 to 2025, with forward-looking scenarios through 2035.
This report is designed to answer the questions that matter most to brand, category, channel, and strategy teams in consumer-goods markets.
At its core, this report explains how the market for decaf coffee variety pack actually works as a consumer category. It is built to show where demand comes from, which need states and shopper missions matter most, which brands and private-label players shape the category, which channels control visibility and conversion, and where pricing power, repeat purchase, and margin are actually created.
Rather than framing the category through narrow technical attributes, the study breaks it into decision-grade commercial layers: product format, benefit platform, shopper segment, purchase occasion, pack-price architecture, channel environment, promotional intensity, route-to-market control, and company archetype. It is therefore useful both for teams shaping portfolio strategy and for teams executing growth through End Consumer (DTC), Grocery Retailer (Category Manager), Specialty Food Store Buyer, Corporate Procurement (Gifting), and Hospitality/Foodservice Buyer.
The report also clarifies how value pools differ across Daily caffeine-free consumption, Evening coffee occasion, Health-conscious & sensitive consumer routines, and Gifting & trial for new decaf drinkers, how premiumization and private label reshape category economics, how retail concentration and route-to-market design affect scale, and which countries matter most for brand building, sourcing, packaging, and channel expansion.
The report is based on an independent market-intelligence methodology that combines category reconstruction, public company evidence, retail and channel mapping, pricing review, and multi-layer triangulation. It is built for consumer categories where no single public dataset captures the real structure of demand, brand power, promotion, and channel control.
The evidence stack typically combines company disclosures, investor materials, brand and retailer product pages, e-commerce assortment checks, packaging and claims analysis, public pricing references, trade statistics where relevant, regulatory and labeling guidance, and observable route-to-market evidence from distributors, retailers, merchandisers, and marketplace ecosystems.
The analytical model then reconstructs the category across the layers that matter commercially: category scope, shopper need states, consumer segments, pack-price ladders, brand and private-label hierarchy, channel power, promotional intensity, route-to-market design, and country role differences.
Special attention is given to Health & wellness trends reducing caffeine intake, Evening/afternoon coffee occasion growth, Aging population & caffeine sensitivity, Premiumization & exploration in decaf segment, and Subscription & discovery box popularity. The objective is not only to size the market, but to explain where value pools sit, which segments drive mix and repeat purchase, which channels shape growth, and how leading brands defend or expand their positions across End Consumer (DTC), Grocery Retailer (Category Manager), Specialty Food Store Buyer, Corporate Procurement (Gifting), and Hospitality/Foodservice Buyer.
The report does not rely on survey-based opinion as its core evidence base. Instead, it uses observable commercial signals and structured public evidence to build a decision-grade view for brand, category, retail, e-commerce, investment, and market-entry teams.
This report defines decaf coffee variety pack as A curated assortment of decaffeinated coffee products, typically including multiple roast profiles, origins, or brewing formats, sold as a single SKU for consumer trial, convenience, or subscription and treats it as a branded consumer category rather than as a narrow technical product class. The objective is to capture the real commercial market that category, brand, trade-marketing, and channel teams are managing.
Scope is determined by how the category is sold, merchandised, priced, and chosen in market. That means the report follows product formats, claims, price tiers, pack architecture, need states, and retail environments that shape Daily caffeine-free consumption, Evening coffee occasion, Health-conscious & sensitive consumer routines, and Gifting & trial for new decaf drinkers.
The study deliberately separates the category from adjacent baskets when they distort the economics or shopper logic of the market being measured. Typical exclusions therefore include Single-variety decaf coffee bags, Caffeinated coffee variety packs, Instant decaf coffee jars, Ready-to-drink (RTD) decaf coffee beverages, Decaf tea or other caffeine-free products, Coffee equipment & brewers, Coffee syrups & flavorings, Caffeinated coffee subscriptions, Specialty tea samplers, and Functional beverage packs.
The report provides focused coverage of the China market and positions China within the wider global consumer-goods industry structure.
The geographic analysis explains local consumer demand conditions, brand and private-label balance, retail concentration, pricing tiers, import dependence, and the country’s strategic role in the wider category.
This study is designed for strategic and commercial users across brand-led consumer categories, including:
In many brand-driven, channel-sensitive, and consumer-demand-led markets, official trade and production statistics are not sufficient on their own to describe the true market. Product boundaries may cut across multiple tariff codes, several product categories may be bundled into the same official classification, and a meaningful share of activity may take place through customized services, captive supply, platform relationships, or technically specialized channels that are not directly visible in standard statistical datasets.
For this reason, the report is designed as a modeled strategic market study. It uses official and public evidence wherever it is reliable and scope-compatible, but it does not force the market into a purely statistical framework when doing so would reduce analytical quality. Instead, it reconstructs the market through the logic of demand, supply, technology, country roles, and company behavior.
This makes the report particularly well suited to products that are innovation-intensive, technically differentiated, capacity-constrained, platform-dependent, or commercially structured around specialized buyer-supplier relationships rather than standardized commodity trade.
The report typically includes:
The US Dollar to Yen (USD/JPY) exchange rate has remained close to 159.0 after recovering from intervention-driven declines earlier this month.
Although the pair remains elevated in the near term, Deutsche Bank expects a gradual move lower over the medium term and forecasts USD/JPY at 150 by the end of 2026.
The bank believes that current levels continue to reflect exceptionally wide US-Japan yield differentials, which have supported sustained Yen weakness.
Over time, however, Deutsche Bank expects those yield gaps to narrow as US monetary policy gradually normalises and Japanese inflation remains firmer than in previous years.
The bank also considers that Japanese authorities remain uncomfortable with excessive Yen weakness and are likely to remain active if speculative selling intensifies.
While further gains towards 160 cannot be ruled out in the short term, Deutsche Bank expects the broader trend to favour a stronger Yen over the next 12-18 months.

At 9 a.m. Eastern Time today, oil was priced at $104.68 per barrel with Brent serving as the benchmark (we’ll explain different benchmarks later in this article). That’s a drop of $4.08 compared with yesterday morning and around $40.46 higher than the price one year ago.
It’s impossible to forecast oil prices with detailed precision. Many different elements affect the market, but ultimately it boils down to supply and demand. When worries about economic recession, war, and other large-scale disruptions increase, oil’s path can shift fast.
Gas prices at the pump don’t only track crude oil. They also include what it takes to refine and move that fuel, the taxes layered on top, and the extra markup your local station adds to stay in business.
Since crude oil generally makes up a majority of the per-gallon cost, changes in its price have an outsized impact. When oil surges, gas prices typically rise in tandem. But when oil retreats, gas prices often lag on the way down, a trend sometimes described as “rockets and feathers.”
In case of emergency, the U.S. has a store of crude oil known as the Strategic Petroleum Reserve. Its primary purpose is energy security in case of disaster (think sanctions, severe storm damage, even war). But it can also go a long way toward softening crippling price hikes during supply shocks.
It’s not a long-term answer and is more meant to provide temporary relief, assisting consumers and keeping critical parts of the economy running, like key industries, emergency services, public transportation, etc.
Both oil and natural gas are key sources of the energy we use every day. Because of this, a big change in oil prices can affect natural gas. For example, if oil prices increase, some industries may swap natural gas for some segments of their operations where possible, which increases demand for natural gas.
To gauge oil’s performance, we often turn to two benchmarks:
Between these two, Brent better represents global oil performance because it prices much of the world’s traded crude. And, it’s often the best way to track historical oil performance. In fact, even the U.S. Energy Information Administration now uses Brent as its primary reference in its Annual Energy Outlook.
Looking at the Brent benchmark across several decades, oil has been anything but steady. It’s seen spikes due to factors such as wars and supply cuts, and it’s also seen crashes from global recessions and an oversupply (called a “glut”). For example:
All to say, oil’s historical performance has been anything but smooth. Again, it’s hugely affected by wars, recessions, OPEC whims, evolving energy initiatives and policies, and much more.
Looking to stay up-to-date regarding the latest energy developments? Check out our recent coverage:
The current price of oil per barrel depends largely on supply and demand, including news about potential future supply and demand (geopolitics, decisions made by OPEC+, etc.). In the U.S., prices also move based on how friendly an administration is to drilling, as it can affect future supply. For example, 2025 saw the Trump administration move to reopen more than 1.5 million acres in the Coastal Plain of the Arctic National Wildlife Refuge for oil and gas leasing, reversing the Biden administration’s policy of limiting oil drilling in the Arctic.
The price of oil updates constantly when the “futures” markets are open. A futures market is effectively an auction where people agree to buy or sell oil in the future. As long as people and companies are trading contracts, the oil price is changing.
In short, shale is rock that contains oil and natural gas. Think of shale as energy yet to be tapped. The more shale the U.S. accesses, the more energy we’ll have—and the more easily oil prices can keep from spiking as much thanks to a greater supply.
When oil is expensive, it tends to make everyday items cost more. This can be related to energy (your heating, gas utilities, etc.), but it’s also due to the logistics involved with making those items accessible to you. Shipping, for example, can affect the price of things at the grocery store, as it’s more expensive to get those products from warehouses and farms onto the shelf.
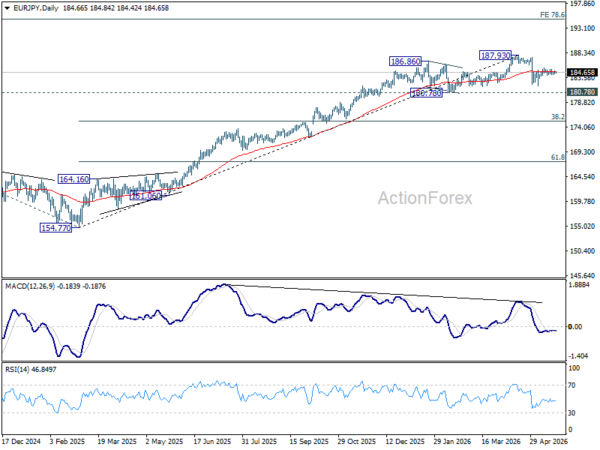
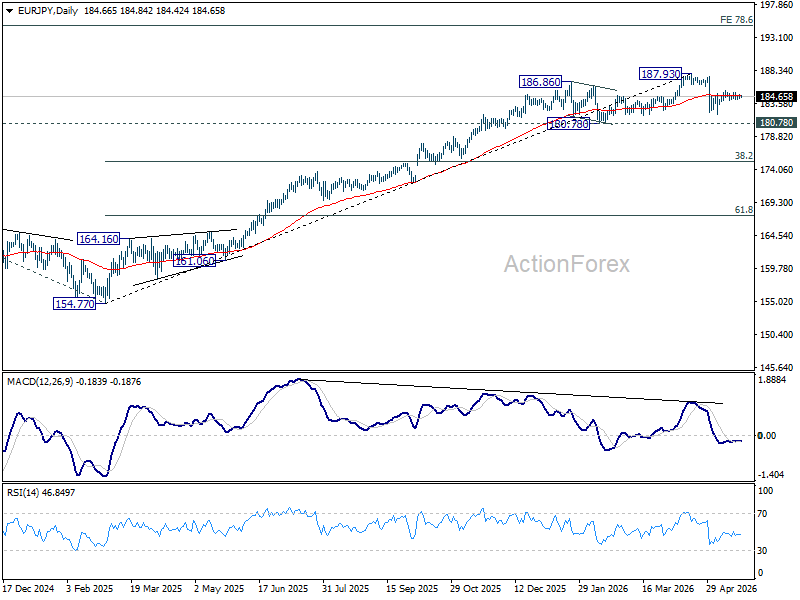
EUR/JPY was bounded in range below 185.44 last week and outlook is unchanged. Initial bias remains neutral this week first. Fall from 187.93 should have completed at 182.01. Above 185.44 will extend the rebound from there to retest 187.93. However, firm break of 184.02 support will bring deeper decline back to 182.01.
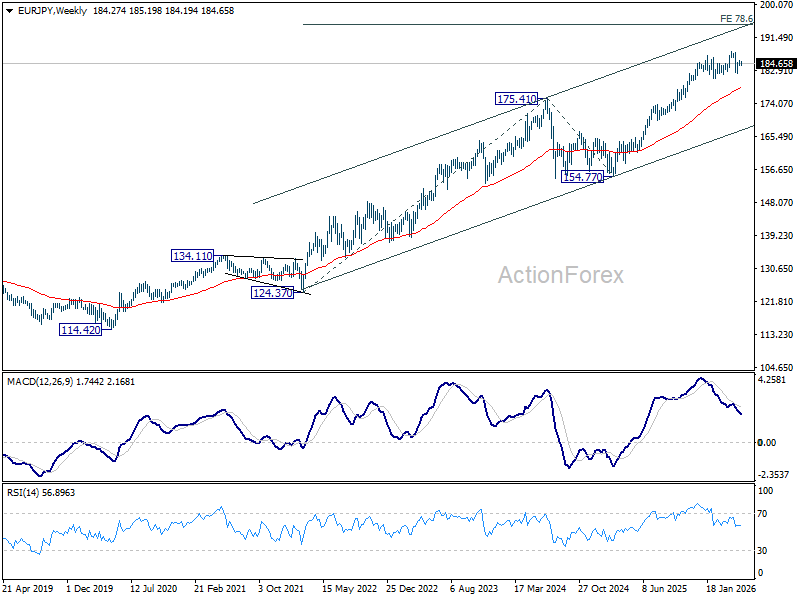
In the bigger picture, the pullback from 187.93 is steep, there is no sign of reversal yet. Uptrend from 114.42 (2020 low) is still expected to resume at a later stage to 78.6% projection of 124.37 (2022 low) to 175.41 (2025 high) from 154.77 at 194.88. However, sustained break of 55 W EMA (now at 178.27) will argue that it’s already in a medium term down trend to 175.41 resistance turned support and below.
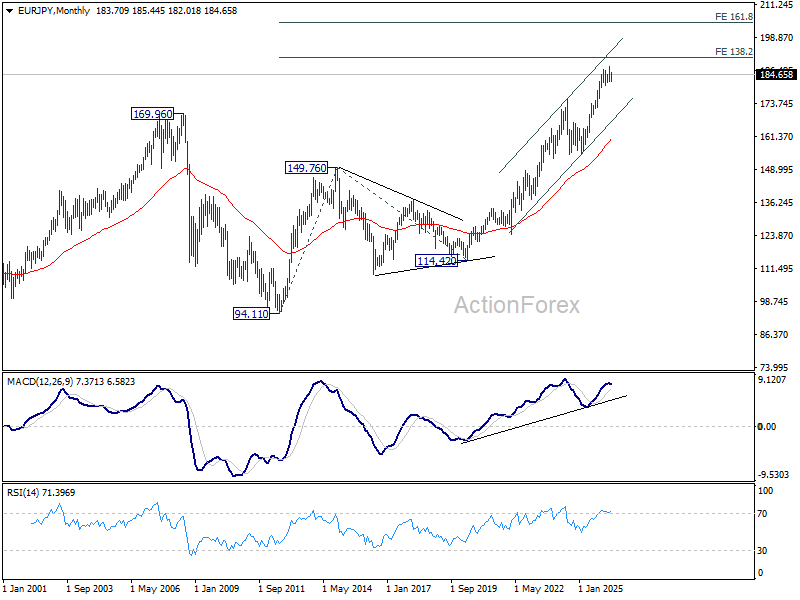
In the long term picture, up trend from 94.11 (2021 low) is in progress. Next target is 138.2% projection of 94.11 to 149.76 (2014 high) from 114.42 (2020 low) at 191.32. This will remain the favored case as long 55 W EMA (now at 178.27) holds.
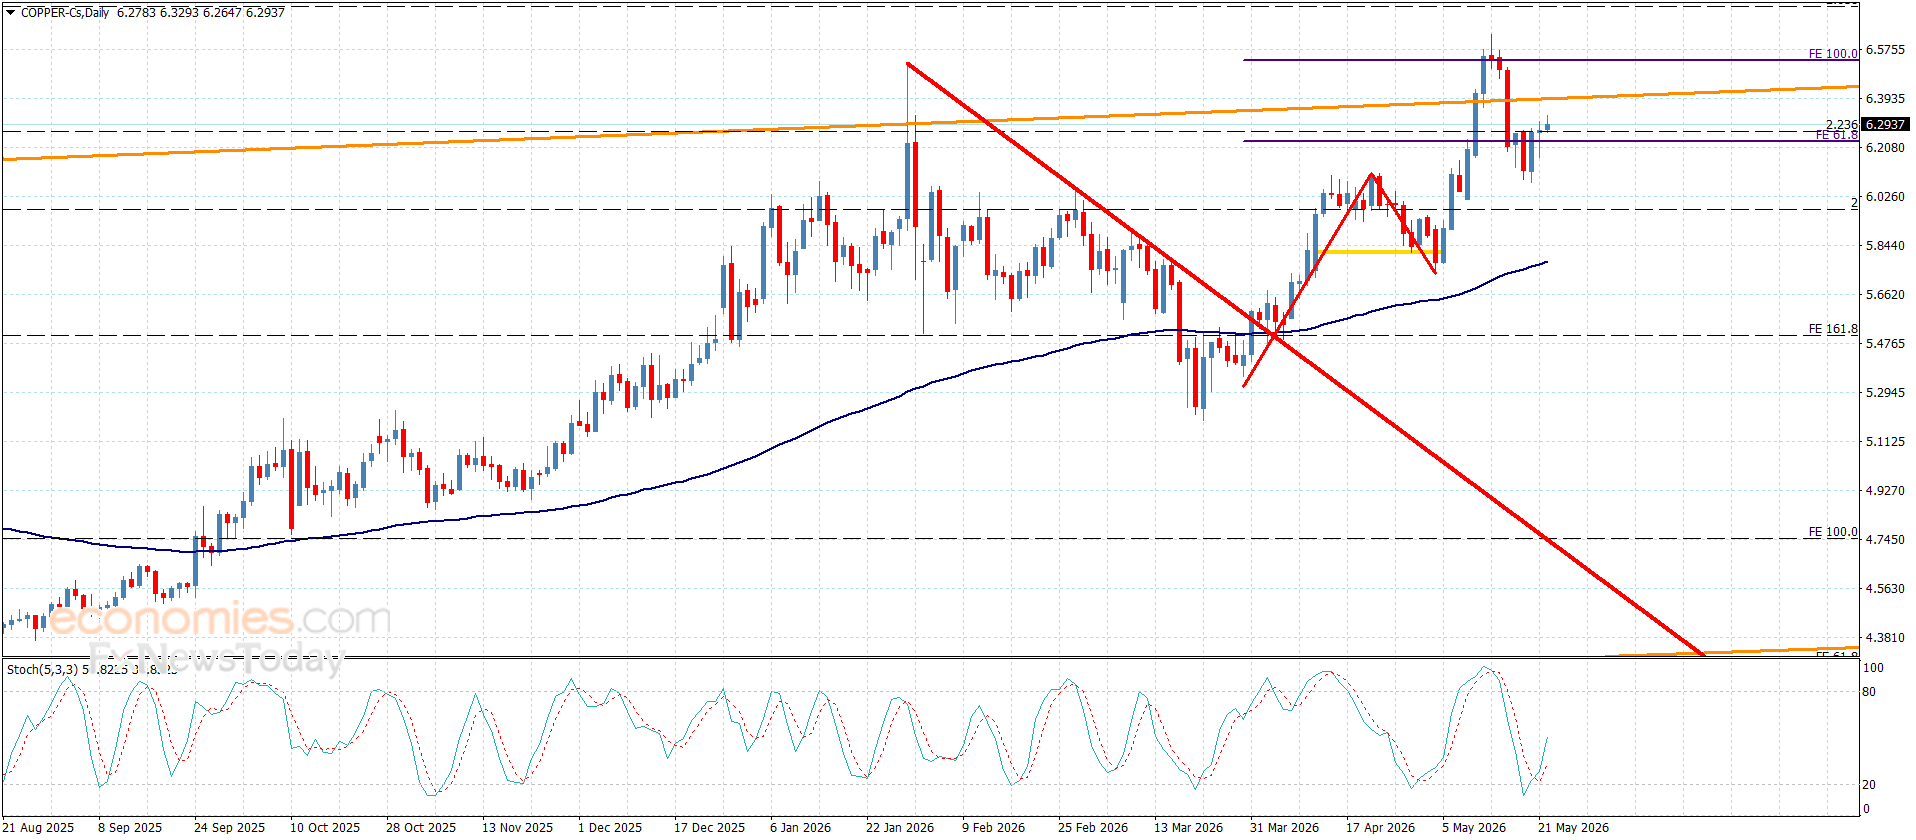
Copper price was forced to provide weak trading due to the continuation of the main indicators’ contradiction against the negative stability below the barrier at $6.3800 level, to force it to delay the corrective decline and hold near $6.2800 level.
Note that confirming the dominance of the bearish corrective trend needs to break the initial support at $6.1000, to ease the mission of the corrective stations, which might begin at $5.9500 and $58000, while surpassing the barrier will provide a chance for recording some gains, to expect attacking the resistance near $6.5800.
The expected trading range for today is between $6.1000 and$6.3500
Trend forecast: Bearish
The Japan caffeine free ground coffee market sits within the broader consumer goods and FMCG landscape, where coffee consumption per capita exceeds 3.5 kg annually, placing Japan among the top Asian markets. Decaffeinated ground coffee, however, remains a small niche. Its penetration of roughly 2–4% of ground coffee volume contrasts with leading markets such as the United States (12–15%) and Germany (10–13%). This gap reflects both cultural preferences for full-caffeine brews and a historically limited range of decaf offerings.
The product is a tangible, shelf-stable consumer good sold predominantly through grocery retail, convenience stores, and increasingly through e-commerce. Decaf ground coffee in Japan is almost exclusively roasted and ground domestically from imported decaffeinated green beans; no raw coffee is grown locally, and decaffeination infrastructure does not exist at commercial scale within the country. The market is thus shaped by global supply chains for green beans and decaffeination services, regional trade agreements, and domestic branding strategies.
Over the past five years, the segment has gradually moved from a functional alternative for medical caffeine restrictions to a lifestyle choice, supported by improved decaffeination technologies that preserve aroma and flavour. This evolution is expected to continue as health awareness deepens among Japan’s ageing population and younger cohorts adopt flexible caffeine consumption patterns.
Although exact absolute volumes for the caffeine free ground coffee market are not publicly disaggregated in official statistics, market signals point to steady, above-average expansion. The segment is likely growing at a compound annual rate of 4–6% in volume terms from a 2024–2025 base, compared with 1–2% for the overall ground coffee market in Japan. Decaf ground coffee retail volume is estimated to have reached 6,000–9,000 tonnes in 2025, representing roughly 2.5–3.5% of total ground coffee consumption.
Growth is underpinned by structural demographic shifts: Japan’s population aged 65 and older will exceed 33% by 2035, a cohort with higher incidence of doctor-recommended caffeine reduction. Additionally, the evening coffee occasion—once rare due to caffeine concerns—is being actively cultivated by roasters through decaf offerings, particularly in the premium segment. Foodservice and office coffee service (OCS) channels are also increasing decaf menu presence, with several major OCS operators reporting 8–12% year-on-year growth in decaf pod sales in 2024.
The market’s relatively small base means that even modest shifts in consumer behaviour can translate into double-digit growth rates for individual brands. Over the forecast horizon to 2035, market volume could double if decaf’s share of ground coffee rises to 5–7%, which is plausible given the convergence of health drivers, product quality improvements, and marketing investment.
Demand for caffeine free ground coffee in Japan breaks down clearly by process type, application, and buyer group. By decaffeination method, the Swiss Water Process and CO2 Process segments together account for an estimated 40–50% of volume, driven by consumer preference for “chemical-free” claims. Ethyl Acetate (sugar cane) process holds roughly 20–25%, while direct solvent (methylene chloride) methods have declined to under 15% due to negative perception. At-home consumption dominates end-use, representing 60–70% of volume, as health-conscious households integrate decaf into morning or evening routines.
Office and workplace consumption accounts for 15–20%, with simple drip or pour-over formats preferred due to convenience. Foodservice (cafés, small hotels, B&Bs) makes up the remainder; however, many specialty coffee shops still prioritise whole bean decaf, limiting ground decaf foodservice penetration. Buyer groups are led by individual consumers—particularly those aged 45+, health-oriented, and caffeine-sensitive. Grocery retail category managers increasingly allocate shelf space to decaf, typically assigning 2–4% of the coffee aisle, up from 1–2% a decade ago.
Corporate procurement for office supply is a smaller but growing channel, with procurement managers responding to employee wellness requests. End-use sectors are predominantly consumer households; healthcare facilities (hospitals, nursing homes) represent a niche but stable demand for decaf in institutional catering. Premium/specialty decaf brands are gaining share within the home segment, while private label remains concentrated in the value tier, accounting for an estimated 10–15% of retail decaf volume.
Pricing in Japan’s caffeine free ground coffee market is stratified across four distinct layers. Ultra-value private label and economy brands retail at ¥600–900 per 200g bag, typically using lower-cost ethyl acetate decaf and commodity-grade washed arabica. Mainstream national brands—such as AGF, UCC, and Key Coffee’s mass-market lines—sit at ¥800–1,200, offering consistent flavour and widespread availability. Premium/specialty brands, including imported names like Illy Decaf and Lavazza Dek, along with domestic specialty roasters, command ¥1,500–2,500 per 200g, often labelled Swiss Water or CO2 processed and single-origin.
Super-premium artisan DTC brands can exceed ¥3,000 for small-batch, micro-lot decaf. The 15–25% premium over regular ground coffee across all tiers reflects the added cost of decaffeination, which adds roughly ¥150–250 per kg of green bean input. Logistics for imported decaf green beans—shipped from dedicated processing hubs in Canada, Germany, or Colombia—incur freight and storage costs that can add 10–15% to landed cost.
Currency fluctuations also affect pricing: the yen’s depreciation against the US dollar in 2023–2025 raised import costs by an estimated 20–30% for green coffee, compressing margins for roasters that hesitated to pass through full increases. Domestic roasting, packaging, and distribution costs are relatively stable, but packaging lead times during peak demand (pre-summer and year-end seasons) can create short-term price volatility for specialty packs. Organic certification and fair-trade premiums add ¥200–400 per pack at retail, a growing sub-segment that appeals to younger urban buyers.
The competitive landscape for caffeine free ground coffee in Japan is shaped by a mix of global brand owners, domestic mass-market roasters, and an emerging cohort of specialty challengers. Among global brand owners, Nestlé’s Nescafé Gold Blend Decaf and Starbucks’ retail decaf offerings hold significant shelf presence, distributed through grocery and convenience channels. Domestic mass-market portfolio houses—UCC Holdings, Key Coffee, and AGF (Ajinomoto General Foods)—dominate the mid-tier segment, each offering decaf lines that leverage established distribution networks and consumer trust.
These firms source decaf green beans primarily from Swiss Water (Canada) and CO2-process (Germany) suppliers under long-term contracts. Premium and innovation-led challengers include Doutor Coffee’s retail line, along with specialty roasters such as Kurasu (Kyoto) and Obubu Tea & Coffee, which focus on single-origin decaf and direct-to-consumer sales. The private-label segment is led by major retailer groups—Seven & i Holdings (Seven Premium brand), Aeon (Topvalu), and Don Quijote (Donki)—which use contract manufacturing and white-label partners for decaf ground coffee.
Vertical DTC decaf specialists, though small in volume, are growing rapidly through subscription models and social media marketing. Competition is intensifying as more roasters introduce decaf to capture the growing health-conscious consumer base. Market evidence points to moderate concentration: the top five branded suppliers likely control 65–75% of decaf ground coffee volume, with private label taking 10–15% and specialty brands the remainder. Product differentiation increasingly hinges on decaffeination process claims, origin transparency, and packaging technology (aroma-lock bags, resealable formats) rather than price alone.
Japan has no coffee bean cultivation due to its temperate climate; all green coffee beans are imported. Domestic production of caffeine free ground coffee therefore consists entirely of roasting, grinding, and packaging of decaffeinated green beans received from overseas processing hubs. Roasting capacity in Japan is substantial—the country operates over 200 industrial and artisanal roasting facilities—but decaffeination is not performed at any meaningful scale domestically.
The absence of local decaffeination plants is driven by high capital investment requirements (a Swiss Water or CO2 plant typically costs US$20–40 million), stringent environmental regulations for solvent use, and the lack of sufficient green coffee throughput to achieve economies of scale for a dedicated decaf-only operation. Consequently, all decaf ground coffee sold in Japan starts with green beans that have been decaffeinated in origin countries or specialised processing centres: Swiss Water Process in Vancouver, Canada; CO2 process in Bremen, Germany; and ethyl acetate process in Colombia and Mexico.
These imported decaf green beans are stored in Japanese roasters’ warehousing, then roasted in small-to-medium batches to preserve the delicate flavour profile that decaf requires. Roasting parameters (lower initial charge temperature, shorter development time) are critical to avoid over-roasting and bitterness. The domestic supply chain for decaf ground coffee is thus a chain of international links: origin farm → decaffeination facility → shipping to Japan → roasting/grinding → packaging → distribution. Lead times from order to retail shelf range from 6 to 14 weeks, depending on origin, decaf process, and seasonal demand peaks.
Any disruption at a key decaffeination hub (e.g., plant maintenance, labour strike, shipping lane congestion) can create short-term supply constraints for Japanese roasters, who typically hold 8–12 weeks of decaf green bean inventory as a buffer.
Japan is a net importer of all coffee forms, and the decaf ground coffee segment follows this pattern. Trade flows occur at two levels: imports of finished roasted decaf ground coffee (HS 090122) and, more significantly, imports of decaffeinated green coffee beans (HS 090112) for domestic roasting. In 2025, estimated imports of roasted decaf coffee into Japan totalled 2,500–3,500 tonnes, with principal origins being Germany (home to several large CO2 decaf roasters), Switzerland (Swiss Water process roasted packs), and Italy (Illy, Lavazza).
However, the larger volume by far—approximately 12,000–16,000 tonnes—is imported as decaf green beans (HS 090112) for domestic roasting. These green decaf beans primarily arrive from Canada (Swiss Water), Germany (CO2), and Colombia (EA process). Japan also exports negligible quantities of caffeine free ground coffee, mainly to neighbouring Asian markets for Japanese expatriate communities.
Tariff treatment is an important trade consideration; under the World Trade Organization (WTO) most-favoured-nation (MFN) regime, Japan applies a duty of approximately 12% on roasted coffee (HS 090122) and 10% on green coffee (HS 090112), though preferential rates exist under Economic Partnership Agreements (EPAs) with Europe, Switzerland, and Canada. For instance, roasted decaf from Switzerland enters duty-free under the Japan-Switzerland EPA, providing a cost advantage for Swiss Water process brands.
The yen’s exchange rate directly affects import costs: during periods of yen depreciation (as in 2022–2025), landed costs for decaf green beans rose 25–30%, leading to retail price increases and margin compression for roasters unable to fully pass through costs. Trade data patterns suggest that decaf imports have grown 5–8% annually in volume since 2020, outpacing total coffee import growth, reflecting the segment’s nascent expansion.
Retail grocery channels dominate distribution for caffeine free ground coffee in Japan. Supermarkets and hypermarkets—including chains like Aeon, Ito-Yokado, and Seiyu—account for an estimated 50–60% of retail decaf volume, offering both national brands and private-label options. Convenience stores (Seven-Eleven, FamilyMart, Lawson) represent 15–20% of volume, with smaller pack sizes (100–150g) and single-serve drip bags gaining popularity for on-the-go consumption. Drugstores and health food stores contribute a further 5–10%, often carrying organic and fair-trade certified decaf.
E-commerce is the fastest-growing channel, estimated at 15–20% of decaf ground coffee sales in 2026, driven by specialty DTC brands and subscription models. Amazon Japan, Rakuten, and brand-specific websites offer wider assortments than physical stores, particularly for premium imported decaf. Office coffee service (OCS) distributors serve corporate and institutional buyers, providing decaf ground coffee in bulk packs and single-serve pods; this channel accounts for 10–15% of total decaf volume and is expanding as wellness initiatives in workplaces increase.
Foodservice distribution to cafés and small hospitality venues represents 8–12% of decaf ground coffee consumption, though many specialty cafés still prefer whole bean decaf. Buyer groups vary by channel: at retail, the primary purchaser is the health-conscious individual aged 45–65, while online buyers skew younger (25–44) and more experimental. Grocery category managers make stocking decisions based on category growth rates and margins; decaf typically commands 20–25% higher gross margins than regular coffee, incentivising increased shelf allocation.
Corporate procurement for office supply selects decaf based on staff surveys and price per cup, often favouring mainstream national brands or OCS-specific blends. Institutional buyers in healthcare facilities prioritise low-caffeine compliance and often require packaging that clearly indicates caffeine content and process type.
Caffeine free ground coffee sold in Japan must comply with the Food Sanitation Act and the Food Labelling Standards enforced by the Consumer Affairs Agency. Key requirements include accurate ingredient listing, net weight, and allergen declarations. The term “caffeine free” is regulated: products must contain no more than 0.1% caffeine on a dry weight basis, aligning with international norms set by the Codex Alimentarius. Any decaffeination process claim—such as “Swiss Water Process” or “CO2 Process”—must be substantiated and must not mislead consumers regarding chemical residues.
For organic certification, the Japan Agricultural Standards (JAS) system provides third-party verification; although voluntary, JAS Organic certification is increasingly used by premium decaf brands to differentiate. Imported decaf products must also clear inspection by the Ministry of Health, Labour and Welfare (MHLW) under the Food Sanitation Act, which includes random sampling for pesticide residues and processing contaminants. For decaf processed with methylene chloride, residue limits are strictly enforced; Japan’s maximum residue level (MRL) for methylene chloride in coffee is 0.1 mg/kg, consistent with international standards.
The Act on Promotion of Recycling and Related Matters (Container and Packaging Recycling Law) affects packaging design, requiring roasters to minimise plastic use and promote recyclability—a factor influencing the shift toward paper-based, compostable packaging for decaf ground coffee. Fair trade and sustainability certifications (Fairtrade, Rainforest Alliance) are not legally mandated but are increasingly displayed on packaging to appeal to environmentally and socially conscious buyers.
The regulatory environment is stable and well-defined, with no imminent changes expected to categorically disrupt the market, though stricter labelling of residual solvents could emerge in line with EU trends, which would advantage process methods that avoid chemical solvents.
The Japan caffeine free ground coffee market is projected to sustain robust growth through 2035, with volume likely to expand at a compound annual rate of 4.5–6.5% from the 2026 base. This growth rate is 2–3 times the expected pace for the overall ground coffee market, reflecting the combination of structural demographic demand (aging population, increasing doctor-recommended caffeine reduction) and behavioural shifts (evening consumption occasions, health optimisation).
By 2035, decaf ground coffee’s share of total ground coffee volume could reach 5–7% in Japan, up from 2–4% in 2026—a range that would see annual volume in the 13,000–19,000 tonne region, depending on base assumptions. The premium segment is forecast to grow fastest, outpacing mass-market decaf by 2–3 percentage points per year, as consumers trade up to single-origin, flavour-preserved, and certified decaf products. E-commerce and subscription channel share is expected to rise from 15–20% in 2026 to 25–35% by 2035, driven by DTC brand growth and the convenience of repeat ordering for a staple product.
Office and institutional demand will likely grow in line with corporate wellness programmes, while foodservice decaf penetration will increase modestly as more cafés add ground decaf options. Import dependence will persist; however, domestic roasters may invest in smaller-scale, specialised decaffeination partnerships (e.g., mini-CO2 plants at roasteries) to reduce lead times and differentiate. The most significant upside risk is the possibility that Japanese consumer acceptance of decaf accelerates faster than modelled, particularly if mainstream media and health influencer endorsements broaden the perceived benefits.
Downside risks include prolonged yen weakness, which would raise import costs and potentially dampen volume growth in the value tier, and the emergence of alternative caffeine-free coffee substitutes (e.g., chicory-based, mushroom coffee) that could compete for the same consumer spend. Overall, the market outlook is positive, with steady expansion anchored by solid macro-demographic drivers and improving product quality.
The most compelling growth opportunities in Japan’s caffeine free ground coffee market lie in premiumisation and channel innovation. Domestic roasters that have traditionally focused on mass-market blends can develop proprietary decaf lines using high-quality single-origin beans (e.g., Colombian Excelso or Ethiopian Yirgacheffe) decaffeinated via Swiss Water or CO2, then marketed on flavour preservation and origin story. Such products can command prices 50–100% above standard decaf, improving margins while attracting the health-conscious premium segment.
Another opportunity exists in the office coffee service (OCS) segment: few OCS operators currently offer a differentiated decaf product, leaving a gap for a branded decaf ground coffee tailored to corporate wellness initiatives, possibly in compostable single-serve pods that align with ESG goals. Direct-to-consumer subscription models also present a scalable path for niche decaf specialists; the combination of automated replenishment, personalised roast profiles, and educational content (e.g., “evening brew” positioning) can build recurring revenue and customer loyalty.
Furthermore, there is room for collaboration between Japanese roasters and international decaffeination hubs to develop co-branded products that leverage Japan’s reputation for precision and quality—for instance, a Japanese roasting company contracting a dedicated production run at a Swiss Water facility and marketing it as “precision-decaf for Japanese palates.” On the certification front, obtaining JAS Organic and Fairtrade labels for decaf offerings can open doors to high-margin channels such as natural food stores (e.g., Bio c’ Bon, Natural House) and hospital cafeterias.
Finally, the aging population creates an underserved segment of consumers who are caffeine-sensitive but still desire a full coffee experience; roasters that design easy-to-brew ground decaf formats (e.g., drip bags with clear brewing instructions for older adults) could capture significant loyalty. These opportunities, while requiring upfront investment in sourcing and marketing, are well aligned with the demographic and lifestyle trends that will define the Japanese coffee market over the next decade.
This report is an independent strategic category study of the market for caffeine free ground coffee in Japan. It is designed for brand owners, general managers, category leaders, trade-marketing teams, e-commerce teams, retail partners, distributors, investors, and market entrants that need a clear read on where growth sits, which brands control the category, how pricing and promotion shape demand, and which channels matter most for scale and margin.
The framework is built for Consumer Packaged Goods (CPG) – Beverage markets within consumer goods, where performance is driven by need states, shopper missions, brand hierarchies, price-pack architecture, retail execution, promotional intensity, and route-to-market control rather than by a narrow technical specification alone. It defines caffeine free ground coffee as Ground coffee specifically processed to remove caffeine, targeting consumers seeking the taste and ritual of coffee without its stimulant effects and maps the market through category boundaries, consumer segments, usage occasions, channel structure, brand and private-label positions, supply and availability logic, pricing and promotion mechanics, and country-level commercial roles. Historical analysis typically covers 2012 to 2025, with forward-looking scenarios through 2035.
This report is designed to answer the questions that matter most to brand, category, channel, and strategy teams in consumer-goods markets.
At its core, this report explains how the market for caffeine free ground coffee actually works as a consumer category. It is built to show where demand comes from, which need states and shopper missions matter most, which brands and private-label players shape the category, which channels control visibility and conversion, and where pricing power, repeat purchase, and margin are actually created.
Rather than framing the category through narrow technical attributes, the study breaks it into decision-grade commercial layers: product format, benefit platform, shopper segment, purchase occasion, pack-price architecture, channel environment, promotional intensity, route-to-market control, and company archetype. It is therefore useful both for teams shaping portfolio strategy and for teams executing growth through End Consumers (Health-conscious, caffeine-sensitive), Grocery Retail Category Managers, Foodservice Distributors, and Corporate Procurement for Office Supply.
The report also clarifies how value pools differ across Home brewing (drip, pour-over, French press), Office coffee service, and Small-scale foodservice where whole bean grinding is impractical, how premiumization and private label reshape category economics, how retail concentration and route-to-market design affect scale, and which countries matter most for brand building, sourcing, packaging, and channel expansion.
The report is based on an independent market-intelligence methodology that combines category reconstruction, public company evidence, retail and channel mapping, pricing review, and multi-layer triangulation. It is built for consumer categories where no single public dataset captures the real structure of demand, brand power, promotion, and channel control.
The evidence stack typically combines company disclosures, investor materials, brand and retailer product pages, e-commerce assortment checks, packaging and claims analysis, public pricing references, trade statistics where relevant, regulatory and labeling guidance, and observable route-to-market evidence from distributors, retailers, merchandisers, and marketplace ecosystems.
The analytical model then reconstructs the category across the layers that matter commercially: category scope, shopper need states, consumer segments, pack-price ladders, brand and private-label hierarchy, channel power, promotional intensity, route-to-market design, and country role differences.
Special attention is given to Health concerns (anxiety, sleep, blood pressure), Doctor/lifestyle recommendations to reduce caffeine, Demand from aging population, Growth of evening coffee consumption occasion, and Premiumization within decaf segment. The objective is not only to size the market, but to explain where value pools sit, which segments drive mix and repeat purchase, which channels shape growth, and how leading brands defend or expand their positions across End Consumers (Health-conscious, caffeine-sensitive), Grocery Retail Category Managers, Foodservice Distributors, and Corporate Procurement for Office Supply.
The report does not rely on survey-based opinion as its core evidence base. Instead, it uses observable commercial signals and structured public evidence to build a decision-grade view for brand, category, retail, e-commerce, investment, and market-entry teams.
This report defines caffeine free ground coffee as Ground coffee specifically processed to remove caffeine, targeting consumers seeking the taste and ritual of coffee without its stimulant effects and treats it as a branded consumer category rather than as a narrow technical product class. The objective is to capture the real commercial market that category, brand, trade-marketing, and channel teams are managing.
Scope is determined by how the category is sold, merchandised, priced, and chosen in market. That means the report follows product formats, claims, price tiers, pack architecture, need states, and retail environments that shape Home brewing (drip, pour-over, French press), Office coffee service, and Small-scale foodservice where whole bean grinding is impractical.
The study deliberately separates the category from adjacent baskets when they distort the economics or shopper logic of the market being measured. Typical exclusions therefore include Whole bean decaffeinated coffee, Instant/soluble decaffeinated coffee, Decaffeinated coffee pods/capsules (e.g., K-Cups), Ready-to-drink (RTD) decaf coffee beverages, Caffeinated ground coffee, Herbal coffee substitutes (e.g., chicory, barley), Tea and other hot beverages, Coffee flavorings and syrups, and Coffee brewing equipment.
The report provides focused coverage of the Japan market and positions Japan within the wider global consumer-goods industry structure.
The geographic analysis explains local consumer demand conditions, brand and private-label balance, retail concentration, pricing tiers, import dependence, and the country’s strategic role in the wider category.
This study is designed for strategic and commercial users across brand-led consumer categories, including:
In many brand-driven, channel-sensitive, and consumer-demand-led markets, official trade and production statistics are not sufficient on their own to describe the true market. Product boundaries may cut across multiple tariff codes, several product categories may be bundled into the same official classification, and a meaningful share of activity may take place through customized services, captive supply, platform relationships, or technically specialized channels that are not directly visible in standard statistical datasets.
For this reason, the report is designed as a modeled strategic market study. It uses official and public evidence wherever it is reliable and scope-compatible, but it does not force the market into a purely statistical framework when doing so would reduce analytical quality. Instead, it reconstructs the market through the logic of demand, supply, technology, country roles, and company behavior.
This makes the report particularly well suited to products that are innovation-intensive, technically differentiated, capacity-constrained, platform-dependent, or commercially structured around specialized buyer-supplier relationships rather than standardized commodity trade.
The report typically includes: